
Abstract
Using pillars and sub-index from the Travel and Tourism Competitiveness Index (T & TCI) to measure a destination’s competitiveness is popular. Still, its methodology underlying the calculation has been criticized. So the T&TCI Index has not been regarded as a reliable measure of a destination’s competitiveness. In this regard, this paper sought to set out a country-based tourism competitiveness evaluation model with various statistical methods to indicate how important tourism policy development has to design. We used data from an expert survey to examine the attributes and sub-attributes and shape the decision-making. We addressed a theoretical six-step procedure to ensure the evaluation model’s rigor in the model development context. The first was to do data collection. The second was to examine construct underrepresentation. The third was to examine common method bias. The fourth was to examine construct-irrelevant variances. The fifth was to evaluate intergroup consistency. And the sixth was to develop attribute weight. Our study showed that a country-based tourism competitiveness evaluation model encompassed 8 attributes and 28 sub-attributes. We identified cultural uniqueness, ecology and the environment as the two most important attributes. In the end, we addressed the practical contributions of this study and methods to policy-makers and researchers.
Keywords
Introduction
The development of an evaluation model involves a range of actors, and its success may involve many internal and external factors. Yet, despite the seemingly never-ending debates about effectiveness, the logic is that achieving development success resides in sound design (McConnell, 2010). More specifically, the evaluation model’s successful development should be programmatic and possesses effectiveness, efficiency, and resilience (Bovens et al., 2001). To achieve this, model makers need to provide an evaluation framework to identify problems, examine potential policy alternatives, and effectively make decisions. In this study, we attempt to develop country-based tourism competitiveness (TC) evaluation model for policymakers to set up proper strategies for tourism policy development or use it to diagnose their current strengths and weaknesses. In this study, evaluation is defined as a study designed and conducted to assist some audience in assessing an object’s merit and worth (Hansen, 2005). Tourism competitiveness is defined as the ability of the place or country to optimize its attractiveness for international visitors, to deliver quality, innovative, value, and attractive tourism services to gain market shares on the global market places while ensuring that the available resources supporting tourism are used efficiently and sustainably (Dupeyras & MacCallum, 2013). The tourism industry has been regarded as a powerful economic source and growth enabler (Buhalis, 2000; Kozak et al., 2009). Its enabling effects have proven to be significant drivers of economic growth, contributing over 10% to global GDP and accounting for 1 in 10 jobs on the planet (World Economic Forum, 2018). In terms of country-based TC, many studies have proven that a country with a well-developed TC can lead to long-term development, stimulate economic growth, reduce poverty, lessen unemployment, and maintain a higher standard of living (Croes & Vanegas, 2008; Martín et al., 2017; Zhao & Ritchie, 2007). TC is one of the key indicators and concerns that can increase revenue for a country (Bahar & Kozak, 2007; Gunduz & Hatemi-J, 2005; Salinas Fernández et al., 2020). However, the influences on competitiveness can change quickly, and this dynamic creates further challenges and a need for ongoing research and development of an evaluation model for monitoring (Abreu Novais et al., 2018; Kang et al., 2014). Thus, knowing how competitive a nation is or improving its competitiveness in a timely fashion is critical to tourism policymakers (Leitao, 2011; Odhiambo & Van Zyl, 2012). Therefore, it is of considerable value to provide viable and effective methods that help tourism planners identify which attributes are likely to influence competitiveness effectively. In other words, understanding the elements that affect TC and adopting a holistic action for evaluating competitiveness benefits policymakers (Kubickova & Li, 2017). The challenge is that assessing tourism’s actual competitive status will involve various attributes or variables; policymakers usually lack such knowledge to identify essential factors to their national TC (Abreu-Novais et al., 2016; Erkuş-öztürk & Eraydın, 2010). In such circumstances, policymakers may consult within-group advisers. However, advisers’ quality is not reliable; for example, their knowledge, expertise, personality traits, advisers’ diversity, and rater bias may affect consulting results (John Bernardin et al., 2016). Without appropriate selection, advisers may provide attributes or variables by their thumb rules, making evaluation deviations more serious (John Bernardin et al., 2016; Ritchie & Crouch, 2010). Therefore, we sought to provide policymakers with a robust competitiveness monitor (CM) to conduct effective TC evaluations. To specify what variables can be used for monitoring TC, some attributes have been included in the investigation of TC (Armenski et al., 2018; Cracolici & Nijkamp, 2009; Dwyer & Kim, 2003; Enright & Newton, 2005; Kozak et al., 2009). However, there is still no consistent consensus on which variables can be used to evaluate country-based TC. Specifically, the impacts of construct underrepresentation, common method biases, construct-relevant variables, and assignment of weight to each variable were never integrally addressed by prior studies. Without doing so, the accuracy of a CM is low; and raising whether it is trustworthy. Despite numerous TC models have been developed (Gursoy et al., 2009; Kayar & Kozak, 2010; Nazmfar et al., 2019; Rehman Khan et al., 2017), these studies either did not focus on a nation or neglected the examination of construct underrepresentation, common method bias, construct-irrelevant variance, intergroup consistency, and giving importance indicators for a national tourism evaluation (Eja et al., 2012; Lee & King, 2009; Navickas & Malakauskaite, 2009). For example, Ritchie and Crouch’s (2003) Calgary model is one of the most cited and used destination competitiveness models. But two limitations remain. First is the relative order of importance of major variables, and categories of variables have not been established. The second is to examine the relationship between the model of destination competitiveness and the impact of global or macro-environmental variables in qualitative terms. To verify the relationship much more rigorously, using quantitative methods is required. Thus, it doubted their effectiveness in evaluating TC and difficulties in planning a good tourism development strategy. We aim to fill this gap in a nation’s TC since no one had yet reached a unique set of attributes and sub-attributes with weights. To ensure construct validity is robust, the following six-step procedure is suggested. First, we collect necessary items by exhaustive literature review. Second, we examined face validity for construct underrepresentation. Third, we examined interexpert consensus for common method bias. Fourth, we examined content validity for construct-irrelevant variances. Fifth, we examined intergroup consistency by the Kruskal–Wallis test (K–S test) to ensure that the ratings from multiple experts are consistent or not biased by the outlier. And sixth, we weighted each attribute and sub-attribute by the fuzzy analytic hierarchy process (fuzzy AHP). In line with the above, the objectives of this study are twofold. First, to construct a synthetic indicator of TC and develop an accurate and evaluative CM to policymakers, they track their tourism development progress over time in the various areas measured in TC. Second, a multiple methods approach is proposed to solve the aggregation problems of variables expressed in different measures. This study fully addresses the purposes of face validity examinations, interexpert consensus, content validity, and intergroup consistency. Of course, the weight measurement of each attribute and sub-attribute by a multi-attribute decision-making approach is also discussed. This study’s statistical methods can enhance the evaluation’s effectiveness and the rigor of model development. More importantly, the results can be used to improve TC in any national destinations. Conclusively, two issues are critical. Firstly, TC’s importance is obvious, but the availability of attributes and sub-attributes with indices from exogenous judgments is still scant. Specifically, a country-based TC evaluation model for policy-makers is not available yet. Secondly, in terms of methodology, current TC models neglected to examine construct underrepresentation, common method bias, construct-irrelevant variance, intergroup consistency, and giving weight indicators for a country-based TC. Without doing so, their findings are dubious. Following this introduction, the rest of the paper is organized as follows; Section 1 covers an exhaustive literature review of the country-based tourism competitiveness, including current models, functions, determinants, and their role in policy-making, Section 2 describes the methodology and data, Section 3 comments on the results, Section 4 includes the discussion, policy implications, and limitations. Finally, Section 5 contains the conclusions and contributions.
Literature
Determinants of TC
The TC in the literature, while well established, is still fraught with inconsistencies over its definition, measurement, and its legitimacy as a topic of research. TC is a destination with tangible features that make for successful competition, or it is about the country’s ability to optimize its attractiveness for tourists (Croes et al., 2020). Competitiveness is related to the notion of ability about a national destination’s capability to achieve particular objectives. More specifically, it delivers the customer with excellent values and innovative and attractive tourism products and services in global markets while ensuring that the available resources supporting tourism are used efficiently and sustainably (Pulido-Fernández & Rodríguez-Díaz, 2016). Therefore, to make the right decisions in policy development, understanding what makes a country’s competitiveness in tourism and how to use them is a major consideration for policymakers (Kubickova, 2019). However, there are a few significant initiatives on monitoring competitiveness in country-based tourism, which policymakers can use to set up policy development. In terms of TC, it appears to be linked to the ability of a nation to deliver unique tourism attractions and provide psychological values such as cultural uniqueness, museums, ancient ruins, and tourism goods and services that are considered to be essential by tourists abroad (Crouch, 2011; Dwyer et al., 2016). Therefore, many potential variables are linked to the notion of TC. These include objectively measured variables such as price competitiveness, technological advancement, market openness, hygiene, and human resources, as well as subjectively measured variables, such as ecology- and environment-related attractions, social development, infrastructure, and e-tourism services (Chens et al., 2008; Dorcic et al., 2019; Gooroochurn & Sugiyarto, 2005; Mehraliyev et al., 2020; Navickas & Malakauskaite, 2009). Still, there are many other determinants and factors were also claimed in prior studies, including safety and security, amount and service quality in hospitality, country of entry, visa requirements, resident attitudes, cultural attractions, government regulations and policy, safety and security, and political stability (Kayar & Kozak, 2010; Mihalič, 2000; Petrović et al., 2017; Royo-Vela, 2009; Williams & Ponsford, 2009). Currently, World Economic Forum (2018) addressed four key success travel and tourism competitiveness indicators (TTCI) were, (1) enabling environment, (2) travel & tourism policy and enabling conditions, (3) infrastructure, and (4) natural and cultural resources with 14 key success sub-indicators as shown in Table 1. There are still many other factors that have also been addressed as critical determinants to TC’s nations. However, they are still challenging to aggregate into a model wildly because the scope and definition might differ across destinations or countries relative to their development levels (Balan et al., 2009; World Economic Forum, 2010). Numerous variables could be used to determine the TC of any given country (Mazanec & Ring, 2011; Trunfio et al., 2006) if we connect these attributes into a systematic CM model to evaluate a national tourism competitiveness status without the examination of relevance and representativeness of construct of interest, it is problematic because many of the variables identified may neither comply with country-based tourism competitiveness nor relevant to country-based TC (Abreu Novais et al., 2018). For example, using the TTCI published by the WEF has been subject to methodological criticism, such as the arbitrary weighting of variables and using very simple methodologies; usually arithmetic means to measure the competitiveness of tourism destinations, where different indicators are given equal weight (Croes & Kubickova, 2013; Pulido-Fernández & Rodríguez-Díaz, 2016). In this regard, simple means may not be appropriate since the raw indicators are not expected to have the same effect on competitiveness (Gómez-Vega & Picazo-Tadeo, 2019). Besides, a previous study has addressed that the T&TCI should not be regarded as a reliable measure of a destination’s competitiveness (Kunst & Ivandić, 2021). Using these attributes in a systematic CM model to evaluate national tourism competitiveness without examining the relevance and representativeness of the construct of interest is problematic. Regarding these limitations, numerous studies have proposed alternative approaches to aggregating the WEF data for evaluating TC. For example, Mazanec and Ring (2011) used the Partial Least Squares-Path Modeling method to develop a weighting scheme for the pillars based on their explanatory power for the TTCI-WEF. Lan et al. (2012) used Neural Network Analysis to construct an objective weighting system for the pillars. Croes and Kubickova (2013) developed weights for the pillars based on their correlation with the TTCI-WEF. Pérez-Moreno et al. (2016) used a multi-criteria approach to aggregation and proposed a solution to the issue of substitutability between pillars. Pulido-Fernández and Rodríguez-Díaz (2016) also employed multi-criteria models based on a double reference point. Unlike previous studies, which take pillars from TTCI-WEF as a starting point, we work from raw indicators, thus enabling a direct comparison between our competitiveness rankings and those provided by a panel of experts. Previous studies use pillars and sub-indexes obtained from T&TCI in constructing the different TC that are obtained endogenously; however, in this study, we develop the tourism competitiveness index through literature review and a panel of content experts profound judgment, so we get them exogenously, and our results are more objective. In addition, previous studies never examine the construct underrepresentation, common method bias, construct-irrelevant variance, and intergroup consistency during the index or model development to prevent the results of findings from the impact of outlier and other statistical noise. This study does. On the one hand, this study focuses on these issues. It proposes a new country-based CM model with weighted attributes and sub-attributes for policymakers to evaluate their country’s TC status and set up tourism development policy correctly. On the other hand, to ensure all pooled variables are relevant to and representative of the construct of interest, we invited a panel of experts and examined construct underrepresentation, common method bias, construct-irrelevant variables, and intergroup consistency neglected in prior studies. From the evidence delineated above, a reliable CM model can thus be effectively developed and achieved as an effective evaluation tool to monitor tourism development, value awareness, and international appeals accurately and appropriately.
Previous Studies of the Determinants of TC.

The Current CM Model
The World Travel and Tourism Council (WTTC) first created a CM with eight indicators. It then transferred to the World Economic Forum (WEF), which has reported the original country-based CM model as the TTCI for approximately 130 countries since 2007 to 2017. The WEF supports the CM model’s application to measuring the TC of a nation. In terms of CM, WEF pointed out that it could be updated at any time if required. Moreover, it indicated that the number of factors was unlimited, such that new elements could be added to the CM as needed (World Economic Forum, 2018). Besides, Gooroochurn and Sugiyarto (2005) claimed that the CM could evaluate TC by comparing different countries or regions. Thus, Navickas and Malakauskaite (2009) modified the CM model posited by Gooroochurn and Sugiyarto (2005) by adding more transport-related indicators, such as railroad network, number of airlines, and the quality of telecommunications systems. However, in terms of evaluation purposes, there are several shortcomings to the current CM models. First, the current CM models’ variables were not thoroughly tested and weighted in the construct of interest compilation. Theoretically, researchers should examine construct underrepresentation, common method bias, and construct-irrelevant variance before forming the model. Without doing so, the variables used for developing the evaluation model are inaccurate, and the findings would not be tenable. Second, if researchers do not prioritize each attribute and sub-attributes, people may assume that all variables are equally important. This assumption is unrealistic and would affect the accuracy of establishing a policy’s priority (Pulido-Fernández & Rodríguez-Díaz, 2016). More specifically, the current CM models are not viable yet for use in tourism policy development. Therefore, a systematic analysis of the weighting approach to prioritize the attributes and sub-attributes with a critical sequence would help policy-makers effectively develop an evaluation model. In light of this notion, this study developed a new tourism CM model that can help policy-makers continually evaluate the tourism development problems with the least effort and without risk of oversimplification. Consequently, a new CM model with weighted indicators could foster TC and contribute significantly to tourism development.
Tourism Competitiveness Evaluation Method
Numerous statistical methods are available for evaluating tourism competitiveness in the literature; unfortunately, no generally accepted methodology exists on which method best represents tourism competitiveness since each has strengths and weaknesses. In this study, assessing tourism competitiveness under a multi-criteria perspective is an analytical way to reach the best decision. Using improper methods may lead to misleading conclusions, and the obtained indicator and sub-indicators be not tenable. For example, one of the criticisms of the TTCI development process has to do with the arbitrary weighting of the variables within each pillar; it does not meet the strict evaluation and criterion sought. Based on a different standardization and aggregation of the pillars, researchers should consider whether these weightings are appropriate according to the philosophy of tourism competitiveness and the goals they intend to achieve. In light of this, several tourism competitiveness methods have been applied in prior studies. For example, Hong (2009) proposed a tourism competitiveness measuring model by employing the Analytic Hierarchy Process (AHP) with experts’ assessment to determine the competitiveness of a tourist destination. He used pillars from (1) Ricardo’s comparative advantages (RCA), (2) Porter’s competitive advantages (PCA), (3) tourism management, and (4) environmental conditions and presented new tourism competitiveness measuring model with 6 indicators in Level 2, 21 sub-indicators in Level 3, and 62 sub-sub indicators in Level 4. However, as the nature of the human being, linguistic values can change from person to person; each variable has its numerical value in the predefined scale. The AHP method cannot catch the intervals between two numbers; in such circumstances, taking the fuzziness into account will provide less risky decisions. In addition, Cibinskiene and Snieskiene (2015) used 18 experts as sources of ratings to develop a city tourism competitiveness model. This model analyzed 18 experts’ ratings and weighted the coefficients of internal and external environment components by the average statistical method. Due to the statistical average is greatly affected by outliers, so this method is relatively not reliable. Moreover, Medina-Muñoz et al. (2013) developed a model for measuring and explaining tourism destination competitiveness through a literature review. They identified research manuscripts on tourism competitiveness between 2000 and 2010, including the electronic databases from Sciver Scopus and ISI Web of Knowledge, particularly concerning China and Spain. The disadvantage of this method is two-fold. Firstly, it didn’t provide a systematic literature review and meta-analytic synthesis of quantitative studies; this makes the attributes and sub-attributes they collected are arguable. The model they developed also did not provide ranking order and weighting for each attribute and sub-attribute. It makes the model difficult to use, particularly by policy-makers. More specifically, their results are not consistent with the reality of tourism competitiveness evaluation. Furthermore, Guo et al. (2019) developed an urban tourism competitiveness evaluation system comparing regression and classification methods. They addressed that the Multinomial Logistic Regression Model (MLR) cannot reflect the independent variable factors that play a prominent role or reflect the defects and deficiencies in each tourism destination. Therefore, the use of MLR to evaluate tourism competitiveness may be regarded as inappropriate. Guo et al. (2019) thus suggested that classification methods such as factor analysis, cluster analysis, and principal component analysis are better than MLR to establish an integrated tourism competitiveness evaluation model. However, these methods lack some of the properties. For example, principal components analysis (PCA) does not offer dynamic analysis of the circumstances of a country or group of countries (Rodríguez-Díaz & Pulido-Fernández, 2021). Michael et al. (2019) used the hierarchical regression to evaluate the tourism competitiveness with a standardized beta coefficient (β) to measure 14 pillars of destination competitiveness developed by the World Economic Forum along with the Tourism and Travel Competitiveness Index (TTCI, 2017). This method requires a big sample size and the examination of content validity; without doing proper content validity examination, the results are not trustworthy. Finally, Pérez León et al. (2021) applied the Data Envelopment Analysis (DEA) to develop an index measuring tourism destination competitiveness in the Caribbean Region with 27 indicators. However, the disadvantage of the DEA method is its scores can be strongly biased by statistical noise and outlier (Kotsemir, 2013). Given the tourism competitiveness evaluation methods mentioned above, it is clear that each method has its advantages and disadvantages, respectively. Still, no consensus indicated which approach is the best. To enhance the accuracy and appropriateness of TC indicators more consistently with country-based tourism competitiveness indicators, much of the current literature focuses on the methodological improvement of these indicators. As Mendola and Volo (2017) address, there is still room for improvement in the methodology of competitiveness evaluation. For this reason, we elucidate our methods with merits in the next section.
Methodology
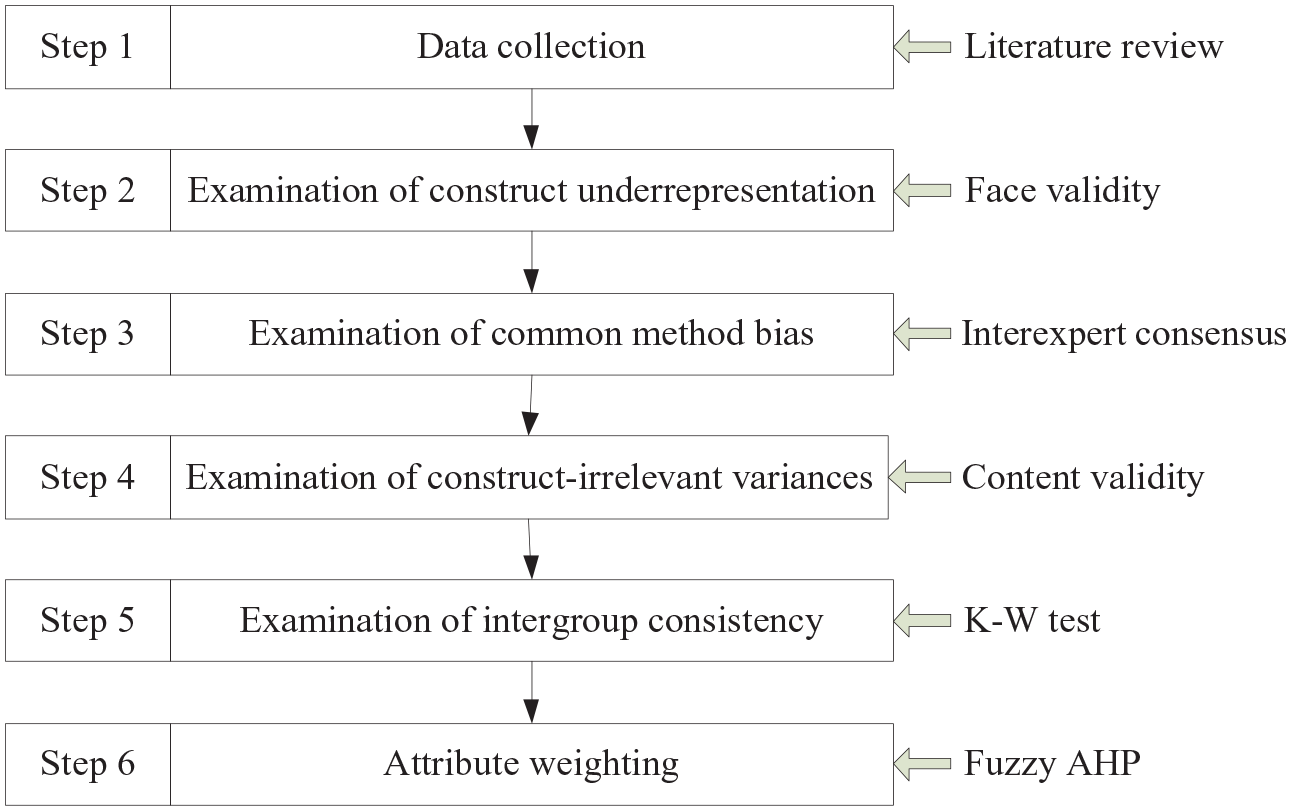
Although the TTCI has been praised for its criteria, the current literature still discusses methodological improvement continuously. For example, evaluating a TC, a comprehensive methodology is proposed, which ranges from linear regression (Sánchez & López, 2015) to gravity equations (Marti & Puertas, 2016), and the use of multi-criteria decision-making techniques as TOPSIS (Zhang et al., 2011). However, most studies have mainly used regression analysis to explain the pillars and sub-index (Das & Dirienzo, 2010; Ivanov & Webster, 2013; Lee, 2015). In this vein, to develop a CM model for evaluating country-based tourism competitiveness, we bring new methodological insights and follow the model development paradigm recommended by MacKenzie et al. (2011). We outline a six-step model development procedure as shown in Figure 1. The first step is the data collection which may come from a variety of sources, including literature review, deduction from the theoretical definition of the construct, previous theoretical and empirical research on the focal construct, suggestions from experts in the field, interviews, focus group discussions with representatives of the population to which the focal construct is expected to generalize, and an examination of other measures of the construct that already exist (Haynes et al., 1995). The second step is to examine construct underrepresentation; this step’s ultimate goal is to produce items that fully capture all of the focal construct domain’s essential aspects. Therefore, researchers should not omit the necessary measure or fail to include all the construct’s critical dimensions. The third step is to assess common method bias caused by the poor question design; when the items are written, their wording is as precise and straightforward as possible. For example, double-barreled items should be eliminated, items containing ambiguous or unfamiliar terms should be clarified or deleted, and items with a complicated syntax should be simplified, specific, and concise. If this cannot be done, items should be deleted. The fourth step is to examine the content validity for eliminating construct-irrelevant variance; once items have been generated for representing the focal construct, they should be evaluated for their content validity. Kerlinger (1973) defines content validity as the ‘representativeness’ of the content. Thus, this step minimizes the extent to which the items tap concepts outside the focal construct domain. More specifically, variances that are not relevant to the construct of interest or overrepresentation should be deleted. The fifth step is to assess the judgment consistency among three subgroups of experts for coherency; its purpose is to evaluate whether an item’s mean rating on one aspect of the construct’s domain differs from its ratings on other parts of the construct’s domain. Assuming the F-statistic is significant, a planned contrast is conducted to test whether the mean of the item’s rating on the construct domain’s hypothesized aspect is higher than the mean rating for this item on all other parts of the construct domain. The sixth step is to prioritize the importance of each attribute and sub-attribute by fuzzy AHP. By integrating different characteristics of pillars into a single score for ranking decisions and analyzing survey data by pair-wise comparison to determine the weighting of indicators, we use fuzzy AHP as it outperforms the ease of use, structuring problems systematically, and calculating both criteria weights and alternative priorities. Besides, it tolerates vague judgments by assigning membership degrees to exact numbers to describe to what extent these numbers. All methods used in this study are the expert-based approach.
Model development procedure.
Selection of Experts
Due to identifying determinants of TC was a complex and professional issue, this indicated that it required experts who understood the subject matter; evidently, the quality of findings was greatly affected by the content experts; this meant that experts’ background, expertise, diversity, and the sample of size were critical elements. Although there might be a relatively limited number of experts with knowledge about the research questions, it would be practical to solicit a panel of experts from up to 18 members in size (Paliwoda, 1983). As to the criteria of selecting people to serve as raters, we have to ensure that they have sufficient intellectual ability to rate the correspondence between items and the theoretical definitions. Besides, it is also essential for the raters to represent the main population of interest (MacKenzie et al., 2011). Moreover, we believe it is necessary to ensure the judgment was objective; the arrangement of a heterogeneous team of experts is better, resulting from the review objectively. In light of this notion, we select content experts with the following characteristics: background, expertise, knowledge, diversity, number of experts, and commitment to participation. We thus invited 15 subject matter experts and divided them into 3 subgroups of experts. The first subgroup was five individuals who were teaching tourism management from five different universities in Taiwan. The second subgroup was five individuals who were teaching public administration from five other universities in Taiwan. The third subgroup was five individuals from government officers who were in charge of policymaking on tourism development. In this study, five different questionnaires were applied to measure experts’ judgment on the items for other purposes (see Appendix A–E). We conducted communication by e-mail, so we could effectively collect feedback quickly. All invited experts could also respond to us immediately if they have any queries. The meaning of each term, such as construct underrepresentation, common method bias, construct-irrelevant variance, and purpose of this study, was thoroughly explained and provided. The conducting period was from March 1 to April 15, 2020.
Generate Items to Represent the Construct
Step 1: Data collection
Generating the relevant attributes and sub-attributes of TC requires the appropriate collection of empirical and theoretical evidence. In this study, we sought the secondary literature on the state of the question of TC relevant terms such as price attractiveness, natural preservation, cultural uniqueness, lodging, foods, shopping quality, information communication technology, infrastructure, health, hygiene, safety, security, openness, accessibilities, historical significance, recreational activities, and social environment. In particular, destination marketing, destination choice, tourism competitiveness, destination preference, destination selection, e-tourism services, and TTCI variable stated in the Travel & Tourism Competitiveness Report 2017 (WEF-2018) delved attentively. Based on the outcome of the first step of data collection, we generate a series of variables relevant to country-based TC, including eight attributes; (1) price competitiveness, (2) infrastructure development, (3) ecology and environment, (4) market openness, (5) cultural uniqueness, (6) human resource, (7) digital capability, and (8) social development and 31 sub-attributes. Based on the above explication, the initial CM model provided a full range of determinants of TC. After initial item generation, we need to know whether it fully captures all of the essential aspects of the domain of the construct of interest while minimizing the extent to which the items tap concepts outside of the domain of the construct of interest.
Step 2: Examine face validity for identifying construct underrepresentation
Based on the outcome of the first step of data collection through the literature review, the initial framework of the CM included 8 attributes and 31 sub-attributes. However, there may be other valuable attributes or sub-attributes that we are not aware of or chose to exclude. Thus, it requires researchers to examine construct underrepresentation. Construct underrepresentation is defined as the occurrence of essential aspects or facets of what is being measured and omitted (Messick, 1995). It is one of the threats to construct validity that if ignored by researchers. We used an ex-ante approach instead of a post hoc approach to assess the construct underrepresentation. The latter examined construct underrepresentation after real data was collected; it might occasionally omit some crucial variables. In this study, we examined face validity for identifying construct underrepresentation. Face validity is defined as assessing whether a measurement scale or questionnaire includes all the necessary items in the rating scale (Dempsey & Dempsey, 1992). In other words, researchers can use it to distinguish whether they adequately capture the full dimensions of the construct of interest (Mason et al., 2020). If the researcher cannot capture all the construct of interest dimensions, the evaluation instrument would be deficient. In light of this, we attempted to evaluate the construct underrepresentation through the examination of face validity. More specifically, the assessment of face validity was to realize whether the authors omitted any necessary variables (Grand et al., 2010). Its purpose is to reduce the impact of the under-dimensionality problem. The execution of face validity was to ask all experts to scrutinize the content items that the authors collected from the literature review. Experts could then add any attribute or sub-attribute they thought was omitted. We would add the new attributes or sub-attributes with all we collected from the literature review and then examined the relevance in the following section.
Step 3: Examine the interexpert consensus for preventing common method bias
MacKenzie et al. (2011) contended that content items in the questionnaire, test, or measurement with ambiguous, double-barreled, unfamiliar terms, abstract, negative, or complicated syntax should be identified and corrected. These are produced by poor question design, and they are recognized as the stimuli of common method bias (Malhotra et al., 2017). These stimuli should be screened out beforehand. Otherwise, question respondents may respond to negative mood states, fatigue, boredom, and indifference; these will induce, thereby distorting the findings (Podsakoff et al., 2003). In this study, we ruled the stimuli of common method bias out with the examination of interexpert consensus. More specifically, we informed the experts about the meaning and potential sources of common method bias. We then asked them to screen out the item content if they were contaminated by common method bias. Therefore, the determination of items is whether contaminated by common method bias or not will depend on the degree of consensus. In prior studies, descriptive statistics have been applied to determine interexpert consensus and the quantification of its degree (Hsu & Sandford, 2007). Interexpert consensus can be decided by measures of central tendency (mean, median, and mode) and level of dispersion (standard deviation, coefficient of variation, and interquartile range) (Hasson et al., 2000). Given this, prior research used the coefficient of variation (C.V.) to measure the degree of interexpert consensus. In the case of the 5-point Likert scale, a coefficient of variation of ≤0.3 is regarded as the cut-off point as it indicates a good degree of interexpert consensus (Rushton & Moore, 2010). The standard deviation (S.D.) is another criterion used to assess a population’s variation based on the expert panels’ feedback. Based on this, S.D. ≤ 1 is used as a cut-off point based on the 5-point Likert scale as it represents the high level of interexpert consensus (Christie & Barela, 2005). Another judgment of interexpert consensus is determined if the items are rated with a median value of ≥4.0 (Foster et al., 2009). Specifically, items can be judged with no contamination if the values of median, S.D., and C.V. reached the level of cut-off points.
Step 4: Assess the content validity for deleting construct-irrelevant variances
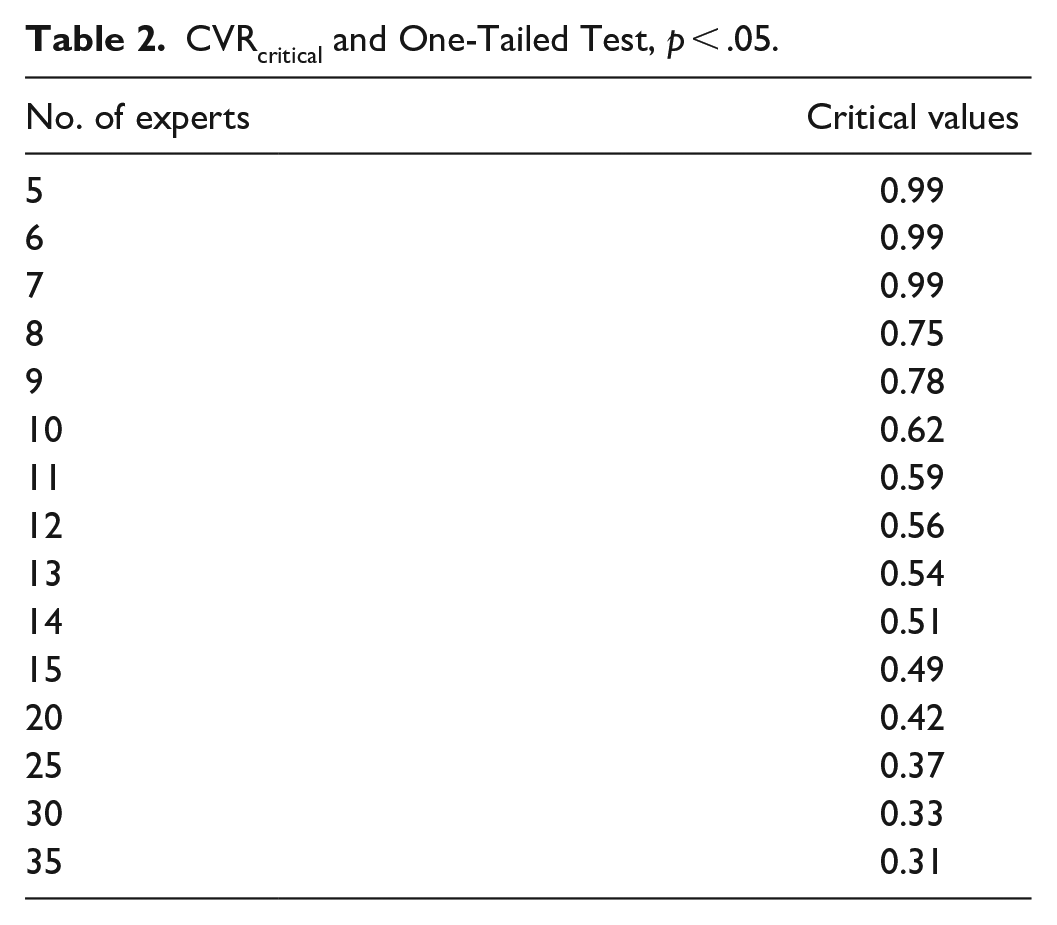
Once items representing the construct of interest are generated, researchers should evaluate the items they collected are whether construct-irrelevant variances or not. Construct-irrelevant variance is error variance that arises from systematic error (Haladyna & Downing, 2005). This systematic error leads to undesirable changes in actual scores unrelated to the pertinent ability or performance being measured. This study examined item-level content validity for ruling out construct-irrelevant variances to ensure all generated variables were relevant to the construct of interest. Content validity is defined as the degree to which an instrument’s elements are appropriate and represent the targeted construct for a particular assessment purpose (Haynes et al., 1995). The examination of content validity was to consider whether a model has excluded the irrelevant ones in terms of the construct of interest (Hinkin & Tracey, 1999; Shrotryia & Dhanda, 2019). To determine whether the content items were relevant or irrelevant to the questionnaire’s construct of interest, the authors used the Content Validity Ratio (CVR) developed by Lawshe (1975). It was an item-level content validity index for determining which item should be retained or rejected; experts were requested to rate the questions with “construct relevant,” “useful, but not construct relevant,” or “not construct relevant.” According to Lawshe (1975), if any item was perceived by more than 50% of the experts to be “construct relevant.” It revealed that it had at least some content validity. Using these assumptions, Lawshe (1975) developed a formula termed the content validity ratio: CVR = (Ne–N/2)/(N/2), where Ne was the number of experts indicating “construct relevant” and N was the total number of experts—determining which item to be retained or rejected depending on the interexpert agreement’s strength. To achieve the interexpert agreement, we would retain items if the CVR values met or exceeded the critical value. Table 2 presents the CVRcritical necessary for a one-tailed test (p < .05) and various sample sizes. According to Table 2, the authors invited 15 experts to this study, so the critical value was 0.49. The item is retained as construct-relevant when its CVRcritical value is ≥0.49.
CVRcritical and One-Tailed Test, p < .05.
Step 5: Examine intergroup consistency
When using the expert-based techniques described above, each expert makes multiple ratings for each item. Thus, it would require testing the item rating differences across aspects of the construct domain (MacKenzie et al., 2011). In this regard, examining intergroup consistency is required. The purpose of evaluating intergroup consistency is to realize whether the items rated by three sub-groups of experts are with the difference or not. More specifically, it is to know if any disagreement or outlier exists. If the judgment from three sub-groups of experts was not consistent, the items should be rejected. Specifically, intergroup consistency examination was to ensure the ratings by different subgroup experts do not violate monotonicity or reversals of preferences (Bureš et al., 2019). More specifically, the examination of intergroup consistency ensured no judgment difference, for example, the judgment difference raised by rater bias or outlier among three subgroups of experts. It could mitigate the impact of outlier or rater bias as an outlier could make rating inconsistency among experts’ subgroups and present a severe threat to construct validity (John Bernardin et al., 2016; Ratcliff, 1993). In the literature, a one-way analysis of variance (one-way ANOVA) was usually recommended. However, one-way ANOVA results are reliable as long as response variable residuals are in normal distribution and big sample size. In this study, the sample size is small, and experts’ assessments are not normal distribution but skewed; thus, using the one-way ANOVA is inappropriate. On the contrary, in terms of small sample size and free distribution, the Kruskal–Wallis one-way analysis of variance (K–W test) was recommended to evaluate intergroup consistency (Hassani & Silva, 2015). Hence, we recommend using the K–W test to assess the significance of consistency or determine the differences among experts’ three subgroups (Neuhäuser et al., 2017). Researchers can reject the null hypothesis of no difference between the datasets if the p-value is set at the 5% level. More specifically, K–W test results denote consistency in experts’ responses among three subgroups with a p > .05 (Rice, 2009).
Step 6: Formally develop the evaluation model
To construct a nation’s TC synthetic index and integrate all construct-relevant attributes into an evaluation model, we needed a robust approach; specifically, it could give each attribute and sub-attribute a weight to indicate importance; this was a typical multi-attribute decision-making issue (Lopes et al., 2018; Nazmfar et al., 2019). To gain an answer and solve such a problem, we chose the fuzzy AHP because it allowed us to model a complex issue in a hierarchical structure that showed the relationships of the goal, criteria, and sub-criteria through multi-expert judgment (Park & Yoon, 2011; Peng & Tzeng, 2012). Numerous studies have used this method for constructing indicators that summarized or synthesized a set of variables or partial indicators related to the object to be measured (Bakogiannis et al., 2020; Lee & King, 2019). The benefits of using the fuzzy AHP method were that it could tolerate vagueness or ambiguity and enabled us to derive ratio-scale priorities instead of arbitrarily assigning them (Mikhailov & Tsvetinov, 2004). In other words, this method could capture a human’s appraisal of ambiguity while considering complex multi-attribute evaluation problems (Erensal et al., 2006). Given this, the fuzzy AHP not only supported researchers or policy-makers by enabling them to structure complexity and exercise judgment but also allowed them to incorporate both objective and subjective considerations in the decision process (Kuo & Liang, 2012). In other words, the application of fuzzy AHP could determine the relative weights of these hierarchy elements, compare alternatives to these criteria, and rank them in order of importance (Kardaras et al., 2013). Despite numerous studies investigating tourism phenomena utilizing the fuzzy AHP approach (Crouch, 2011; Wang & (Simon) Tsai, 2012), no country-based CM model developed was available in prior studies. More specifically, a country-based CM evaluation model associated with a set of weighted indicators has not been created yet. This study used the Power Choice 2.5 software to determine each attribute and sub-attributes weightings. As to the presentation of equations and computations of Fuzzy AHP due to tedious and intricate, interesting readers could refer it to the article issued by Chang (1996).
Results
Results of Face Validity
To identify any necessary variables omitted or excluded by the authors, we asked all 15 experts to scrutinize the list of 8 attributes and 31 sub-attributes for construct underrepresentation. We explained the meaning of construct underrepresentation and the purpose of examining face validity. No new attributes and sub-attributes were added or suggested from the feedback we collected from all 15 experts. It revealed no omitted variables and that the initial pooled 8 attributes and 31 sub-attributes were representatives of the construct of interest.
Results of Interexpert Consensus
As stated that any newly designed questionnaires are subject to common method bias such as emotive words or phrases, abstract, acronym, jargon, negative connotations, and ambiguity; those wordings may cause biased responding. To prevent them from the wording in the questionnaire, we asked all panel experts to review the questionnaire we provided and examined whether common method bias was underlying the questionnaire. In this study, the authors judged the cut-off values with the median, S.D., and C.V. as the consensus for controlling common method bias. We showed the results in Table 3. All questionnaires used for measuring 8 attributes and 31 sub-attributes are defendable with common method bias. The biasing effects of method variance do not exist; this indicates the threat of common method bias is minor in this study.
Results of Interexpert Consensus, Content Validity, and Intergroup Consistency.

Note. Median > 4.0, SD ≤ 1, CV ≤ 0.3, CVR > 0.49, p > .05.
Results of Item-Level Content Validity
To examine whether construct-irrelevant variances existed, we examined item-level content validity for deleting variances or attributes if the experts recognized them as irrelevant to the construct of interest. We rejected sub-attributes if the critical values of CVR were less than 0.49. Three sub-attributes; the population, purchasing power parity, and sports activities, their CVR values were less than 0.49, so we rejected them. Consequently, the panel experts reached an agreement on item retention, including 8 attributes and 28 sub-attributes. After the completion, key tourism-based competitiveness elements were identified and then served as a starting point for modeling the framework of CM. The results presented in Table 3 illustrated the relative determinacy measures for each of the 8 attributes, with 28 sub-attributes remaining to examine the intergroup consistency and rate the importance of each in the following sections.
Results of Intergroup Consistency
As ratings by different experts may differ for some reasons, including disagreement or individual bias due to dishonest behavior, human error, or simply natural deviations in populations, this is an execution error in data collection and would be lumped into the error term. Therefore, we use the Kruskal–Wallis test (K–W test) to assess intergroup consistency (Solomou & Constantinidou, 2020). The judgment criterion of intergroup consistency is that consistency would not reach if differences existed among three subgroups of experts. In this study, if the K–W test yielded significant results (p > .05), it indicated that three subgroups of experts reached significant consistency and no difference for each sub-attribute. We showed the results in Table 3. Moreover, to realize the positive correlation between each of the eight dimensions and TC, we conducted Spearman-rank correlation tests to realize the association. The results indicated that group A showed a significantly positive correlation with TC (rs = .95; p < .001); group B showed a positive correlation with TC (rs = .74: p < .01); group C showed a significantly positive correlation with TC (rs = .83; p < .001); group D showed a significantly positive correlation with TC (rs = .87; p < .001); group E showed a positive correlation with TC (rs = .72; p < .01); group F showed a significantly positive correlation with TC (rs = .93; p < .001); group G showed a significantly positive correlation with TC (rs = .64; p < .01); group H showed a positive correlation with TC (rs = .78; p < .001). All groups are significant; it provides statistical support for the association with TC.
Result of Fuzzy AHP
This article attempts to develop a country-based tourism CM from a purely definitional system into an explanatory model for policy-makers to build up excellent tourism development strategies. We conducted a pairwise comparison to determine the importance and give each attribute and sub-attribute a score as a measurement index. After the pairwise comparison of eight attributes, we gave an estimated weight number to each attribute, as shown in Table 4. The weight of price competitiveness was 0.122; infrastructure development was 0.098; ecology and environment were 0.163; market openness was 0.082; cultural uniqueness was 0.171; the human resource was 0.103; the digital capability was 0.114, and social development was 0.147. Each attribute’s weight indicates the degree of impact on a nation’s TC. Moreover, each attribute encompasses a set of sub-attribute; a total of 28 sub-attributes also had substantial effects that could significantly affect TC in certain conditions. Similarly, the importance of each sub-attribute in the group must be known and determined. Hotel and restaurant prices were 0.389; destination accessibility was 0.405; preserved natural scenery was 0.317; government support was 0.425; ancient ruins were 0.316; trained workers were 0.342; e-marketing was 0.478; safety and security were 0.451; these eight sub-attributes were the most critical sub-attributes within each perspective. The result presented in Figure 2 is a three-level model. It illustrated the relative determinacy measures for each of the 8 attributes and 28 sub-attributes based on a nation’s quantitative analysis of tourism competitiveness. This CM possesses functional indications and delivers a picture of how healthy a tourism destination could be. It is a good evaluation model for overseeing a country’s TC position.
Weight Analyses at Level 2.


Country-based tourism competitiveness evaluation indicators.
Discussion and Implications
From the evidence revealed by this study, researchers cannot use attributes and sub-attributes by translating the general competitiveness indicators found in the literature to develop a TC; this is not appropriate (Lopes et al., 2018). In this regard, this paper develops a country-based TC evaluation model, a national-level model with 8 attributes and 28 sub-attributes by a panel of content experts with sophisticated consideration and statistical methods. The results indicate that cultural uniqueness and ecology and environment are the two most essential attributes, followed by social development, price competitiveness, digital capability, human resource, infrastructure development, and market openness. Surprisingly, we found market openness as the least important attribute. This finding still complied with Jin (2011), who contended that a long-term benefit of market openness on tourism growth could not confirm. This study revealed that hotel and restaurant prices, destination accessibility, preserved natural scenery, government support, ancient ruins, trained workers, safety and security, and e-marketing, these eight sub-attributes are the most critical sub-attributes within each perspective. Data revealed that 8 attributes and 28 sub-attributes are a country’s strengths directly related to tourism revenue. Besides, the attributes and sub-attributes identified by the authors are consistent with the TTCI (World Economic Forum, 2018). Moreover, the eight attributes revealed by this study are also compatible with Nazmfar et al. (2019), who analyzed travel and tourism competitiveness in Middle East countries. The results of the study imply that attributes and sub-attributes presented by this study are reliable and consistent. In terms of national tourism development, attribute and sub-attribute with high weight scores indicate more critical roles in understanding TC’s degree of influence. Policy-makers can tell the importance of each attribute and sub-attribute quickly. On the one hand, we addressed that examining face validity for construct underrepresentation, examining interexpert consensus for common method bias, and examining item-level content validity for construct-irrelevant variances were essential for developing the model. It proves that all attributes and sub-attributes used in this study are strictly accurate and trustworthy. On the other hand, the rating difference among subgroups of experts has been examined, proving that intergroup consistency is established.
This study’s practical implications to policy-makers are as follows; (1) Once a country develops a robust TC, the more focus on these factors, the more tourists travel there. The more they are willing to visit these countries. For example, associated with cultural uniqueness, ecology and the environment into the tourism competitiveness progress has become an emerging topic in the latest demand studies. This result highlights the importance of such features in attracting international tourists. It echoes Gómez-Vega and Picazo-Tadeo (2019) that policy-makers should use them to boost the competitiveness of international tourist destinations. (2) The contribution of this study to policy development is concrete. Policy-makers should not ignore the value of this country-based CM model in tourism. It is a multifunctional instrument designed for policymakers to effectively assess various managerial problems and make a country’s tourism industry more competitive than otherwise. The findings could provide policymakers and tourist firm managers with helpful information and identify strengths and weaknesses. It rests on policy-makers or tourism managers to pinpoint the factors restricting their ability to attract international tourists. For example, in terms of infrastructure development, the region in Europe has long developed world-class airports, seaports, and superb tourism service infrastructure, which surpass that of other regions. Hence, a positive image regarding infrastructure has been created, and tourist arrivals are no longer sensitive to further infrastructure improvement. Thus, infrastructure is no longer the key driver of tourist flows in Europe. Policy-makers need no to rest their efforts on this domain. But for other regions, especially Asia and Africa, still need to focus on infrastructure as it is the primary determinant of tourism performance in terms of arrivals and tourism GDP. (3) The CM developed can drive emerging policy issues from a competitiveness perspective and give governments and policy-makers a more comprehensive overview of the tourism sector’s performance, thus enabling them to develop better policies and programs appropriately. For example, in times of COVID-19, tourists have changed their attitude to the tourism destinations they intend to visit. In this context, providing tourists with safe and free contamination environments becomes a prerequisite for attracting international tourists. More specifically, efforts should be made to create a safe travel environment for tourists by promoting health and safety border security measures, particularly at airports. It should be built into their tourism development policy. This study’s implications to researchers; First, this study addresses numerous measurement threats to the results of findings, for example, construct underrepresentation, common method bias, and construct-irrelevant variance. These are latent variables and undermine the construct validity. Therefore, researchers should treat the statistical methods present in this study as imperative for model development. Second, to enhance the rigor of model development, researchers should examine face validity, interexpert consensus, and content validity for accuracy and appropriateness; without doing so, the pooled items and the result of findings could be untenable. Third, to ensure the collected data without extraneous interference or difference among subgroups of experts, the assessment of intergroup consistency with K-W test instead of one-way ANOVA and association between two variables with Spearman-rank correlation tests are proposed, especially in small sample size studies distribution-free. Fourth, we recommend using fuzzy AHP for decision-making or selection to establish a model with appropriate indicators. The authors’ CM is a general model; it is not a situation-specific model. More specifically, this study offers a novel approach to operationalizing and estimating a theoretically grounded and empirically validated tourism competitiveness model with significant implications for tourism policy development. There are two limitations to this study. First, we examine all sub-attributes by CVR for deleting construct-irrelevant variances, which might receive criticism regarding its statistical rigor. Future studies can use other methods such as ADM(j) or rWG(j) to eliminate the construct-irrelevant variances. Second, to maximize tourism competitiveness in a country, using other multi-attribute decision-making methods is recommended. For example, researchers could use the Preference Ranking Organization Method for Enrichment of Evaluations (PROMETHEE), providing more objective results.
Conclusions
Our study is three different from previous studies. Firstly, previous studies use the attributes and attributes gained from current or previous studies, for example, TTCI–WEF. It means they get attributes and sub-attributes endogenously. However, there are still many deficiencies in the WEF index because of the criticism of variables’ arbitrary weighting. It entails great difficulty, as attributes or sub-attributes have very diverse characteristics and will be difficult to agree to the experts, so this is considered a limitation. Therefore, without adjustment, using attributes and sub-attributes by translating the general competitiveness indicators found in the literature to develop a TC is not appropriate (Lopes et al., 2018). Ours is different; we retrieve all potential attributes and sub-attributes from the literature review first; we then examine the construct underrepresentation, construct overrepresentation, common method bias through a panel of content experts to ensure accuracy and appropriation. Specifically, we get attributes and sub-attributes exogenously. Secondly, the original TTCI is unreliable as most variables are weakly correlated (Dias, 2017). Our findings indicate that eight attributes are all strongly correlated. Thirdly, with the current methodology, the results obtained without examining construct underrepresentation, construct-irrelevant variance, and common method bias may lead to misleading conclusions. Applying the methods proposed in this study avoids this problem, given that attribute or sub-attribute will remain in the ranking as long the impact of construct underrepresentation, construct-irrelevant variance, common method bias improve. Moreover, we also examine intergroup consistency as a statistical test, so the values of these attributes and sub-attributes we retrieved are in a way that is more consistent with the objective of country-based competitiveness. Drawing from the result of findings, this study’s country-based CM model has contributed to policy development. First, any given nation’s tourism competitiveness is subject to various attributes and sub-attributes; this study highlights the main parts. Second, policy-makers should use the country-based CM to effectively deliver a nation’s tourism image and attract international tourists’ attention to grow tourism. Third, policy-makers can use the 8 indicators and 28 sub-indicators proposed in this study as key success indicators for evaluating the long-term effect of tourism development and cost-effectiveness across a portfolio of policies and programs. Fourth, countries could make enormous strides toward tourism competitiveness if this country-based CM model was well-implemented. Besides, to ensure the quality of model development is rigor and accurate, the researcher can follow the guidance of the above six-step procedure as the protocol addressed by the authors in this study.
Footnotes
Appendix A
Appendix B
Appendix C
Appendix D
Appendix E
Declaration of Conflicting Interests
The author(s) declared no potential conflicts of interest with respect to the research, authorship, and/or publication of this article.
Funding
The author(s) received no financial support for the research, authorship, and/or publication of this article.