
Abstract
This study examines the asymmetric effects of oil prices, money supply, and the Tadawul All Share Index (TASI) on sectoral stock prices in Saudi Arabia. By applying a nonlinear auto-regressive distributive lag (NARDL) approach to monthly data spanning from January 2007 to December 2016, we found that the positive shocks of oil prices were more than the negative ones in the building and construction, energy and utilities, and petrochemical sectors, while higher oil prices adversely influenced the stock price of the bank and financial service sector. We identified the long-run and short-run asymmetric relationships of the Saudi stock market development on the stock prices of bank and financial services, energy and utilities, and the petrochemical sector and only a long-running asymmetric relationship with the building and construction sector. We also found the absence of long-run and short-run asymmetric impact of money supply on three sectors, namely, building and construction, energy and utilities, and the petrochemical sector except for the bank and financial service sector where only a long-running asymmetric relation was observed. These findings are appropriate for investors and portfolio managers to make judicious investment decisions. Policymakers should diversify their economic sectors apart from the oil dependencies to achieve the Vision 2030.
Introduction
Seminal investigation into oil prices and macroeconomic indicators by Hamilton (1983) stimulated studies to examine as to how oil prices drive economic indicators (Anton Mork et al., 1994; Baumeister & Peersman, 2013; Charfeddine et al., 2020; Hutchison, 1993; Lippi & Nobili, 2012). Oil prices have a principal effect on stock market prices, as the latter is the bellwether of the economy (Jones & Kaul, 1996).
The influencing mechanisms of oil prices on the stock market are numerous: First, rising oil prices escalate production expenses, decrease profitability, and dampen stock prices. Second, a hike in oil prices increases the overall inflation, which, in turn, negatively affects stock prices. Third, we observe how the traits of economies—whether net importers or exporters of oil—and the oil price shock—whether demand- or supply-centric—become central to the effect of oil prices on the equities markets (Jammazi, 2012; Sadorsky, 1999). The resulting variations in oil prices have, in turn, been attracting global investors to emerging stock markets. The oil prices–stock markets nexus gains greater significance when the stock markets are categorized as “emerging markets.” Oil produces a wealth channel in oil-producing emerging nations, with oil market volatility having a significant impact on currency values and macroeconomic stability (Ding & Vo, 2012; Fedoseeva, 2018).
For the last 6 years, Tadawul, the Saudi Stock Exchange, has been providing above-average dividend yields. The purported yield has surpassed the yield of emerging markets by approximately 140 basis points. The inclusion of Tadawul-listed shares on both the Morgan Stanley Capital International (MSCI) and Financial Times Stock Exchange (FTSE) emerging market indexes has attracted billions of dollars from global investment funds. The MSCI Saudi Arabia Index has a weight of approximately 2.6% on the emerging markets index, with 32 securities. Saudi Arabia has both political stability and the largest economy among Arab countries; it also ranks second in global oil reserves. The capability of Saudi Arabia to upturn its international oil distribution with minimal effort points to its competence, with abundant reserves and cheap upstream costs contributing to this advantage. Saudi Arabia now intends to fulfill nearly 50% of global oil demand (Dagoumas et al., 2018). The Saudi stock market is second to none in the region and worth approximately $549 billion. The inclusion of the Saudi stock market in the global benchmark reflects the strength of the country’s economic environment. As part of the Vision 2030, Tadawul and the Capital Market Authority (CMA) have collaborated to implement sizeable reforms, enabling the Saudi market to create alliances with emerging and developed markets (Cma.org.sa, 2021).
Our motivation for the investigation of the asymmetric linkages of oil prices and money supply with the sectoral price indices in Saudi Arabia stems from the country’s inclusion in the emerging markets index. As emerging markets are more exposed to the dynamics of the oil market, it is central to examine the link between oil and stock markets for investors and policymakers in oil-dependent economies like Saudi Arabia. The study has also covered the money supply as it has an impact on the stock market. We have been inspired by the Shin et al.’s (2014) approach, which considers asymmetry in the stock price equation rather than in the variance equation. Our selection of the nonlinear auto-regressive distributive lag (NARDL) model is motivated by this tool accounting for both asymmetric and heterogeneity effects in the oil–stock nexus. Prior studies employing Shin et al.’s NARDL approach have also confirmed asymmetry effects in a few economies (Al-Hajj et al., 2018; Salisu & Isah, 2017) and that they pertain to oil as well as nonoil sectors in the Saudi economy (Abdel-Latif et al., 2018; Hemrit & Benlagha, 2020).
Our study contributes to the growing but limited literature on emerging economies by investigating the link between oil price and sectoral stock markets in Saudi Arabia. To the best of our knowledge, our study is the first to simultaneously capture nonlinearities and heterogeneity effects on oil price, money supply, and stock market linkages covering Saudi sectoral indexes.
We extend the extant literature in the following ways. First, this study is a pioneering effort to investigate the influence of oil price and money supply on the sectoral stock prices of the Saudi stock market at both the aggregate and sectoral levels. Second, we employ nonlinear ARDL (NARDL) for a pragmatic study of 15 sectors’ stocks indexes to examine the portfolio implications. Third, unlike prior studies on Saudi Arabia, we investigate the long- and short-run interactions among the purported variables in the Saudi stock market from a nonlinear perspective.
We believe that examining the asymmetric association will assist the portfolio managers, risk managers, institutional investors, other market players and policymakers to appreciate the relationship between oil price changes and the Saudi sectoral stock indexes. Understanding this relationship will help market participants engage in better decision-making during spikes in oil prices. We detect evidence of a significant and positive relationship between Brent oil prices (LOP) and stock prices of the banks and financial services, building and construction, energy and utilities, and petrochemical sectors. The most influential sectors of Tadawul are banks and financial services, building and construction, energy and utilities, and the petroleum sectors.
The remainder of this paper is organized as follows: Section 2 discusses thoroughly the theoretical and empirical evidence on the current theme. Section 3 presents the data and methodology. The results and discussion are covered in Section 4. Section 5 encompasses the conclusion and policy implications.
Literature Review
The theoretical connection between oil prices (OPs) and stock prices (SPs) reveals five different modes of interdependence. The stock valuation channel is an explicit channel whereby varying OP influence stock market prices. A shift in OPs can modify a firm’s future cash flows either positively or negatively—this outcome depends on whether the “establishment” is an oil user (oil consumer) or oil producer (Mohanty & Nandha, 2011; Oberndorfer, 2009). The fluctuations in OPs influence stock returns through their effect on discount rates—this relationship exists by way of the monetary channel. An increase in the OP is likely to upturn the expected inflation in both oil-producing and oil-demanding economies; central banks then respond to the higher expected inflation by escalating the interest rates (Mohanty et al., 2013). There also exists the output channel—that is, OP fluctuations affect the aggregate output (Hamilton, 2009; Kilian, 2008). The fiscal channel is predominantly relevant to oil-supplying economies, which support their vast infrastructure by exploiting their oil revenues (Farzanegan, 2011). Lastly, as uncertainty escalates, market players begin to reorient investment and consumption decisions; consequently, economic growth projections move, and stock market returns take a hit (Brown & Yücel, 2002; Pindyck, 2003). To summarize from the above discussions, the aforementioned channels underscore and shape the influence of OP changes on stock market prices.
The literature on OPs and stock market prices largely emphasizes the relationship between crude OPs and stock market returns. This stream of research falls into three broad scopes that show mixed results. First, one group of studies has revealed a substantially adverse effect of crude OPs on stock market returns (Basher et al., 2012; Ciner, 2001; Jones & Kaul, 1996; Papapetrou, 2001). Second, another group revealed a positive link between the variables (Narayan & Narayan, 2010; Silvapulle et al., 2017). Third, studies exist that reveal mixed results or no relationship between the purported variables (Hatemi et al., 2017; Huang et al., 1996; Sarwar et al., 2019; Zhu et al., 2011). Scholars have unambiguously studied the OP–stock return linkage among oil-importing and oil-exporting economies (Park & Ratti, 2008; Ramos & Veiga, 2013; Salisu & Isah, 2017; Wang et al., 2013). OP results are distinctive in oil-exporting countries from in oil-importing ones. In the latter, there is evidence of a favorable link between OPs and stock market prices. Reportedly, a hike in OPs positively affects the Gulf Cooperation Council (GCC) stock markets (Demirer et al., 2015; Mohanty et al., 2011). To summarize, the above-mentioned studies report that an escalation in OPs positively affects stock returns in oil-exporting economies but negatively in oil-importing ones (Arouri & Rault, 2012; Bjørnland, 2009; Gil-Alana & Yaya, 2014).
A set of studies has highlighted as how OPs lead to asymmetric effects on stock market returns (Jiménez-Rodríguez, 2015; Park & Ratti, 2008; Salisu & Isah, 2017). In the literature, it has been revealed that there are three modes of asymmetric specifications: positive and negative OP returns, scaled OP increases and decreases, and net OP increases. Price rises do seem to have stronger effects on oil returns than price declines (Kang et al., 2016; Sadorsky, 1999).
In the extant literature, we find a concerted effort by scholars to emphasize the effect of OP on the overall stock market prices, despite such approaches neglecting sectoral heterogeneity. It is unlikely that all sector returns would have an undesirable link with OP changes. In this regard, Narayan and Sharma (2011) and Hammoudeh and Li (2005) found that critically oil-dependent sectors, such as airlines and transportation, respond negatively to inflation in OPs. Contrariwise, sectors that generate revenue from oil and gas have a positive relationship with inflation (Arouri, 2011). Further, increasing OPs have a positive influence on the alternative energy sector as well (Kumar et al., 2012). Thus, varying OPs have a unique influence across the variegated sectors—from oil-intensive to nonoil-intensive sectors (Moya-Martínez et al., 2014).
A set of studies covers the GCC economies. These studies have found no direct or significant effect from the association among the purported variables. Such mixed results only strengthen the claim that asymmetric effects are exhibited on account of the unique economic traits of each GCC economy (Arouri et al., 2011; Hammoudeh & Choi, 2006; Maghyereh & Al-Kandari, 2007; Nusair, 2016). Sectoral-based studies also exist within this stream of research. Notably, Hamdi et al. (2019), via quantile regression analysis for the GCC sectoral indices, revealed that the banking, oil and gas, and transportation sectors negatively respond to price changes, whereas all sectors, except energy and transportation, are interreliant on OP volatility. Nusair and Al-Khasawneh (2018), using quantile regression analysis, revealed that the OPs and stock markets prices are more likely to boom together or crash together in the GCC region. Naifar and Al Dohaiman (2013), through the Markov regime-switching model, unearthed that the linkage between the GCC stock market returns and OPEC oil market volatility is regime dependent. Akoum et al. (2012), using wavelet coherency methodology, revealed the long-term dependencies between the stock market returns of GCC countries and OPEC basket oil returns during 2002 to 2011.
Benlagha (2020), via static copula modeling, revealed that the relationships between the Qatari and other stock markets shifted dramatically after the OP and the blockade crisis. The degree of change in the association varied with time and from one county group to the next. Furthermore, the study revealed that the global financial crisis of 2008 had a greater impact than price shocks and political crises.
Hammoudeh and Aleisa (2004) used the Johannsen cointegration mechanism to show a significant two-way causality link between OPs and stock returns for Saudi Arabia. Kisswani and Elian (2017), via a NARDL model, reported asymmetric long-run effects between OPs and sectoral SPs in Kuwait. Arouri and Rault (2011) revealed a bi-directional relationship between OPs and stock markets for Saudi Arabia. Mensi et al. (2015), through the bivariate dynamic conditional correlation–fractionally integrated asymmetric power ARCH model, highlighted the utility of considering commodities in the risk management portfolio for investors in the Saudi market.
Further, Mensi (2019) revealed that upward shifts in OPs affect the petrochemical sector the most, based on a wavelet approach and a value-at-risk measure. Further, the mid-2014 OP decline did not affect the bank, agriculture and food, telecommunications, media and publishing, and hotel and tourism sectors. Mohanty et al. (2018) showed that OPs had asymmetric effects on equity returns for 4 out of 15 sectors. Hamdan and Hamdan (2020), utilizing linear and nonlinear approaches, revealed that sectors in the Tadawul typically react asymmetrically to OPs. The study recommended building “oil neutral” portfolios instead of homogeneously investing in all sectors in the Tadawul. Jouini (2013), through a VAR–GARCH process, disclosed the presence of considerable transmission between the OP and the Saudi stock sectors.
Wasiuzzaman (2018) demonstrated that, while the Hajj period had a negligible negative impact on the TASI and sector indices’ mean returns, there was a considerable rise in volatility for the TASI and all sector indexes, with the exception of the retail, agriculture, food, and petrochemical sectors. Benlagha and Mseddi (2016) revealed that the European crisis had a significant impact on the Saudi stock market. The dummy variable model showed that international trading was the key transmission channel of the financial crisis to Saudi Arabian output. Alamro et al. (2019) forecast the Saudi Stock Market Index employing historical data and the influence of people’s emotions on their financial decisions. The study used the Global Data on Events, Location, and Tone (GDELT) dataset by Google, filtered for Saudi Arabian news.
Finally, money supply is also a central driver that affects SPs (Dwyer & Hafer, 1999; Pearce & Roley, 1985; Sprinkel, 1964). There exists a pair of competing theories pertaining to the link between money supply and SPs. The studies on this theme reveals mixed results. Some scholars supported the view that money supply affects stock markets (Hamburger & Kochin, 1972; Homa & Jaffee, 1971), whereas another set of studies revealed a reverse Granger causality from stock returns to variation in money (Rogalski & Vinso, 1977; Rozeff, 1974), with the later works reinforcing this effect (Patelis, 1997; Thorbecke, 1997). Maskay (2007) reaffirmed a positive linkage for the US and central European market in particular. Pinno and Serletis (2016) employed a trivariate VAR moving average, GARCH-in-mean, and Baba–Engle–Kraft–Kroner model to prove the relevance of the financial market and money supply volatility. Taamouti (2015) claimed that money supply affects the left and right tails of the stock return distribution but not its center. Rahman (2008) found a cointegrating linkage, but a short-run feedback linkage for the broad money supply (M2) and OP in the US stock market (S&P500). Through the extant literature on this theme, it is laconically noted that the focus of studies has been on country stock markets when inspecting the oil–stock market linkage. However, critics have argued that this type of broad treatment could disguise varied reactions from multifarious sectors on account of their unique traits (Arouri, 2011; Arouri & Nguyen, 2010; Scholtens & Yurtsever, 2012). As the variations in OPs have different effects on sectoral SPs, investors select stocks based on unique traits (Dai & Wen, 2018). Despite the significance of the Saudi stock market, related studies are scarce. The current endeavor aims to study the asymmetric effects of the underlying OP and money supply on the Saudi sectoral stock market prices, which will offer new insights into Saudi sectoral indexes with respect to OP fluctuations.
Data and Methodology
Data Set and Variables
We included monthly data from January 30, 2007 to December 28, 2016 (total 120 observations) collected from the Bloomberg and Yahoo Finance databases. We employed three independent variables, namely, the nominal spot crude OPs based on Brent (
Table 1 reports the descriptive statistics on the properties of the variables covered in this study, which also indicates that the majority of the variables are normally distributed throughout the sampling period. The highest (lowest) mean values are observed in the BANKS (INSU), while the highest (lowest) standard deviation is noticed in the HOTEL (INSU) sector.
Descriptive Statistics of the Variables.

Source. Saudi Central Bank (SAMA) (2020)
Model Specification
The linear autoregressive distributed lag (ARDL) approach, introduced by Pesaran et al. (1999), is also convenient when the series are stationary in I(0) and I(1). The ARDL model is most appropriate for this case, as the other alternative cointegration techniques are not applicable. This technique cannot be used in the case of series cointegrated with order I(2). The following equation is the general form of the ARDL model:

where Φ(L) = 1–
We focused on the NARDL model for identifying short- and long-run asymmetry among the variables. It is an extension of the work of Pesaran et al. (2001), who first introduced a linear ARDL cointegrating method for examining the long- and short-run effects. Afterward, a new approach was also developed by Shin et al. (2014), which shows the long-run and short-run asymmetric effects among the variables. We assumed the following asymmetrical long-run equation representing all the sectoral market prices:

where St denotes the SPs of the respective sector, LOP t is the nominal spot OP (henceforth OP), LMS and LTASI are money supply and the Tadawul All Share Index respectively, θ = θ0, θ1, θ2, θ3, θ4, θ5, and θ6 shows the cointegration vector of the long-run coefficients or parameters to be estimated, and et is the error component, which is assumed to be normally and independently distributed with zero mean and constant variance. We converted all the variables into their log forms:


The long-run relationship between OP increase and sectoral stock market price is denoted by θ1, θ2, θ3, θ4, θ5, and θ6, which are assumed to be negative (from equation [2] and onward). In fact, θ2 indicates a long-run association between OP decreases and sectoral stock market price, which is also expected to be negative. In other words, they are assumed to move in the opposite direction. It is also assumed that a decrease in OP might differently affect the long-run deviation in sectoral stock market prices for OP increases of the same level. Thus, θ1 and θ2 are not equal. Likewise, θ4 and θ6 show a long-run association between decreasing LMS and LTASI and sectoral stock market price. However, these are assumed to be positive, that is, they will move in the same direction. Equation (2) shows that the nonlinearity of OP, LMS, and TASI pass through to sectoral stock market prices. To drive nonlinear asymmetric ARDL, we need to substitute equation (2) in the equation (1) as suggested by Shin et al. (2014).
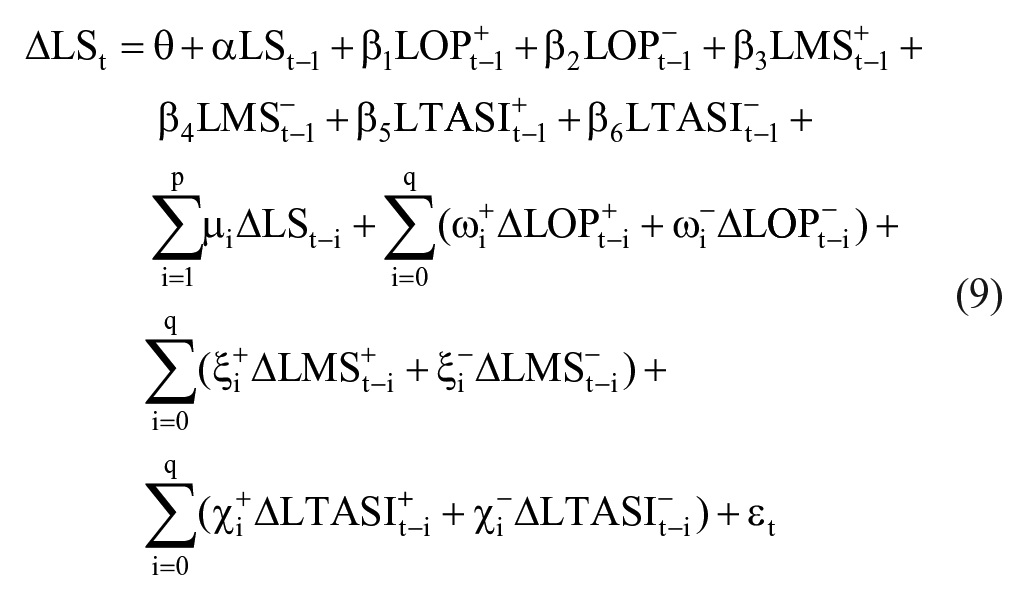
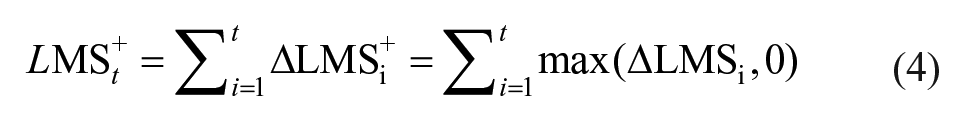
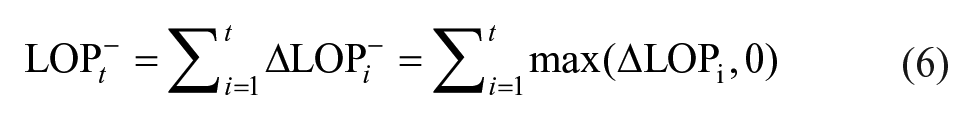
All the variables used in equation (9) are described above, except
To apply the NARDL, we followed the following steps outlined: First, we conducted a unit root test to detect the integration order of the variables, where none of the variable cannot be I(2), because this will lead to an invalid result. This is because the F-statistics will be no more reliable. This method can be executed even if the variables are found to be cointegrated in mixed order, that is I(0) and I(1). We conducted the augmented Dicky–Fuller (ADF) and Phillips and Perron (PP) tests to confirm the above requirements of NARDL models. We also conducted unit root tests as recommended by Zivot and Andrews (1992) to identify the structural breakpoints. Second, we applied a normal OLS method to determine the appropriate number of lags for the valid models.
Third, while estimating the NARDL model to examine the presence of a long-run relationship among the variables under study, we applied the F-tests (joint significance of the coefficients of the lagged level variables). Here, the null hypothesis of no cointegration (HN: α = ß+ = ß− = 0) was tested against the alternative hypothesis of presence of cointegration (HA: α ≠ ß+ ≠ ß− ≠ 0). Pesaran et al. (2001) provided two sets of critical values (upper and lower bounds) for the F-test. The null hypothesis of no cointegration is rejected if the obtained F-statistics are above the critical values (upper bound), indicating a long-run cointegrating relationship among the variables. Conversely, the null hypothesis of no cointegration cannot be rejected if the calculated F-statistics are below the critical values (lower bound), confirming the absence of a long-run cointegration relationship among the variables. Besides, the F-test will be inconclusive if the obtained F-statistics fall within the lower and upper bounds. Finally, we employed a cumulative dynamic multiplier to examine the long- and short-run nonlinear relationship between Ops, LMS, TASI (
Asymmetric cumulative dynamic multipliers effect:
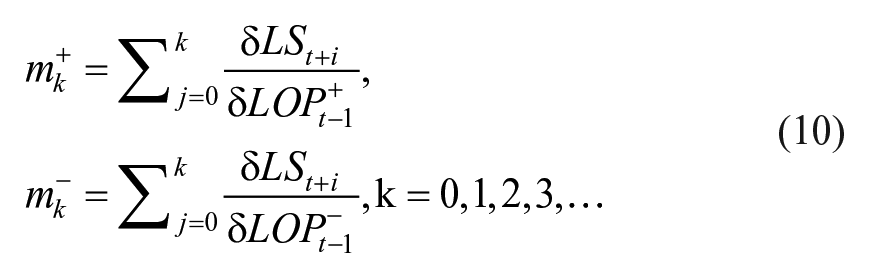


Note that, k→∞,
We applied various diagnostic tests, for instance, the Jarque–Bera statistics for normality, LM statistics (up to order two) for autocorrelation, the Ramsey RESET test for model specification, and the structural stability test of the cointegrating series by adopting cumulative sum of residual (CUSUM) and cumulative sum of residuals square (CUSUMSQ) plot.
Results and Discussion
To check the integration order of the variables, we present the results of the ADF and PP tests in Table 2, which show that almost all the 15 independent and four dependent variables are nonstationary in their level forms, but stationary in the first differences. Since none of the variables was stationary in the second difference, we proceeded to the next step: to run the bounds testing method for examining the cointegration relationship between two variables under the NARDL framework.
Unit Root Test With Structural Break.

Note. Null Hypothesis: The series has a unit root. The Akaike information criterion (AIC) is used to select the optimal lag order. For the ADF test, numbers in [ ] denote optimal lags and for the PP test, Bandwidth: [ ] (Newey–West automatic) using Bartlett kernel. The break dates are based on T-statistic for 1%, 5%, and 10% critical value are −5.57, −5.08, and −4.82, respectively, as suggested by the Zivot-Andrews(ZA). *, **, and *** indicate the level of significance at 10%, 5%, and 1%, respectively.
In solving the potential biased results from the ADF and PP tests to detect the presence of structural break, we reported the results of the Zivot-Andrews (ZA) test (Zivot & Andrews, 1992). It allows unit root test by determining structural break endogenously. Based on the outcome of the ZA test, we constructed two dummy variables (2008M12 and 2010M09) that appeared as exogenous variables in the NARDL model. The intention of including dummy variables was to control for the external shocks like global financial crisis of 2008 on the sectoral SPs, LMS, and TASI in Saudi Arabia.
Empirical Results
The NARDL bound test for cointegration is shown in Table 3. As the value of t-statistics and F-statistics were greater than the upper bounds critical value at 1% significance level for four sectors, that is, LBANKS, LCONS, LENERGY, and LPETRO, the null hypotheses of no cointegration were rejected (See Supplemental Appendix Table A1 for the bound test cointegration results of 15 sectors). This indicates the presence of asymmetric cointegration among the variables, implying that four out of fifteen sectors, that is, LBANKS, LCONS, LENERGY, and LPETRO, had long-run cointegrating relations with LOP, LMS, and LTASI in Saudi Arabia from January 30, 2007 to December 28, 2016. The findings allowed us to take asymmetry into consideration while focusing on the cointegrating relations among these variables.
Bound Test for Cointegration.

Note. Following Shin et al. (2011), we select k = 6 for all the models where k stands for number of regressors in the level equation. For NARDL, (F)the critical values for maximum finite sample (n = 80), are 3.46–4.94, 2.62–3.86, and 2.24–3.38 for 1%, 5%, and 10% significance levels, respectively. Asymptotic critical value bounds of the t-statistic are −3.43–(−4.99), −2.86–(−4.38), and −2.57–(−4.04) for 1%, 5%, and 10% significance levels, respectively. Superscript *, **, and *** indicate the level of significance at 10%, 5%, and 1%, respectively.
The nonlinear relationships between the dependent and independent variables were also examined (Table 4). In the short-run relationship (Panel B), the coefficient of the average ECT (error correction term) from four sectoral SPs was 38.5% (min. 26% and max. 59%), which were significant at the 1% level. This indicates that all the variables (four sectoral SPs) required approximately three periods (months) to adjust in the long run. Besides, these significant results support the stable long-run equilibrium relations among the variables under study.
Non-Linear ARDL Estimation Results.

Note. The long-run coefficient (LR) is obtained by
In model 1, the estimated long-run coefficient of LOP+ = −0.08 and LOP− = −0.06 and LMS+ = −0.35 and LMS− = 0.47 and LTASI+(−1) = 0.67 and LTASI−(−1) = 0.53 were statistically significant at the 1% level. We confirmed from the Wald test (WLR, LOP = 5.77) that the null hypothesis was rejected, indicating the long-run impact of LBANKS on LOP is asymmetry. The long-run coefficient of LR+ LOP and LR− LOP were equal to −0.14 and −0.10, respectively and were statistically significant at 1%. These imply that both positive and negative shocks of LOP were negatively related to LBANKS, while the positive shocks dominated the negative one. Specifically, a 1% increase in LOP led to a 0.14% decrease, while a 1% decrease in LOP led to a 0.10% increase in LBANKS ceteris paribus. This finding is consistent with those of Charfeddine and Barkat (2020), who showed the resilience of the nonoil sector to negative changes in OPs in the long run, while the effect of negative changes was not significant on nonoil-based real GDP. It indicates that in the long run, any increase in OPs does not contribute to increasing the value of banks’ SPs compared to the decrease in OPs. This is because the banks and financial institutions are interest sensitive, whereby higher OPs are influenced by the long-term mechanism through inflation. Moreover, the higher OPs increase the cost of production and slow the economic activities, which adversely affects the demand for banks’ credit and banks and financial institutions. The institutions face the challenge of managing surplus liquidity that affects their incomes, profits and particularly reducing the value of stocks.
The result of the Wald test (WLR, LMS = 19.29) confirmed the rejection of the null hypothesis, suggesting evidence of long-run asymmetric relations between LBANKS on LMS. The long-run coefficient of LR+ LMS and LR− LMS were equal to −0.60 and 0.79 respectively and were statistically significant at 1%. These indicate that positive and negative shocks for LMS were negatively and positively related to LBANKS, respectively, although the positive shocks dominated over the negative. Precisely, a 1% increase in LMS led to a 0.60% decrease in LBANKS, while a 1% decrease in LMS led to a 0.79% decrease in LBANKS ceteris paribus. This outcome suggests the ineffectiveness of monetary policy in Saudi Arabia as it controls the interest rate and adopts the local currency fixed to the US dollar. The country’s present fixed exchange rate regime is ineffective when its partner countries apply expansionary monetary policies for stimulating their economies, as it creates inflationary pressures. Besides, it follows the classical model of general equilibrium, where monetary policy is ineffective in changing the aggregate demand. Our finding is inconsistent with those of Alshogeathri (2011) and Khoj (2017), who revealed a positive link between LMS and SPs in Saudi Arabia. Another study by Alsamara et al. (2017) found evidence of positive OP changes being more dominant than negative shocks on the money demand.
We reject the null hypothesis based on the Wald test (WLR, LMS = 11.72), confirming the existence of long-run asymmetric relations between LBANKS on LTASI. The long-run coefficient of LR+ LTASI and LR− LTASI were equal to 1.14 and 0.90, respectively and were statistically significant at 1%. These indicate that both positive and negative shocks for LTASI were positively related to LTASI, the positive shocks were more than the negative, a 1% increase in LTASI led to a 1.14% increase in LBANKS, while 1% decrease in LTASI led to a 0.90% decrease in LBANKS ceteris paribus. Similarly, in the short run (model 1), we observed only that the impact of LTASI on LBANKS was asymmetric to the significant value of Wald test (WSR, LTASI = 60.02). The short-run coefficients of positive and negative changes of LTASI were 1.40 and 0.72, respectively, indicating that a 1% increase in LTASI caused a 1.40% increase in LBANKS. Similarly, a 1% decrease in LTASI caused a 0.72% decrease in LBANKS. So, the positive effect superseded the negative effects. This is in line with the proposition that the stock market as an integral part of the financial system positively contributed to financial development (Levine, 2018). These results suggest that the Saudi stock market has a significant relation with banks SPs in both the long and the short run. A well-functioning stock market helps expand the economy through diversified economic activities. It also enhances the confidence of investors and attracts them to buy more stocks. This higher demand for particular stocks increases the market value of banks and financial institutions.
In model 2, the estimated long-run coefficient of LOP+(−1) = 0.23 and LOP− = 0.14 and LTASI+ = 0.59 and LTASI−(−1) = 0.18 were statistically significant at the 1% level. We also confirmed this from the Wald test (WLR, LOP = 34.70 and WLR, TASI = 23.80), where the null hypotheses were rejected at the 1% significance level, indicating the long-run impact of LCONS on LOP and LTASI were asymmetric. The long-run coefficient of LR+LOP and LR−LOP, equal to 0.64 and 0.39, were statistically significant at 1%, implying that both positive and negative shocks for LOP were positively related to LCONS, while the positive shocks dominated the negative. Specifically, a 1% increase in LOP led to a 0.64% increase in LCONS, while a 1% decrease in LOP led to a 0.39% decrease in LCONS ceteris paribus. This finding is inconsistent with those of Demirer et al. (2015) and Mohanty et al. (2011). As an oil-exporting country, the Saudi economy largely depends on oil revenue to finance development projects and the growth of building, and the construction sector mostly relies on OPs. Higher OPs have led to higher fiscal revenues to finance the government’s mega construction projects, like King Abdullah Financial District, Qiddiya Entertainment City, Neom, the Red Sea Project (Mordor Intelligence, 2021). On the other hand, a decreasing OP would force the country to cut the development budget thus affecting these mega construction projects.
Any long-term fluctuation in OPs is linked to the growth of the building and construction sector as reflected in their SPs. Again, the long-run coefficient of LR+LTASI and LR−LTASI were equal to 1.64 and 0.50, respectively and were statistically significant at 1%, suggesting that both positive and negative shocks for LTASI were positively related to LCONS, whereas the positive shocks dominated over the negative. Precisely, a 1% increase in LTASI led to a 1.64% increase in LCONS and a 1% decrease in LTASI led to a 0.50 % decrease in LCONS ceteris paribus. The inclusion of Saudi Stock Exchange (Tadawul) in the MSCI Emerging Markets Index and Financial Times Stock Exchange (FTSE) emerging market indexes has enhanced its weighting of the index’s total market capitalization with the trading of foreign investors. This emerging stock market has had an impact on economic growth through market capitalization, liquidity, risk sharing and mostly diversification of real sectors like building and construction. Similarly, in the short run (model 2), we noticed that only the impact of LOP on LCONS was asymmetric, with a significant value of the Wald test (WSR, LOP = 56.28). The short-run coefficients of positive and negative changes of LOP (−1) were 0.23 and 0.20, respectively, indicating that a 1% increase in LOP caused a 0.23% increase in LCONS and a 1% decrease in LOP caused a 0.20% decrease in LCONS. So, the positive effect superseded the negative effects. The analogy for this finding is similar to what we found in the long run.
In model 3, the estimated long-run coefficient of LOP+ = 0.09 and LOP− = 0.07, LTASI+(−1) = 0.33 and LTASI−(−1) = 0.30 were statistically significant at the 5% and 1% level, respectively. We confirmed from the Wald test (WLR, LOP = 8.29 and WLR, LTASI = 12.18) that the null hypotheses were rejected, signifying that the long-run impact of LENERGY on LOP and LTASI were asymmetric. The long-run coefficient of LR+ LOP−and LR− LOP were equal to 0.27 and 0.21, respectively and were statistically significant at 5%, implying that both positive and negative shocks for LOP were positively related to LENERGY, while the positive shocks dominated the negative one. It indicates that a 1% increase in LOP led to a 0.27% increase and a 1% decrease in LOP led to a 0.21% decrease in LENERGY, assuming the effects of other variables remain constant. This finding is similar to that of Charfeddine and Barkat (2020), who observed that positive changes in OP have more impact than the negative changes in real GDP. Saudi Arabia, as a leading oil-exporting country, expects higher OPs as reflected in the higher prices of energy and utility stocks. In facing the downfall of OPs in the world market, the country is gradually increasing domestic OPs and other energy prices, including electricity, to support its deficit budget and to maintain the consistency of energy and utility stocks for investors.
The long-run coefficient of LR+LTASI and LR−LTASI were equal to 0.99 and 0.90, respectively, and were statistically significant at 1%, indicating that both positive and negative shocks for LTASI were positively related to LENERGY, whereas the effect of positive shocks were greater than the negative, indicating that a 1% increase in LTASI led to a 0.99% increase and a 1% decrease in LTASI led to a 0.90% decrease in LENERGY ceteris paribus. The same justification was applied where we mentioned that a developed stock market led to an increase in investor confidence in investing sectors where dividends and stock returns are higher. In other words, overall stock market performance led to an increase in SPs of individual sectors through the wealth effect. However, the key factor behind the performance of energy sectors is higher OPs in Saudi Arabia because of a higher correlation between OPs and the energy sector. However, in the short run (model 3), we observed only the impact of LTASI on LENERGY is asymmetric because of the significant value of the Wald test (WSR, LTASI = 36.49). The short-run coefficients of positive and negative changes of LTASI were 0.74 and 0.64, respectively, indicating that a 1% increase in LTASI caused a 0.74% increase in LENERGY and a 1% decrease in LTASI caused a 0.64% decrease in LENERGY. So, the positive effect exceeded the negative effects.
In model 4, the estimated long-run coefficient of LOP+ = 0.09 and LOP−(−1) = 0.05, LTASI+(−1) = 0.42 and LTASI−(−1) = 0.30 were statistically significant at the 1% level except for LOP−(−1) = 0.05, which was significant at the 10% level. We established the asymmetric long-run impact of LPETRO on LOP and LTASI because of rejecting the null hypotheses of the Wald tests (WLR, LOP = 4.78 and WLR, LTASI = 2.99). The long-run coefficient of LR+LOP and LR−LOP, equal to 0.35 and 0.19, were statistically significant at 1% and 5%, respectively, suggesting that both positive and negative shocks for LOP were positively related to LPETRO, whereas the positive shock was more than the negative one. It shows that a 1% increase in LOP led to a 0.35% increase and 1% decrease in LOP led to a 0.19% decrease in LPETRO ceteris paribus. Our results are consistent with others (Badeeb & Lean, 2018; Kisswani & Elian, 2017; Trabelsi, 2017), who revealed the asymmetric effect of OPs on the sectoral SPs. Since Saudi Arabia is one of the global net oil and oil products exporters and it has emerged as one of the main producers of petrochemicals, the higher OP is related to the expansion of petroleum-related activities, utilization of external funds, minimizing the cost of production, managing the cost of sales of petrochemical products (pharmaceuticals, plastics, coolants, cosmetics, packaging fibers, rubbers, tires, detergents, fertilizers, etc.). One of the key factors behind the profitability of the industry players, including SABIC, SAFCO, NIC, SPC, APC, Nama, SIIG, Sipchem, and TANSEE lies in the subsidized price of raw materials, including crude oil, which makes the industry globally competitive. That is why higher OPs left industry players unaffected: however, the fall in oil price led to a decrease in the government’s revenue, thus affecting its subsidy policy. The Saudi petrochemical sector appears to be one of the most active sectors in terms of total volume of traded shares, which were 23.73% and 16.28 in 2009 and 2015, respectively (Tadawul & SAMA, 2019).
The long-run coefficient of LR+ LTASI and LR− LTASI were equal to 1.62 and 1.15, respectively and were statistically significant at 1%, showing that both positive and negative shocks for LTASI were positively related to LPETRO, and the effect of positive shocks were more than the negative one. It indicates that a 1% increase in LTASI led to a 1.62% increase and a 1% decrease in LTASI led to a 1.15% decrease in LPETRO assuming that the effects of others were constant. In the short run, the impacts of LTASI on LPETRO were asymmetric as we rejected the null hypothesis of the Wald test (WSR, LTASI = 50.56). The short-run coefficients of positive and negative shocks of LTASI were 1.22 and 0.95, respectively, showing that a 1% increase in LTASI caused a 1.22% increase in LPETRO and a 1% decrease in LTASI caused a 0.95% decrease in LPETRO ceteris paribus, where the positive influence surpassed the negative influence. The stock market development caused increased demand for the stock of petrochemical companies listed in Tadawul. The petrochemical products have higher demand than other industries, including automobile, textile, ICT, construction, and even medical and pharmaceuticals. Besides, this sector consistently pays higher dividends and ensures higher returns for the shareholders compared to other global companies.
Dynamic Nonlinear Multiplier Outcomes
To examine the pattern of dynamic asymmetric adjustments of sectoral SPs from their initial long-run equilibriums to the new long-run equilibrium after a shock, we demonstrate the dynamic multipliers recommended by Shin et al. (2014). Figure 1 shows the cumulative dynamic nonlinear multiplier outcomes for up to 15 months for the reaction of each economic sector on the positive and negative changes in LOP, LMS, and LTASI. The solid (dashed) black lines show how sectoral SPs (LNBANKS, LCONS, LPETRO, and LENERGY) adjusted with the positive (negative) shocks in OLP, LMS, and LTASI. The light dashed red line, known as the asymmetric line, shows the lower and upper band of the 95% confidence interval. If the zero line falls within the boundary, it indicates no sign of asymmetry because of a statistically significant outcome.

Cumulative dynamic multipliers (CDM): (a) LBANKS–LOP, (b) LBANKS–LMS, (c) LBANKS–LTASI, (d) LCONS–LOP, (e) LCONS–LMS, (f) LCONS–TASI, (g) LPETRO–LOP, (h) LPETRO–LMS, (i) LPETRO–LTASI, (j) LENERGY–LOP, (k) LENERGY–LMS, and (l) LENERGY–LTASI.
Consistent with what we have estimated in Table 4, the CDM graphs show that initially the negative and positive change in LOP was quite similar, but after three to four periods, the negative effect was observed to be gradually increasing more than the positive change in the long run. On the other hand, the effect of positive change in LMS was steadily higher than for negative changes in the long run. At the beginning, the positive change in LTASI dominated over negative change; however, after three periods, the changes became constant over the long run in the rest of the periods. The dynamic multipliers in these cases took about 6 to 7 months to gain the convergence with the long-run equilibrium.
The figure demonstrates the findings identical to those shown in Table 4 where no long-run asymmetry is observed between LOP and LMS with LCONS, although there is a noticeable negative reaction of LTASI to LCONS (Figure 1e). The long-run asymmetry is observed between LOP, and LTASI with LPETRO (Figure 1g and i) and the adjustment for the latter was led by the effect of the positive shocks in LTASI, which took around 9 to 11 months to converge in the long-run multipliers’ values, whereas no long-run asymmetry was identified between LMS with LPETRO (Figure 1h).
At the beginning, negative changes in LOP, which dominated positive changes, remained constant in the long run. There was a positive link observed between the LENERGY and LOP (Figure 1j). Again, negative and positive change of LTASI on LENERGY was almost identical and gradually stabilized over the long run. It took around 8 to 9 months to achieve the long-run equilibrium (Figure 1l).
Diagnostic Tests
We examined the results from various diagnostic tests based on the classical linear regression model using the OLS of the error terms because the NARDL frameworks are built on similar assumptions as the OLS. Table 4 shows that all the models were free from the problem of nonnormality (errors are normally distributed) and auto-correlation (absence of serial correlation); most importantly, all the models were rightly specified, thus satisfying the underlying assumptions. The Ramsey RESET test results confirmed that all the models were rightly specified and the F-statistics with their corresponding p-values ensured model prediction and accuracy. We then employed the CUSUM and CUSUMSQ tests as recommended by Pesaran and Pesaran (1997) to the confirm the models’ stability. All four models were stable throughout the study periods (Figure 2a to h).

Plot of cumulative sum and cumulative sum of squares of recursive residuals: (a) cumulative sum (CUSUNM) test on LBANKS, (b) cumulative sum of Sq. (CUSUNM SQ) test on LBANKS, (c) cumulative sum (CUSUNM) test on LCONS, (d) cumulative sum of Sq. (CUSUNM SQ) test on LCONS, (e) cumulative sum (CUSUNM) test on LPETRO, (f) cumulative sum of Sq. (CUSUNM SQ) test on LPETRO, (g) cumulative sum (CUSUNM) test on LENERGY, and (h) cumulative sum of Sq. (CUSUNM SQ) test on LENERGY.
Robustness Check
To check the robustness of the results obtained, we estimated the NARDL model based on WTI OPs consistent with the same set of samples and variables. The short-run and long-run results were found to be identical to the earlier estimations based on LOP (Supplemental Appendix Tables A1–A3).
Conclusion and Policy Implications
The purpose of this empirical study was to enrich the extant literature by investigating the asymmetric effects of changes in oil prices (LOPs), money supply (
We found asymmetric effects of OPs, LMS, and LTASI on the four purported sectoral SPs. The common underlying factor for these four sectoral indices was the considerable response of these sectoral indices to the OP market, which can be driven by the fact that OP variations influence the level of real economic activity in these selected sectors, which in turn affect SPs through changes in the values of expected future cash flows (Jouini & Khallouli, 2019). Moreover, these findings support the significant linkage between money demand and SPs in the long run (Al Rasasi, Rawah, et al., 2019) and reveal the causal relationship between stock market returns and economic activities in the Saudi economy (Al Rasasi, Alsabban, et al., 2019).
Thus given the selected Saudi sectoral index’s high degree of dependency on oil, even a slight increase in OPs will induce greater uncertainty in individuals and businesses, generating asymmetric behavior in the long run. In this line, studies have demonstrated that increased uncertainty about future prices is a key cause of the asymmetric transmission mechanism (Altintas & Yacouba, 2018; Foerster, 2014).
In the case of LBANKS, we found long-run asymmetry in both ways (positive and negative) of LOP, LMS, and LTASI, whereas there was short-run asymmetry (positive and negative) only for LTASI. This finding is consistent with Hamdi et al. (2019). In other words, the impact of OPs in either way (decreases or increases) was identical to the SPs of banking sector. The impact of an increase in LMS had less influence than the decrease in LMS on the banks’ SPs. This result reveals the particular characteristic of Saudi monetary policy as it favors openness, whereby the riyal has been pegged to the US dollar for many years. Besides, the interest rates as a key component of monetary policy are seen to be sensitive and weakly linked with Saudi stock market.
In this study, we identified long-run asymmetry (positive and negative) of LOP and LTASI and short-run asymmetry (positive and negative) of LOP and single way (negative) of LTASI with LCONS. These findings are similar to those of other studies (Arouri & Rault, 2012; Bjørnland, 2009; Gil-Alana & Yaya, 2014). More precisely, an increase in LOP and LTASI have more influence than a decrease in LOP and LTASI on the LCONS. An increase in OPs has less impact on the building and construction sector because of the initiation of government’s mega projects aimed at achieving Saudi Vision 2030. Moreover, we found that the overall performance of LTASI also affected the LCONS through a wealth effect.
In the case for LENERGY, we noticed long-run asymmetry (positive and negative) of LOP, LTASI, and only positive of LMS but short-run asymmetry (positive and negative) of LTASI and only negative of LOP. To explain further, the impact of an increase of OPs was observed to be lower than the impact of a decrease in OPs on LENERGY. This finding is inconsistent with other studies (Kumar et al., 2012; Moya-Martínez et al., 2014). A possible explanation for this relationship is that subsidized domestic OPs causes the energy and utilities sector to be less affected during higher OPs in the international market. However, the gradual lifting of the government’s subsidy policy for gas, electricity, and domestic OPs over the past few years has created a tighter situation in the energy and utilities sector (Oxford Business Group, 2016; Sarrakh et al., 2020). As for LPETRO, we established a long-run asymmetry (positive) of LOP and both ways (positive and negative) for LTASI and a short-run asymmetry (positive and negative) of LOP and LTASI. More explicitly, the impact of an increase in both LOP and LTASI were higher than their decreases on LPETRO.
To sum up, the results of this study are significant for investors and portfolio managers to minimize the risk and maximize the returns from investing in certain sectors, particularly in a situation with negative and positive effect of OPs, LMS, and TASI. The importance and dependence on OPs and TASI and the reduced effect of LMS are seen to profoundly influence four key sectors, namely, banks and financial services, building and construction, energy and utilities, and the petrochemical industry to various degrees in the Saudi economy. The empirical results of this study have central policy implications. The market participants, mainly portfolio managers and investors, should consider the sensitiveness of these four sectors when designing their asset allocation decisions in the situation of an abrupt shock in the Saudi stock market. The response of these four sectors were varied in the short and long run. Likewise, the findings of this study function to assist portfolio managers’ and investor’s activities, oriented toward short- and long-term planning issues. In order to prevent shocks from OPs on the stock market, the present energy efficiency polices need to be aligned with the diversification and effective pricing of oil for domestic and industrial users. Furthermore, the Saudi economy should diversify and look for other driving sources of the economy beside oil resources to achieve the Saudi Vision 2030.
Supplemental Material
sj-docx-1-sgo-10.1177_21582440211071110 – Supplemental material for Asymmetric Linkages of Oil Prices, Money Supply, and TASI on Sectoral Stock Prices in Saudi Arabia: A Non-Linear ARDL Approach
Supplemental material, sj-docx-1-sgo-10.1177_21582440211071110 for Asymmetric Linkages of Oil Prices, Money Supply, and TASI on Sectoral Stock Prices in Saudi Arabia: A Non-Linear ARDL Approach by Md Fouad Bin Amin and Mohd Ziaur Rehman in SAGE Open
Footnotes
Acknowledgements
The authors would like to thank the Deanship of Scientific Research at King Saud University represented by Research Centre at College of Business Administration for supporting this research financially.
Declaration of Conflicting Interests
The author(s) declared no potential conflicts of interest with respect to the research, authorship, and/or publication of this article.
Funding
The author(s) received no financial support for the research, authorship, and/or publication of this article.
Supplemental Material
Supplemental material for this article is available online.
References
Supplementary Material
Please find the following supplemental material available below.
For Open Access articles published under a Creative Commons License, all supplemental material carries the same license as the article it is associated with.
For non-Open Access articles published, all supplemental material carries a non-exclusive license, and permission requests for re-use of supplemental material or any part of supplemental material shall be sent directly to the copyright owner as specified in the copyright notice associated with the article.