
Abstract
We examine the transition in household environment condition (HEC) in India during 2004–2012 by using panel data of the India Human Development Survey. In particular, this study documents the movement of households into and out of poor HEC. We found that a higher proportion of socially deprived classes, namely, Scheduled Tribes, Scheduled Castes, and Other Backward Castes, were continued to be in or fall into poor HEC than the General Castes. The movement out of poor HEC (to middle and better-off HEC) was least observed among the underprivileged Castes than the General Castes. Similarly, households in economically poor condition and those with illiterate and primary occupation household heads were entering into or remaining more in poor HEC than their counterparts. By regions, Central and Eastern regions were either continued to be more in poor HEC or experienced the least upward movement from poor HEC to the middle and better-off condition than other regions. Findings based on multivariate logistic regression models have reinforced the results from the bivariate analyses. From a policy perspective, the findings advance that socially disadvantaged population needs greater emphasis on ongoing programs to improve household living and environmental conditions in India.
Introduction
Household environment condition (HEC) generally refers to availability and accessibility of the households to type and condition of the housing, toilet facility, the source of drinking water, and cooking fuel besides their hygienic behavior. Sustainable Development Goal 6 pledges to guarantee the availability and accessibility of improved water, sanitation, and hygiene for all households. However, the COVID-19 outbreak has placed the issue of availability and accessibility of improved water, sanitation, and hygiene at the forefront of the global policies to fight against infection. Although significant improvement has been observed in improved availability and accessibility to clean water and sanitation, yet billions of people, largely in rural areas, lack these basic amenities (United Nations, 2018). Globally, one third population does not have accessibility to clean water, four of 10 people fail to access water and soap for washing hands, and about 673 million and more individuals continue to practice open defecation (Gwenzi, 2020).
The household environment is proved to be a key socioeconomic determinant of health. The existing evidence shows that poor HEC leads to morbidity, child malnutrition, poor cognitive skills, and mortality among household members (World Health Organization [WHO], 2012). About 10% of deaths in India are from causes related to unimproved water, sanitation, and hygiene (De Francis, 2011). Children residing in rural areas where most of their neighbors practice open defecation were found with poor cognitive skills. For instance, researchers found that those children exposed to open defecation are having less likelihood of reading paragraphs than children residing in villages with access to improved sanitation (Spears & Lamba, 2013). Studies have also shown that open defection is a significant determinant of diarrhea and intestinal infections, thereby causing stunting and infant mortality in both rural and urban settings (Cameron et al., 2013; Fink et al., 2011; Goli et al., 2011; Humphrey, 2009; Spears, 2013, 2012; Saroj et al., 2020).
Better-quality sanitation amenities and hygiene practices help maintain good health in people by keeping them away from diseases and malnutrition, and also improve their productivity and subsequent economic gains. Poor sanitation facilities and hygienic practices are also contributing to the economic loss indirectly through medical care cost of illness and time loss (Van Minh & Nguyen-Viet, 2011). Some evidence suggests that advancement in HECs such as access to clean water for drinking, modern sanitation amenities, hygiene, and clean cooking energy can reduce stunting and increase the growth in height of children much more than the nutritional intervention (Bhutta et al., 2008; Esrey, 1996; Martorell & Young, 2012). A majority of the countries around the world focus more on the availability and accessibility of food for improving the nutritional status of their population. However, insufficient food is not the only determinant of malnutrition in the population in many developing countries. Several studies have suggested that interventions in Water, Sanitation, and Hygiene (WASH) protects children from malnutrition (Monteiro et al., 2010). Quantitative evidence shows that about 50% of the consequence of malnutrition is caused by poor WASH (Prüss-Üstün & Corvalán, 2006; World Bank, 2006). Furthermore, a recent study suggests that the aggregate measure of household environment health risk shows a detrimental effect on child malnutrition (Singh et al., 2015).
Despite India’s notable economic progress over the last two decades, yet a significant proportion of households struggle for fulfilling their minimum needs, including the accessibility of decent housing, clean water for drinking, and modern sanitation amenities, safe fuel for cooking, food, and health care (Coffey & Spears, 2017; Office of the Registrar General and Census Commissioner, 2012). In India, about 80% of rural households use biomass fuel, comprising animal dung, wood, and crop residue that produces carbon monoxide and other indoor air pollutants. Women and children who spend time at home are susceptible to more risk of illness and mortality owing to unclean cooking fuel (Creel, 2002). The present situation of improved sanitation in the country is miserable. India remains to be a country with the maximum number of individuals (597 million) practicing open defecation globally (United Nations Children’s Emergency Fund [UNICEF], & WHO, 2014). The latest 2011 Census estimate states that about 53.1% of total households in India and 69.3% of households in its rural areas typically do not use improved toilets or latrines for defecation. Moreover, more than 40 million residents in urban areas in India are often defecating in the open. This is primarily because of the absence of amenities and also lower usage of prevailing amenities. Only one third of sanitation facilities in urban areas have piped sewerage mechanisms linked to a sewage treatment plant—which is conceivably treated as per disposal standards (Coffey & Spears, 2017; Ideas for India for More Evidence-Based Policy, 2015; Office of the Registrar General and Census Commissioner, 2012).
From the inception of the National Rural Health Mission (NRHM), which is currently renamed to National Health Mission (NHM), there has been a considerable emphasis on household environmental conditions and their impact on health in the country (Government of India, 2005). However, there is hardly any evidence on the question, “How far health and sanitation drives have brought a change in HEC in India across households with different socioeconomic affiliations?” Earlier studies based on small-scale household surveys on poverty found significant Caste differential in moving out of poverty. In modern India, for the purpose of constitutional and political operations, Caste groups are broadly classified into four Social Group: General, Other Backward Caste (OBC), and Scheduled Caste (SC) and Scheduled Tribes (STs) groups. General Castes comprises the Brahmin (Priest) and other upper castes who have been traditionally ruling class owing to possession of the social and economic capital. OBCs have lower socioeconomic status compared with General Caste. Dalits (SCs), which is implied as lowest caste, more often worked as landless labors and often belong to poor socioeconomic status. Ethnic minorities or Adivasis (Scheduled Tribes [STs]) too have suffered from historic exclusion due to geographic isolation and have traditionally lived in poorest of the poor socioeconomic status. In India, class differentials have been historically mirrored with Caste differential. Poverty has been concentrated among the disadvantaged social groups; thus, the pattern of poverty and underdevelopment echoes within inter-Caste differences over time. Moreover, poorer households have a lack of resources to invest in improved sanitation facilities and depend more on solid fuel (Khosla & Jena, 2020). The evidence from large-scale surveys backs the same evidence. The underprivileged groups such as SCs, STs, and OBCs showed the lowest rate of moving out of poverty compared with General Castes. For instance, 63% of General Castes, 43% of OBCs, 37% of SCs, and 30% of STs moved out of poverty during 2004–2005 to 2011–2012 (Thorat et al., 2017). Similar results were found by other studies using retrospective and panel studies of income on poverty (Dhamija & Bhide, 2013; Krishna, 2003; Krishna & Shariff, 2011; Mehta & Bhide, 2003). Similarly, by using panel data from the nationally representative Indian Human Development Survey, another study found that disadvantaged communities such as SC and ST households had a higher risk of entering into or continuing in poverty compared with those advantaged social groups as General Caste (Thorat et al., 2017).
Earlier studies have focused on dynamics of change in poverty (Dhamija & Bhide, 2013; Krishna, 2003; Krishna & Shariff, 2011; Mehta & Bhide, 2003; Thorat et al., 2017). This study uses two rounds of India Human Development Survey (IHDS) panel data that provide a unique opportunity to assess change in HEC as a movement of households falling into, moving out of poor HEC, and remaining in poor HEC across India by different socioeconomic characteristics and states. Therefore, the study aims to assess (a) transition in HECs during 2004–2012 by different household socioeconomic variables, and (b) to assess different socioeconomic factors contributing to the differences in change in HEC. Particularly, this study is interested in assessing the movement of households into and out of poor HEC using panel data of IHDS that tracked the same households who were interviewed in 2004–2005 and reinterviewed in 2011–2012.
Method
Data and study population
We use longitudinal data compiled from two waves of IHDS 2004–2005 and 2011–2012. IHDS is a countrywide representative survey conducted in partnership with the scientists from the University of Maryland and the National Council of Applied Economic Research (NCAER), New Delhi. The first wave of the IHDS was administered to a sample of 41,554 households. In the second wave, 83% of the sample were reinterviewed from IHDS-I, with a replacement of a sample of 2,134 households (Desai & Vanneman, 2015). The total sample size of reinterviewed households in IHDS-II was 40,018. Both waves of IHDS collect data on the socioeconomic, demographic, and health status of the households. They have also collected data on HEC, includes water, sanitation facilities, hygiene, and cooking fuel. IHDS covers all the states and union territories of India, excluding Andaman/Nicobar and Lakshadweep Islands.
Outcome variable
The study considers HEC as an outcome variable categorized into four categories: (a) poor in 2005 and 2012, (b) poor in 2005 but nonpoor in 2012, (c) nonpoor in 2005 and poor in 2012, and (d) nonpoor in 2005 and 2012.
By using the information on HEC, 18 selected indicators were dichotomized as 0 denoting deprived and 1 representing an advantaged group (see Table 1). To construct the index of HEC using 18 household-level variables, we used principal components analysis (PCA). For each of the HEC measures, a factor score (weight) was allotted—estimated using the PCA. The result of HEC scores was standardized relative to a normal distribution with a mean of 0 and standard deviation of 1. The generated scores were categorized into three equal classes: poor, middle, and better-off HEC for both waves of the survey. The procedure of construction of the HEC index was adopted from DHS methodology for wealth index construction (Vyas & Kumaranayake, 2006). The reliability of 18 measures used for the index construction was carefully assessed both empirically and qualitatively. The reliability measures are stated at the footnotes of Table 1.
Indicators Included in Household Environment Condition Index.
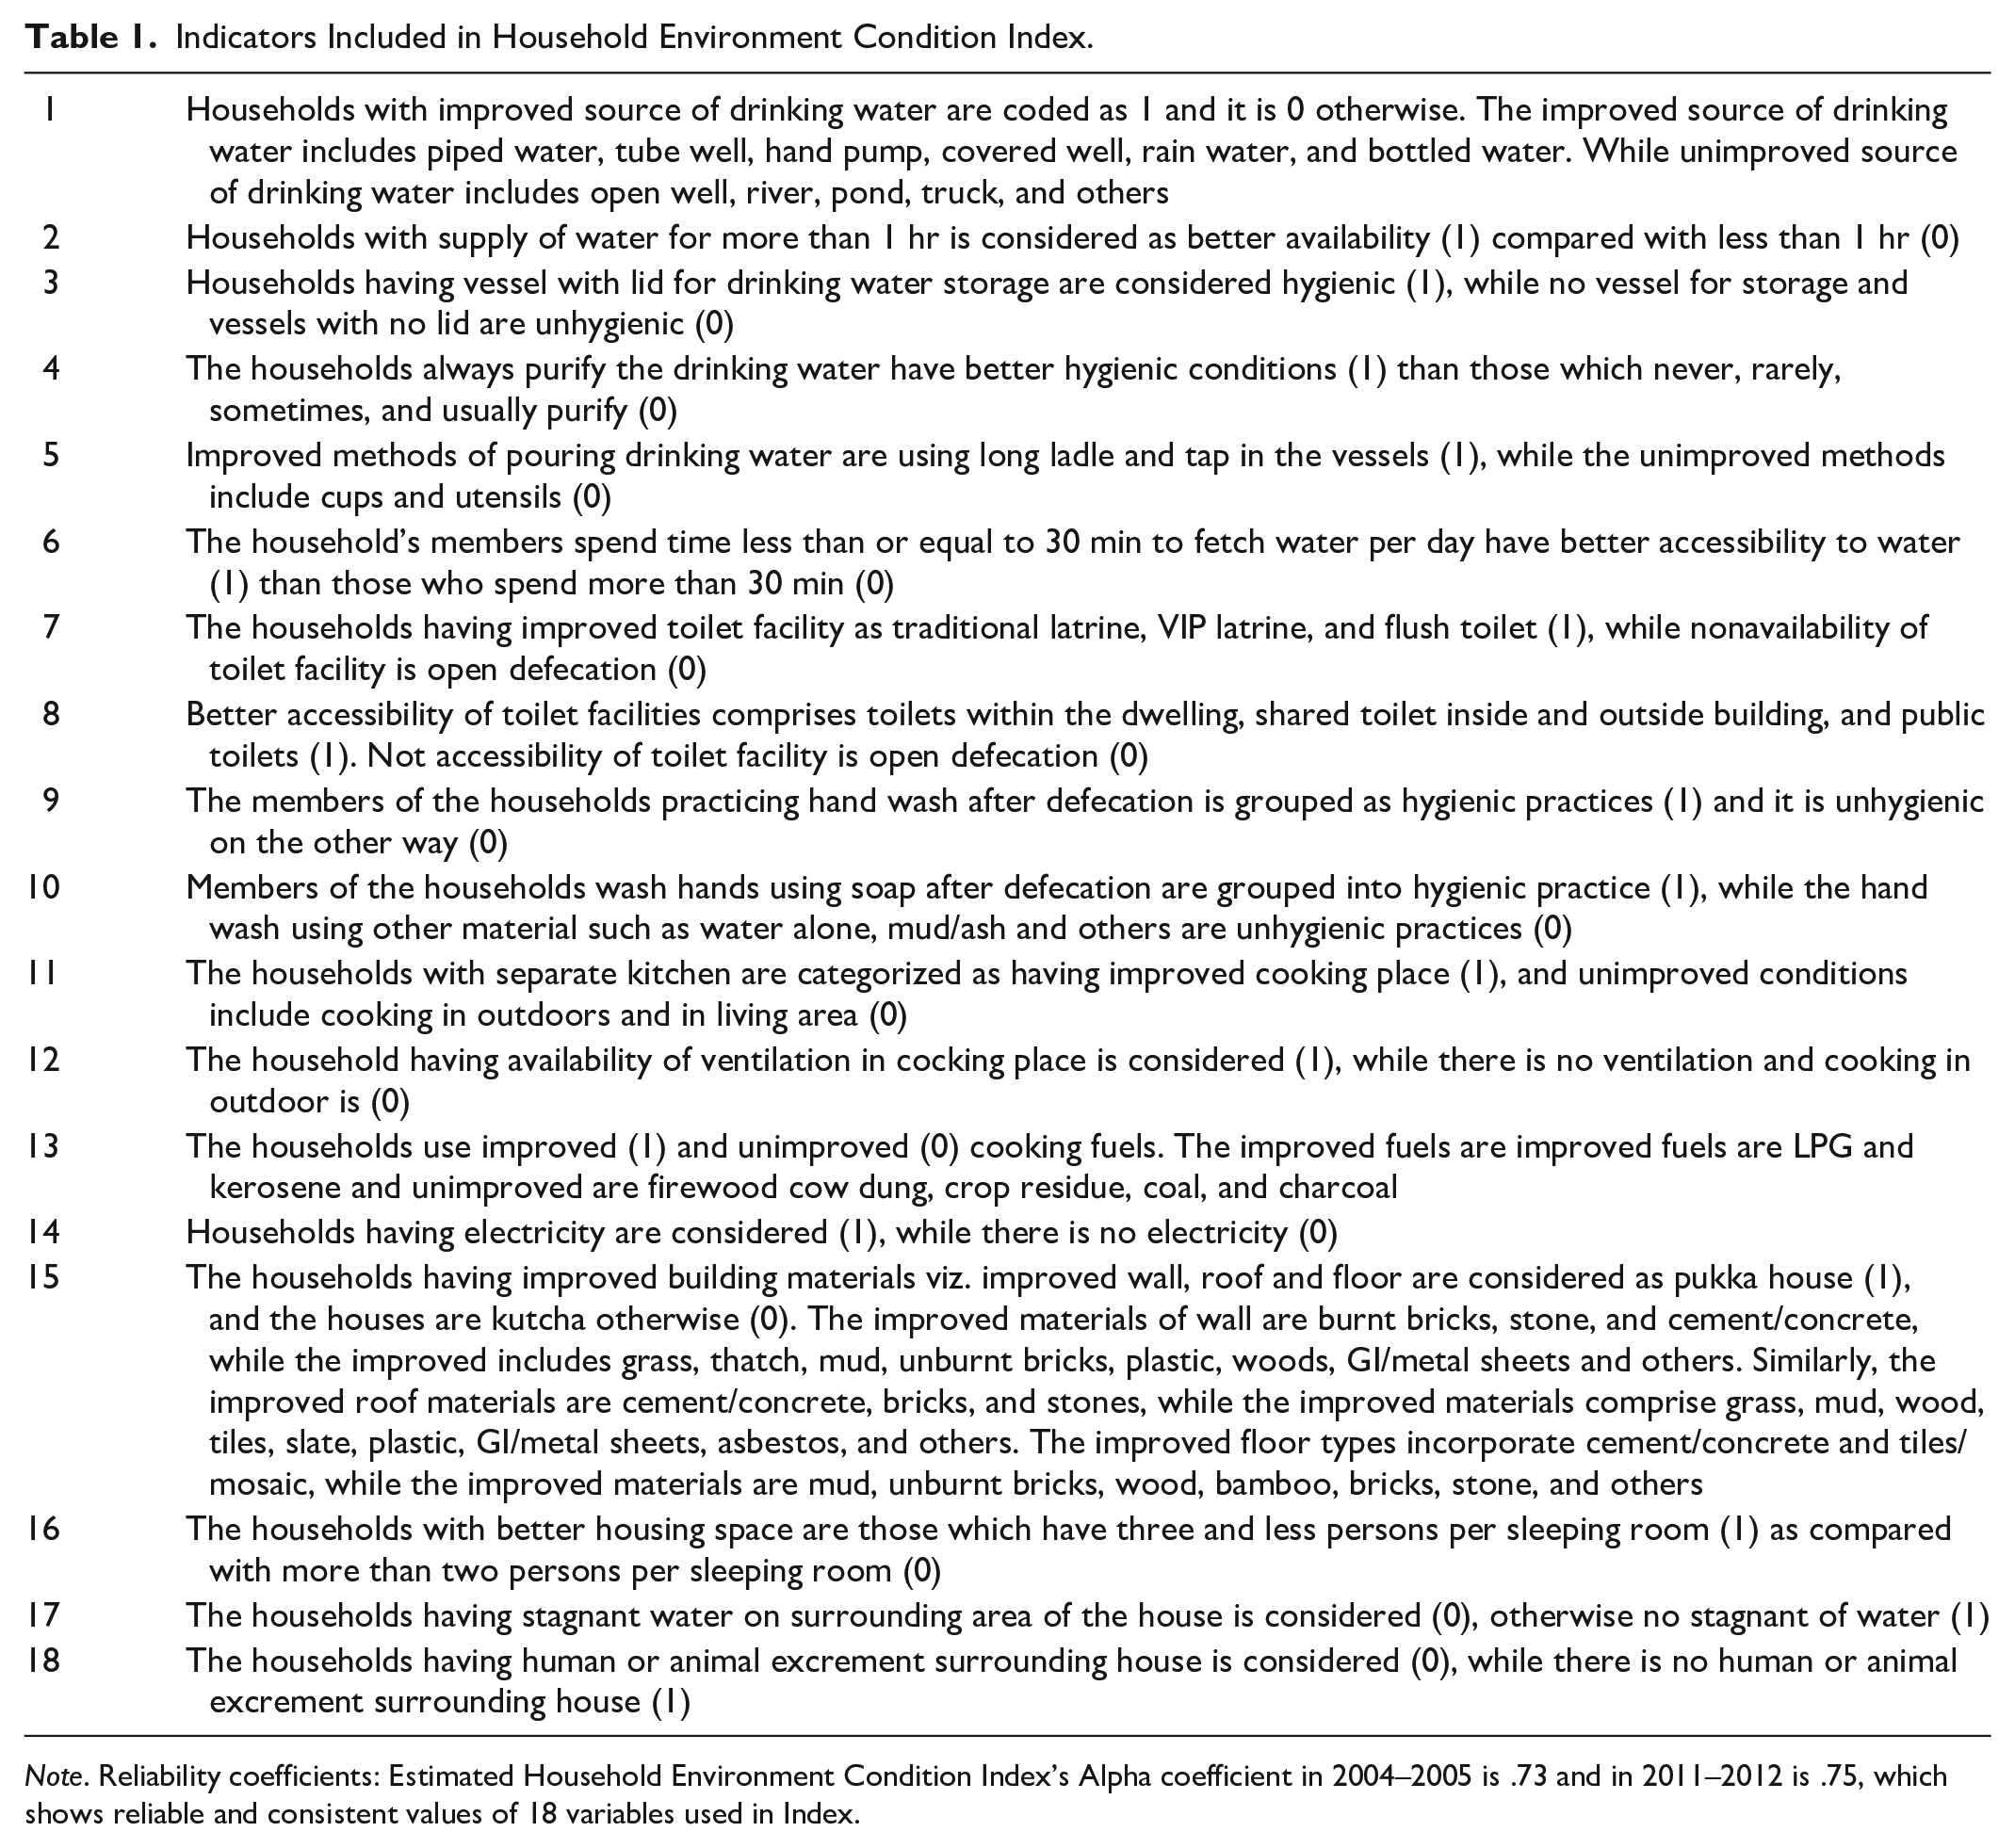
Note. Reliability coefficients: Estimated Household Environment Condition Index’s Alpha coefficient in 2004–2005 is .73 and in 2011–2012 is .75, which shows reliable and consistent values of 18 variables used in Index.
Predictor variables
The predictor variables include the place of residence (rural and urban), economic status (poor and nonpoor), occupational status (primary, secondary, tertiary, and no occupation), educational level of head of the household (illiterate, primary, secondary, and higher), and social group (General, OBC, SC, and ST). Religious groups (Hindu, Muslim, and Other [Christian, Sick, Jain, Buddhist, tribal, and others]) and regions (Northern, Central, Eastern, Northeast, Western, and Southern) are used as predictor variables. We used the National Sample Survey Organisation (NSSO) classification of states to form regions: (a) Northern region comprises states of Delhi, Haryana, Himachal Pradesh, Jammu & Kashmir, Punjab, Rajasthan, and Uttaranchal; (b) Central region include states like Chhattisgarh, Madhya Pradesh, and Uttar Pradesh; (c) Eastern region comprises states such as Bihar, Jharkhand, Orissa, and West Bengal; (d) Northeast includes states of Arunachal Pradesh, Assam, Manipur, Meghalaya, Mizoram, Nagaland, Sikkim, and Tripura; (e) Western region includes Goa, Gujarat, and Maharashtra; and (f) Southern region comprises states of Andhra Pradesh, Karnataka, Kerala, and Tamil Nadu.
Statistical analysis
To assess how many households fall into, remained living in the same condition, and moved out of poor HEC between 2004–2005 and 2011–2012, we have tabulated the transition matrixes, and the chi-square test has been used for testing the significance of the change in HEC by different socioeconomic characteristics of the households. Furthermore, to assess household socioeconomic factors contributing to change in HEC, the multinomial logistic regression and multiple correspondence analysis (MCA) conversion model were carried out because HEC is an outcome variable comprising four categories: (a) poor in 2005 and 2012, (b) poor in 2005 but nonpoor in 2012, (c) nonpoor in 2005 and poor in 2012, and (d) nonpoor in 2005 and 2012. Place of residence, economic status, occupational status, educational level, social group, religious group, and regions are used as predictor variables. We have converted the results of regression coefficients into an adjusted percentage for ease of interpretation. All the analyses in this study were conducted by using STATA 13.1 version.
Results
Transition in HEC Across Socioeconomic Categories
Change in HEC by place of residence and occupation
Table 2 shows the transition in HEC from 2004–2005 to 2011–2012 by rural–urban areas and occupational categories of the households. From the results, it is evident that seven of 10 rural households (70%) remained in poor HEC in 2004–2005 and 2011–2012, whereas the rest (30.4%: 26.1% to middle and 4.3% to better off) moved out of poor HEC. On the contrary, 6.4% of households those in the better-off condition in 2004–2005 turned into poor. Among the households who were having middle HEC in 2004–2005, 32.4% turned into poor in 2011–2012. In urban areas, almost half of households (48.8%) remained poor HEC in 2004–2005 and 2011–2012, whereas the remaining half moved out of poor condition (51.2%: 39% to middle and 12.2% to better off). Only 2% of the better-off households in 2004–2005 experienced demotion to poor HEC in 2011–2012. In the same period, 16.5% of the households moved out of middle HEC and entered into poor HEC. The chi-square test shows (Pr < .0001) changes in HEC are statistically significant for both rural and urban areas. Relative to urban, rural households continued to have remained more in poor HEC and also experienced less upward movement from the middle to better-off HEC. This may be due to relatively lower educational levels, economic opportunities, and awareness about HEC in rural households compared with their urban counterparts.
Change in HEC From 2004–2005 to 2011–2012 in Different Socioeconomic Characteristics.

Note. HEC = household environment condition; OBC = Other Backward Caste; SC = Scheduled Caste; ST = Scheduled Tribe.
The results demonstrate that a greater share of households that remained living in poor HEC during 2004–2005 to 2011–2012 was from primary occupations (68.3%) compared with their tertiary (57.5%) counterparts. Nearly less than half of the tertiary occupation households have moved out of poor HEC during 2004–2005 to 2011–2012 (42.5%: 33.9% to middle and 8.6% to better-off condition) compared with primary occupation households (31.8%: 27.1% to middle and 4.7% to better off). A slightly higher proportion of households from primary (5.2%) occupation moved to poor HEC situation in 2011–2012 from a better-off position in 2004–2005 in comparison with their tertiary counterparts (2.1%). In the same period, a higher proportion of households from primary occupation (31.4%) became worse off by moving out from middle condition to joining in poor HEC compared with households from tertiary occupation (20.8%). The results of this study are in line with earlier findings. Previous studies have shown that occupational structure is often correlated with economic status. Therefore, the occupation of the households is affecting HEC through poverty (Krishna, 2003; Krishna & Shariff, 2011). A greater number of people in India are involved in the primary sector relative to the tertiary sector. Furthermore, in the primary sector, a higher proportion of households are involved in farming and as daily wage laborers, and these households’ income continues to be small and unstable (Desai et al., 2010). A more recent study also shows that households who engaged in farming and daily wage work have a greater likelihood to remain in chronic poverty, whereas a greater number of households who switched their occupation from farming to the service sector have escaped poverty (Khosla & Jena, 2020). Other recent studies globally and in India, in the urban context, have also noted that the households from tertiary occupations with higher income and economically well off have better availability housing, access to water, sanitation facilities, and hygiene and able to cope up with the inflation in prices (Bangura & Lee, 2019a, 2019b, 2020; Saroj et al., 2020).
Change in HEC by education and economic status
The results from Table 2 shows that compared with households with educated head (58.9%), a higher share of households with illiterate head (69.4%) continue to have remained in the poor HEC category in 2004–2005 and 2011–2012, whereas movement out of poor HEC condition from 2004–2005 to middle and better-off condition in 2011–2012 was lower among the households where the head of the household is illiterate (30.6%: 26.2% to middle and 4.4% to better off) compared with their counterparts in the form of higher educated head of the households (41%: 32.1% to middle and 8.9% to better off). Compared with 2004–2005, in 2011–2012 a higher percentage (6%) of households with an illiterate head of the households became worse by moving out from better-off condition to poor condition compared with their counterparts (i.e., those living with the higher educated head of the households [1.1%]). Households moving out of middle HEC in 2004–2005 to poor condition in 2011–2012 was higher among the illiterate head of the households (31.8%) compared with the higher educated head of the households (18.5%). The results show that a higher percentage of illiterate households and the least percent of the higher educated households moved into the poor condition from the middle HEC. Chi-square statistic (Pr < .0001) shows changes across all educational categories are statistically significant.
The changes in HECs from 2005 to 2011 by the economic status of the households are graphically shown in Figure 1. The higher percent of economically poor households had remained living in poor HEC (75.8%) during 2004–2005 to 2011–2012 compared with economically well-off households (62.8%). Lower percent of economically poor households (24.2%: 21.6% to middle and 2.6% to better off) moved out from worse HEC condition in 2004–2005 to middle and better-off condition in 2011–2012 compared with economically well-off households (37.2%: 30.7% to middle and 6.5% to better off). During 2004–2005 to 2011–2012, a higher proportion of economically poor households (7%) than the economically well-off households (3.6%) became worse by moving out from better-off conditions to poor HEC. In the same period, again higher proportion of economically poor households (40%) than the economically well-off households (26%) moved into poor HEC from the middle HEC. This indicates that compared with nonpoor households, a higher percentage of the poor households moved into the poor HEC from better off and middle HEC (Table 2).
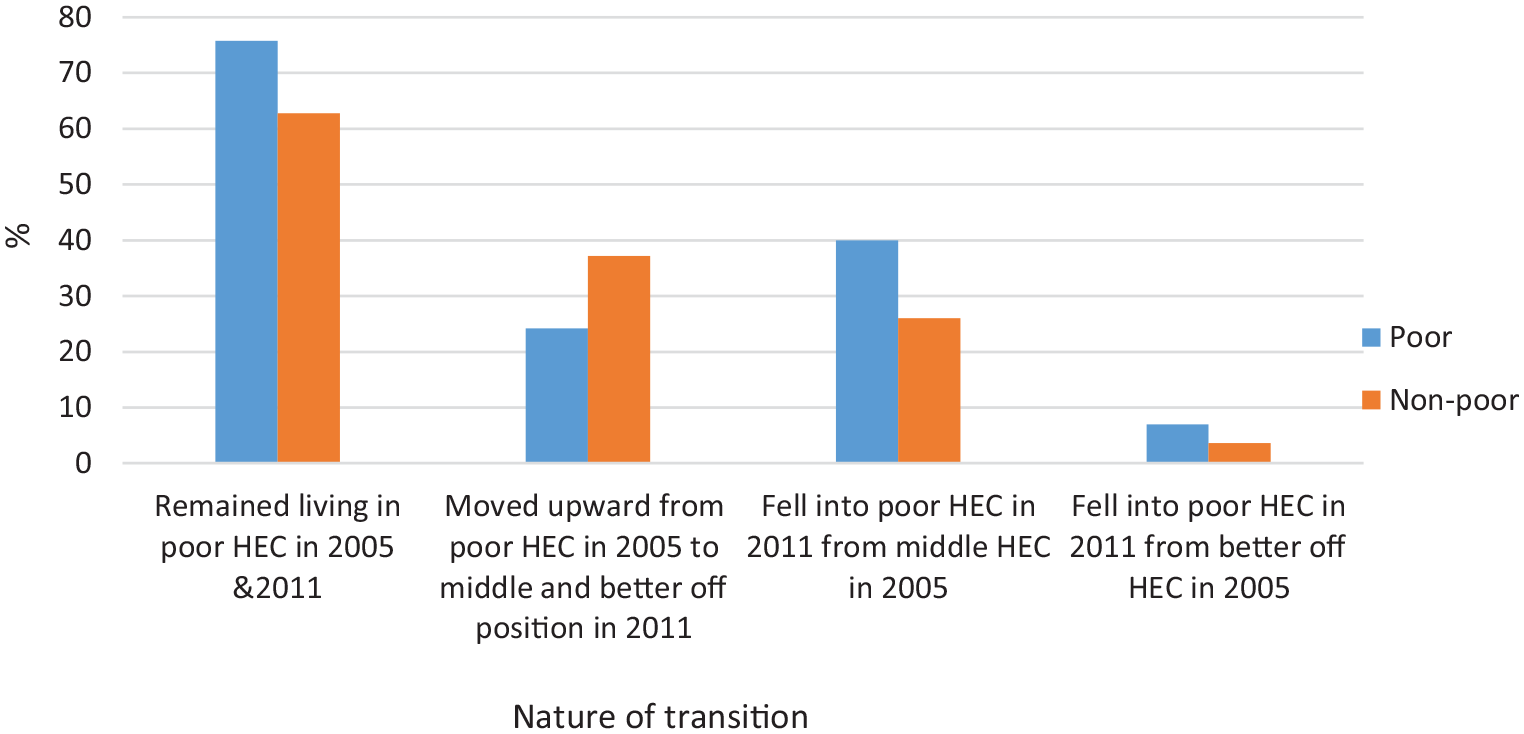
Transition pattern in HEC during 2005 to 2011 by the economic status of households.
The results of this study are in tune with previous literature that found that there is a lack of income diversification among the economically poor households as a result of low levels of switching from farm sector and wage laborers to service sector such as business, formal sector. Also, lack of remittance from migration and poor social capital is associated with a higher probability of remaining in poverty and fall into poverty (Khosla & Jena, 2020; World Bank, 2000). Therefore, a greater proportion of economically poor households have a lack of pucca houses and poor accessibility of water and sanitation and hygiene facility, which makes them stay in poor HEC and fall into poor HEC. Income diversification and social capital indirectly help in moving out of poor HEC and reduce the chance of falling into worse-off HEC (Saroj et al., 2020).
Change in HEC by social group and religion
HEC varies significantly across social groups and religious categories of households (Table 2). The changes in HECs from 2005 to 2011 by social groups are graphically shown in Figure 2. It shows that compared with General Castes (53%), a higher percent of ST (81%), SC (69.9%), and OBC (66.8%) households were continued to be in poor HEC during 2004–2005 to 2011–2012. Compared with General Castes (47%: 36.7% to middle + 10.3% to better off), moving into middle and better-off HEC in 2011–2012 from the poor condition in 2004–2005 was lower in SC (19%: 17.5% to middle and 1.5% to better off), ST (30.2%: 26.5% to middle and 3.7% better off), and OBC households (33.2%:27.9% to middle + 5.3% to better off). Compared with 2004–2005, in 2011–2012 slightly higher share of SC households (6.9%), ST (6.2%), and OBC (4.2%) moved into the poor condition from better-off HEC relative to General Caste households (2.7%). In the same period, and again larger percentage of ST households (39.6%), followed by SC (32.4%) and OBC (30.6%) households, fell into the poor condition from middle condition compared with General Castes (20.7%). Chi-square statistic (Pr < .0001) shows that the changes in HEC across all social group categories are statistically significant. The historic deprivation, social prohibitions, and sustained marginalization are still felt by disadvantaged social group groups in the country. A large percentage of SC and ST households were continued to be in poor HEC over a period of time and less percentage of these households were moved into middle and better-off HEC compared with OBC and General Castes. This is maybe due to a lack of economic opportunities, educational facilities, and awareness about HEC among SCs and STs compared with OBCs and higher Castes (Kumar et al., 2020).

Transition pattern in HEC during 2005 to 2011 by social groups.
By religion, the results show that consistently poor HEC was higher among the Hindu (68.5%) households compared with Muslim households (59%) during 2004–2005 to 2011–2012. The lower percentage of Hindu households moved from poor condition in 2004–2005 to middle and better off in 2011–2012 (31.5%: 26.5% to middle and 5.0% to better off condition) relative to Muslim households (41.1%: 35.1% to middle and 6% to better off). A slightly higher percentage of Hindu (4.6%) households became worse off in 2011–2012 by moving out of better-off conditions compared with their Muslim (3.6%) counterparts. In the same period, out of middle HEC, the higher percentage of Hindu (30.6%) households compared with Muslim (23.5%) fell into poor condition. These findings are in tune with previous studies (Kumar et al., 2020).
Change in HEC by regions
Global and local evidence suggests that investing access to housing and HEC at the regional level is key for designing regionally balanced policies (Bangura & Lee, 2019a, 2019b, 2020; Saroj et al., 2020). In this section, we have assessed changes in HEC by region. At the all-India level, 67.6% of households who were having poor HEC in 2004–2005 continued to be in poor condition in 2011–2012, whereas the remaining of one third of households (32.5%:27.4% to middle and 5.1% to better off) moved out of poor condition to middle and better-off condition. However, 3.9% of households became worse by moving out of better-off HEC in 2004–2005 to poor HEC in 2011–2012. In the same period, 28.8% of the household moved into poor condition from middle HEC. Moreover, HEC varies significantly across the regions in India (Table 2). Results show that slightly more than four fifths of households from the Central region (81.9%) were continued to be in poor HEC from 2004–2005 to 2011–2012 and it is the highest among all the regions, followed by the households from Eastern (77.1%), Northern (61.4%), and Southern (52.0%) regions. In the same period, Northeast (20.5%) and Western (44.6%) regions showed the least percent of households remained in the poor HEC. The upward movement of the households from poor HEC in 2004–2005 to a middle and better-off condition in 2011–2012 was experienced the least in the Central region (18.1%: 16.4% to middle and 1.7% to better off) and Eastern (22.9%: 20.4% to middle and 2.5% to better off) in comparison with the household from Northeast (79.5%:66.9% to middle and 12.6% better off) and Western (55.5: 45.2% to middle and 10.3% to better off) regions. A slightly higher percentage of households from Eastern (4.7%) and Northern (4.5%) fell into poor HEC in 2011–2012 by moving out from better-off condition in comparison with the household from Western (2.3%) and Northeast (3.7%). During the same period, a higher percentage of households in Central (46.4%) and Eastern (35.0%) regions became worse by moving out from middle condition to a poor condition compared with other regions such as Northeast (13.6%), Northern (20.3%), Western (20.8%), and Southern (27.5%) regions. Chi-square statistic (Pr < .0001) shows changes across the regions in India statistically significant.
The Central and Eastern regions are the least developed regions except for West Bengal in comparison with other regions and thus continue to be in poor HECs or falling more into poor HECs. The Central and Eastern regions have poor socioeconomic status compared with the national level as demonstrated by Desai et al.’s (2010) estimation using the IHDS data. For instance, household per capita consumption expenditure (using as a proxy for per capita income of population) of the Central (Rs. 19,174) and Eastern regions (Rs. 17,845) stands below the national average per capita income (Rs. 24,715) and lower than the other regions. Similarly, the poverty ratio of Central (23.9%) and Eastern regions (27.3%) is higher than the National average (18.7%) and other regions (Desai et al., 2010). Likewise, the household head education is one of the most important predictors of the better-off HEC such as good hygiene practices, use of improved toilet facilities, and having a better house. The percentage of the households with an educated head of the households in the central region (32.4%) is lower than the national level (37.3%) as well as other regions. On the contrary, the Northeast region with a lower population has a better socioeconomic condition in comparison with other regions as well as the national average, and thus has a better-off HEC. This region also experienced a greater proportion of households moved out from poor to better-off HECs. The female literacy rate, education household head, and per capita income of the Northeast region are higher than the national level (37.3%) as well as other regions (Singh et al., 2017). The poverty of this region is lower (16.5%) than the national average (18.7%; Desai et al., 2010).
Change in HEC Condition by Major States
Appendix Table A1 shows the change in HEC from 2004–2005 to 2011–2012 across the major states of India. The changes in HEC vary substantially across the states of India. States where a higher proportion of households remained in poor HEC during 2004–2005 to 2011–2012 include Madhya Pradesh (85.4%), Bihar (82.7%), Orissa (82.2%), Uttar Pradesh (82.5), Jharkhand (81.3%), Rajasthan (78.8%), and Chhattisgarh (73.1%). On the contrary, during the same period, states such as Kerala (12.5%), Himachal Pradesh (14.3%), Tripura (17.2%), Assam (26.5%), Punjab (27.2%), and Jammu & Kashmir (30.3%) had a lower proportion of households in poor HEC.
States where households experienced greater upward movement from poor HEC in 2004–2005 to middle or better-off condition in 2011–2012 are Kerala (87.5%:50.0% to middle + 37.5% to better off), Himachal Pradesh (85.7%:61.5% middle and 24.2% to better off), Tripura (82.7%:58.6% to middle and 24.1% to better off), Assam (73.5%:67.4% to middle and 6.1% to better off), Punjab (72.8%:57.9% to middle and 14.9% to better off), and Jammu & Kashmir (69.7%: 44.7% middle and 25.0% to better off). In the same period, those states that had experienced the least upward movement from poor HEC in 2004–2005 to middle and better-off conditions are Madhya Pradesh (14.6%:13.5% to middle and 1.1% to better off), Bihar (17.4%: 16.3% to middle and 1.1% better off), Uttar Pradesh (17.5%: 16.0% to middle and 1.5% to better off), Orissa (17.8%: 15.5% to middle and 2.3% to better off), Jharkhand (18.6%:16.4% to middle and 2.2% to better off), Rajasthan (21.7%:18.8% middle and 2.9% to better off), and Chhattisgarh (26.9%:23.8% to middle and 3.1% to better off).
On the contrary, the states that had experienced higher downward movement from better-off HEC in 2004–2005 to poor HEC in 2011–2012 are Haryana (10.3%), Rajasthan (8.7%), Madhya Pradesh (7.3%), Assam (6.1%), and Tamil Nadu (5.6%). In the same period, the states that had experienced the least downward movement from better-off conditions to poor conditions are Jammu & Kashmir (0.6%), Himachal Pradesh (0.6%), Chhattisgarh (1.1%), Tripura (1.3%), and Kerala (1.6%). Likewise, states where households experienced higher downward movement from middle in 2004–2005 to poor household environment in 2011–2012 are Madhya Pradesh (53.8%), Jharkhand (50.4%), Chhattisgarh (45.3%), Bihar (44.0%), Uttar Pradesh (40.8%), Rajasthan (39.9%) and Orissa (38.5%). Again in the same period, states, where households experienced the least downward movement from the middle to poor conditions are Kerala (4.8%), Tripura (6.1%), Himachal Pradesh (9.8%), Jammu & Kashmir (13.3%), Punjab (15.4%), Haryana (18.2%), and Uttaranchal (18.5%).
Determinants of Transition in HEC
Table 3 presents the estimates of the transition in HEC by select predictors using the multinomial logistic regression estimates. Furthermore, using the MCA conversion model, coefficients have been converted to the adjusted percentages for ease of interpretation. In terms of households that showed a better-off HEC in both periods, 2004–2005 and 2011–2012, we observed significant differences by place of residence (Rural and Urban areas) and religion (Hindu and Muslim categories). For instance, the prevalence of better-off HECs is significantly higher among urban households (83.8%: p < .01) compared with rural households (44.0%). Similarly, the households belonging to the Muslim religion are more likely to have better-off HEC (61.6: p < .01) than the Hindu counterparts (53%). A recent study by Coffey and Spears (2017) observed that, in rural India, the open defecation is lower among Muslim households—both in rich and poor economic status households than Hindu households. They also found that Hindu households living in the proximity of Muslim households have lower infant mortality due to less open defecation and more use of latrines among Muslim neighborhoods. Moreover, economically well-off households are more likely to have better-off HEC (62.7%: p < .01) than economically poor households (31.1%). Furthermore, the better-off HEC remained positively associated with the educated head of the households and the kind of occupation performed by the head of the households in both 2004–2005 and 2011–2012. For instance, the higher educated head of the households was more likely to have better-off HEC (91.5%: p < .01) compared with illiterate household heads (45.4%). Likewise, the head of the household engaged in tertiary occupation was more likely to have better-off HEC (80%: p < .01) than primary occupation households (47.9%). Similarly, socioeconomically underprivileged group ST (28.6%: p < .01), SC (43.9%: p < .01), and OBC (53.5%: p < .01) were less likely to have better-off HEC compared with the socioeconomically privileged General Caste households (74.6%). When it comes to regional comparison of the households, the household from the northeastern region (83.2%: p < .01) was more likely to have a better-off HEC than households from the Northern region (70%).
Multinomial Logistic Regression Analysis: Adjusted Percentage of Change in Household Environment Conditions by Socioeconomic Factors in India.

Note. RC = reference category; SE = standard error; OBC = Other Backward Caste; SC = Scheduled Caste; ST = Scheduled Tribe; LR = likelihood ratio.
p < .10. **p < .05. ***p < .001.
The persistent poor HEC in both periods (2004–2005 and 2011–2012) were more likely for the rural (29.7%), socioeconomically underprivileged groups such as ST (48.6%), SC (30.1%), and OBC (23%); illiterate households (29%); and households in primary occupation (26.9%) compared with their counterparts in urban (5.3%), higher educated (2.8%), socioeconomically privileged groups General Caste (9.3%) households, and households in tertiary occupation (8%). Although the country observed higher economic growth during the period from 2004–2005 to 2011–2012 (Coffey & Spears, 2017), not only the economic inequality but also inequality in access to basic amenities such as a good house, water, and sanitation facilities is persistent across vulnerable socioeconomic groups. Thus, our results are consistent with previous findings. Social prohibition and continuous marginalization are still felt by disadvantaged social groups such as ST and SC compared with their counterparts in General Castes. The previous studies have shown that persistent higher poverty leads households to fall into poor HEC and such trends are observed more among STs and SCs in comparison with General Castes (Dhamija & Bhide, 2013; Mehta & Bhide, 2003; Thorat et al., 2017).
Although the government targeted to build a pucca house and latrine at subsidized rate, especially for SC and ST households, they are failing to procure sufficient incomes to cover the remaining cost of house and sanitation amenities, which forces these underprivileged groups to remain in poor HEC (O’Reilly et al., 2017). When it comes to regional comparison of the households, the household from central (42%) and Eastern regions (36%) are more likely to stand in poor HEC than the northern region households (12.8%). From an economic perspective, economically poor households are more likely to have poor HEC (42%) than economically better-off households (17%).
In contrast to bivariate estimates, the adjusted estimates suggest that the improvement of HEC from poor in 2004–2005 to nonpoor HEC in 2011–2012 has been less likely in the urban areas (5.5%: p < .01), tertiary occupation (5.9%: p < .01), economically better-off households (10.1%: p < .01), and households with an educated head (5.4%: p < .01) relative to their counterparts from rural (13%) areas, primary occupation (12.5%), economically poor (13.4%), and illiterate households (12.8%). In contrast to bivariate estimates, in the same period, the improvement of HEC has been more likely among socioeconomically underprivileged social groups such as ST (11.4%: p < .01), SC (13%: p < .01), and OBC (11.4%: p < .01) in comparison with the socioeconomically privileged group such as General Caste (8.3%). The mobility has been more likely among the households from Western (15.3%: p < .01), Southern (12.8%: p < .01), and Eastern (10.9%: p < .01) compared with households from the Northern region (8%). This could be because the better-off socioeconomic groups have less scope for improvement compared with their counterparts as they have higher HEC in the initial period. Surprisingly, the least developed Central region has not observed a greater change in HEC from poor to nonpoor although it has more scope to improve due to the high prevalence of poor HEC compared with other regions at the base period. This is due to poor policy implementation in the Central region as compared with other regions. On the contrary, similar to bivariate estimates, the deterioration of HEC from nonpoor in 2004–2005 to poor in 2011–2012 has been less likely among the urban (5.5%: p < .01), tertiary occupation (6.4%: p < .01), economically better off (10.3 %: p < .01), and educated head of the households (3.6%: p < .01) compared with their counterparts such as rural (13.2%), primary occupation (12.6%), economically poor (13.3%), and illiterate households (12.7%). In the same period, the deterioration of HEC was more likely among socioeconomically underprivileged social groups, ST (11.4%, p < .01), SC (13%: p < .01), and OBC (12%: p < .01), relative to the socioeconomically privileged group, General Caste (7.8%). Likewise, it has been more likely among the households from Central (15.1%: p < .01) and Eastern region (10.8%: p < .01 in comparison with Northern region households (9%).
Discussion and Conclusion
This study assessed the movement of households into and out of poor HEC and those remaining in poor HEC by analyzing socioeconomic factors associated with such changes using panel data. Findings advance three significant messages: First, the higher percentage of socially deprived groups (ST, SC, and OBC) continued to be in poor HEC during 2004–2005 to 2011–2012 compared with the privileged Caste groups such as General Castes. After controlling for other factors, multivariate logistic regression results show that the share of households moved out from poor HEC to better-off HEC was more in deprived social groups compared with their counterparts. This is mainly because there are greater proportions of households in deprived social groups under poor HEC in the base year (2004–2005). Therefore, their share is more among those moved out of poor HEC. During the 2005–2011 period, numerous government programs, namely, National Rural Drinking Water Program, Total Sanitation Program, Household Clean Energy Program, and National Rural Health Mission were implemented under United Progressive Alliance (UPA) government. Therefore, these schemes might have played a critical role in the mobility of socially deprived classes, illiterate, and poor households from poor HEC in 2005 to nonpoor HEC in 2011–2012.
Second, despite a section of households moved from poor HEC to better-off HEC, many of these socially deprived classes remain in poor HECs. The access of the pucca house improved water and sanitation facilities remained low among the ST, SC, and OBC compared with General Caste. In addition, a higher percentage of SC, ST, and OBC households fell into the poor HEC in 2011–2012 from the better-off and middle condition in 2004–2005 in comparison with General Caste households after adjusting for other factors. These findings suggest that poor socioeconomic groups are more vulnerable to instabilities in household income and livelihoods. This indicates that the sheer establishment of basic services such as access to water and sanitation facilities is not sufficient; rather, ensuring the sustainability of those services is more important. Although the country observed the higher economic growth during the period 2004–2005 to 2011–2012, the economic growth has not percolated and passed into income stability for socioeconomically underprivileged groups such as ST, SC, and OBC compared with General Caste. Despite the efforts by the government to provide improved sanitation facilities and cooking fuel (LPG and Kerosene) at subsidized rates to poor SC and ST households, they are still not able to manage the resources to cover the cost of house construction and to build toilets—keeping them in poor HEC. The other possible reasons for better-off and middle HEC households slipping into poor HEC are due to the poor performance in the accessibility of facilities. Although the better-quality source of drinking water and sanitation amenities are better in 2011–2012 relative to 2004–2005 across all social groups and regions, the corresponding improvement was not there in the accessibility to facilities. The accessibility to the key services like improved drinking water and sanitation found either no growth or negative growth in the considerable number of households across all social groups and regions; thus, the overall performance was also found negative in some categories of households. In addition, there is persistent inequality in access to basic amenities across different social groups (Bonu & Kim, 2009; Kumar, 2014; Saroj et al., 2020). The higher poverty and catastrophic health expenditure due to disease burden had pushed them into poor HEC (Garg & Karan, 2008; Ghosh, 2011; Goli et al., 2016).
Third, despite lower mobility from 2004–2005 to 2011–2012, a majority of the socioeconomically well off (General Castes and richer and richest wealth quintile) and higher educated households remained in better-off HEC in 2011–2012. However, it is surprising to find that HEC in households of Hindu religion poorer than the other religion Muslim. The previous evidence suggests that although the government provided the sanitation facilities, the usage of that facilities initially was okay, but in the later period, they practiced open defecation due to purity and pollution concept attached to religious practices in Hindus when toilets were built within the households. Also, the low quality of latrines built by the government could be another reason (Coffey & Spears, 2017).
Despite the government’s flagship programs in place during 2005–2011, they were not fully successful due to poor operation and maintenance of the schemes, often making them nonfunctional. Owing to the findings of this study, we advance that the current programs, namely, “Swatch Bharat Abhiyan” (Clean India Mission) and “Housing for All by 2020”—launched in 2014 and 2016, respectively, by the Government of India, should focus more among socially deprived groups, illiterate, economically poor, and primary occupation households whose HEC is poor compared with their counterparts. The higher proportion of poor HEC households in states like Madhya Pradesh, Bihar, Orissa, Uttar Pradesh, Jharkhand, Rajasthan, and Chhattisgarh and in Central and Eastern regions need special focus under programs such as “Swatch Bharat Abhiyan” and “Housing for All by 2020,” with greater financial support in place. Findings also suggest that there is a need for a comprehensive and integrated approach to improve HECs. Affordable housing is key to achieve better-off HEC. For instance, without access to the pucca house, it is hard to ensure the availability and accessibility of safe drinking water, sanitation facility, and cooking fuel within the premise. Furthermore, without access to water, it is difficult to ensure a modern sanitation facility within the premises. Moreover, ensuring the sustainability of the services is critical along with its provision. The government also needs to promote behavioral changes to bring transformation in the usage of sanitation facilities.
Footnotes
Appendix
Change in HEC From 2004–2005 to 2011–2012 in Major States in India.

| States | HEC 2011–2012 | ||||
|---|---|---|---|---|---|
| HEC 2004–2005 | Poor | Middle | Better off | Total sample (N) | |
| Jammu & Kashmir | Poor | 30.3 | 44.7 | 25.0 | 76 |
| Middle | 13.3 | 46.3 | 40.4 | 270 | |
| Better off | 0.6 | 16.9 | 82.6 | 350 | |
| Total | 8.8 | 31.3 | 59.9 | 696 | |
| χ2 test value = 183.1, Pr = .000 | |||||
| Himachal Pradesh | Poor | 14.3 | 61.5 | 24.2 | 182 |
| Middle | 9.8 | 51.5 | 38.7 | 749 | |
| Better off | 0.6 | 19.2 | 80.3 | 532 | |
| Total | 7.0 | 41.0 | 52.0 | 1,463 | |
| χ2 test value = 288.6, Pr = .000 | |||||
| Punjab | Poor | 27.2 | 57.9 | 14.9 | 114 |
| Middle | 15.4 | 47.8 | 36.8 | 500 | |
| Better off | 1.5 | 14.9 | 83.6 | 1,059 | |
| Total | 7.4 | 27.7 | 64.9 | 1,673 | |
| χ2 test value = 487.6, Pr = .000 | |||||
| Uttaranchal | Poor | 51.8 | 37.7 | 10.6 | 85 |
| Middle | 18.5 | 55.1 | 26.4 | 216 | |
| Better off | 1.2 | 19.8 | 79.0 | 167 | |
| Total | 18.4 | 39.3 | 42.3 | 468 | |
| χ2 test value = 194.7813, Pr = .000 | |||||
| Haryana | Poor | 48.6 | 40.3 | 11.1 | 288 |
| Middle | 18.2 | 52.2 | 29.6 | 659 | |
| Better off | 10.3 | 32.2 | 57.6 | 808 | |
| Total | 19.5 | 41.0 | 39.4 | 1,755 | |
| χ2 test value = 338.1930, Pr = .000 | |||||
| Delhi | Poor | 42.1 | 47.4 | 10.5 | 19 |
| Middle | 25.3 | 45.8 | 28.9 | 83 | |
| Better off | 2.8 | 24.6 | 72.6 | 387 | |
| Total | 8.2 | 29.0 | 62.8 | 489 | |
| χ2 test value = 112.2365, Pr = .000 | |||||
| Rajasthan | Poor | 78.3 | 18.8 | 2.9 | 1,164 |
| Middle | 39.9 | 39.5 | 20.7 | 687 | |
| Better off | 8.7 | 25.7 | 65.6 | 817 | |
| Total | 47.1 | 26.2 | 26.7 | 2,668 | |
| χ2 test value = 1,300, Pr = .000 | |||||
| Uttar Pradesh | Poor | 82.5 | 16.0 | 1.5 | 1,735 |
| Middle | 40.8 | 48.0 | 11.2 | 1,195 | |
| Better off | 3.4 | 33.3 | 63.3 | 802 | |
| Total | 52.1 | 30.0 | 17.9 | 3,732 | |
| χ2 test value = 2,200, Pr = .000 | |||||
| Bihar | Poor | 82.7 | 16.3 | 1.1 | 757 |
| Middle | 44.0 | 44.0 | 11.9 | 445 | |
| Better off | 5.3 | 32.7 | 62.0 | 324 | |
| Total | 55.0 | 27.9 | 17.2 | 1,526 | |
| χ2 test value = 844, Pr = .000 | |||||
| Tripura | Poor | 17.2 | 58.6 | 24.1 | 29 |
| Middle | 6.1 | 57.1 | 36.7 | 49 | |
| Better off | 1.3 | 20.8 | 77.9 | 77 | |
| Total | 5.8 | 39.4 | 54.8 | 155 | |
| χ2 test value = 38.1, Pr = .000 | |||||
| Assam | Poor | 26.5 | 67.4 | 6.1 | 98 |
| Middle | 20.3 | 57.6 | 22.2 | 311 | |
| Better off | 6.1 | 36.9 | 57.1 | 347 | |
| Total | 14.6 | 49.3 | 36.1 | 756 | |
| χ2 test value = 138.7, Pr = .000 | |||||
| West Bengal | Poor | 60.7 | 34.7 | 4.6 | 766 |
| Middle | 23.3 | 56.5 | 20.1 | 780 | |
| Better off | 4.3 | 26.5 | 69.2 | 845 | |
| Total | 28.6 | 38.9 | 32.5 | 2,391 | |
| χ2 test value = 1,100, Pr = .000 | |||||
| Jharkhand | Poor | 81.3 | 16.4 | 2.2 | 359 |
| Middle | 50.4 | 39.3 | 10.3 | 234 | |
| Better off | 4.3 | 31.3 | 64.5 | 211 | |
| Total | 52.1 | 27.0 | 20.9 | 804 | |
| χ2 test value = 445.2, Pr = .000 | |||||
| Orissa | Poor | 82.2 | 15.5 | 2.3 | 1,312 |
| Middle | 38.5 | 40.3 | 21.3 | 395 | |
| Better off | 5.4 | 20.5 | 74.2 | 298 | |
| Total | 62.2 | 21.1 | 16.7 | 2,005 | |
| χ2 test value = 1,100, Pr = .000 | |||||
| Chhattisgarh | Poor | 73.1 | 23.8 | 3.1 | 765 |
| Middle | 45.3 | 41.6 | 13.1 | 358 | |
| Better off | 1.1 | 9.1 | 89.8 | 187 | |
| Total | 55.2 | 26.6 | 18.2 | 1,310 | |
| χ2 test value = 830.5, Pr = .000 | |||||
| Madhya Pradesh | Poor | 85.4 | 13.5 | 1.1 | 1,683 |
| Middle | 53.8 | 34.7 | 11.5 | 955 | |
| Better off | 7.3 | 31.9 | 60.9 | 455 | |
| Total | 64.1 | 22.7 | 13.1 | 3,093 | |
| χ2 test value = 1,500, Pr = .000 | |||||
| Gujarat | Poor | 58.9 | 36.5 | 4.6 | 370 |
| Middle | 23.2 | 51.6 | 25.2 | 568 | |
| Better off | 2.5 | 28.4 | 69.1 | 786 | |
| Total | 21.5 | 37.8 | 40.8 | 1,724 | |
| χ2 test value = 728.1784, Pr = .000 | |||||
| Maharashtra | Poor | 39.8 | 48.0 | 12.2 | 1,075 |
| Middle | 20.0 | 44.9 | 35.1 | 1,256 | |
| Better off | 2.3 | 22.4 | 75.4 | 934 | |
| Total | 21.4 | 39.5 | 39.1 | 3,265 | |
| χ2 test value = 948.1, Pr = .000 | |||||
| Andhra Pradesh | Poor | 48.0 | 40.0 | 12.0 | 777 |
| Middle | 26.2 | 46.7 | 27.2 | 780 | |
| Better off | 4.3 | 25.4 | 70.3 | 418 | |
| Total | 30.1 | 39.5 | 30.3 | 1,975 | |
| χ2 test value = 519.8, Pr = .000 | |||||
| Karnataka | Poor | 56.1 | 38.1 | 5.8 | 1,128 |
| Middle | 29.8 | 50.0 | 20.2 | 1,594 | |
| Better off | 4.8 | 31.9 | 63.3 | 815 | |
| Total | 32.4 | 42.0 | 25.5 | 3,537 | |
| χ2 test value = 1,100, Pr = .000 | |||||
| Kerala | Poor | 12.5 | 50.0 | 37.5 | 8 |
| Middle | 4.8 | 34.0 | 61.2 | 147 | |
| Better off | 1.6 | 16.4 | 82.0 | 1,405 | |
| Total | 2.0 | 18.2 | 79.8 | 1,560 | |
| χ2 test value = 47.2, Pr = .000 | |||||
| Tamil Nadu | Poor | 49.5 | 42.3 | 8.2 | 489 |
| Middle | 28.5 | 49.3 | 22.3 | 791 | |
| Better off | 5.6 | 31.3 | 63.2 | 608 | |
| Total | 26.5 | 41.7 | 31.8 | 1,888 | |
| χ2 test value = 522.3, Pr = .000 | |||||
Note. HEC = household environment condition.
Declaration of Conflicting Interests
The author(s) declared no potential conflicts of interest with respect to the research, authorship, and/or publication of this article.
Funding
The author(s) received no financial support for the research, authorship, and/or publication of this article.
Ethical Approval
We used secondary data available from the two waves of the India Human Development Survey, 2004–2005 and 2011–2012. Thus, ethical approval doesn’t require for this study.