
Abstract
The purpose of this study is to examine gender difference in self-rated health among older population in India. Data from the 60th round of National Sample Survey Organization on 34,831 older persons are used. The present study measured self-rated health categorized as “poor” and “good.” We used bivariate and binary logistic regression model to investigate differences and factors that best explain and predict the self-rated health among older persons. Results show that poor self-rated health was more common among women than men. Furthermore, the poor self-rated health was higher among Muslims, Scheduled Castes, and women residing in rural areas. Findings suggest a clear need for gender-sensitive health interventions.
Introduction
India, like other countries in Asia, is experiencing rapid demographic transition, which has resulted in an increasingly aging population (Chaudhury, 2004; Mujahid, 2006; United Nations Population Division, 2006). Declining rates of fertility and mortality, and increasing life expectancy have been the leading determinants of population aging (Alam, 2006). A substantial growth in the number and proportion of older adults in the country estimated at an annual growth rate of 2.8% per annum during 1991 to 2001 compared with the growth rate of the general population at 2% per annum can be seen.
In 1961, the older population at age 60 and above was only 24 million; it increased to 43 million in 1981 and to 57 million in 1991. The 2001 census shows that the older population (age 60+) of India reached 77 million, and 100 million according to the 2011 census. The older population has increased fourfold during the last five decades. The United Nations statistical projection indicates that the size of India’s population aged 60 and above is expected to increase to 117 million in 2015, 193 million in 2030, and further to 335 million in 2050. The proportion is likely to reach 13% of the population in 2030 and 20% in 2050 (United Nations Population Division, 2006).
A growing aging population in any country carries great social, economic, and public health implications, which include higher expenditure on pension and health care, need for social security reforms, shrinking of workforce, and hence shortage of active persons who are able to support dependent older adults (Kalavar & Jamuna, 2011; Rajan, Mishra, & Sharma, 2001). The burden of morbidity and mortality in the population will also undergo change from burden profiles dominated by infectious diseases to those affected by chronic noncommunicable diseases (Omran, 1971). Moreover, the socioeconomic differentials in morbidity have become a growing concern among scholars and policy makers in developing countries like India (Case & Paxton, 2005; Hughes & Waite, 2002; Huisman, Kunst, & Mackenbach, 2003; Husain & Ghosh, 2011; Mostafa & van Ginneken, 2000).
The impact of socioeconomic factors on health has been investigated in many older populations. Studies conducted across various nations and populations acknowledged the inverse relationship between socioeconomic status (SES) and mortality, morbidity, and disability (Alam, 2006). Among the socioeconomic determinants, gender emerged as a key factor explaining the health status of older persons in developed and developing countries (Kalavar & Jamuna, 2011; McDonough & Walters, 2001; Roy & Chaudhuri, 2008). It has been observed in most societies across the globe that women have a longer life expectancy than men, yet women tend to report higher levels of depression, distress, and chronic illness (McDonough & Walters, 2001) and more functional limitations (Gorman & Read, 2006). Evidence suggests retirement, loss of partner, and economic hardship accounts for the rise in depression among older persons irrespective of age and sex, along with physical degeneration and the loss of personal control (Mirowsky & Ross, 1992). Furthermore, such losses probably will remain correlated with age, could be tempered through greater community, economic, and social involvement of older adults (Mirowsky & Ross, 1992).
The research interest in understanding gender differences in the health or self-rated health among older population can be traced to the long and well-documented research that highlighted sex differentials in child health and mortality in the entire South Asian region (Arokiasamy, 2004; Kishor, 1993). They have investigated individual-level (women’s education, autonomy, etc.), household-level (income, family resources, kinship structure, etc.), and community-level factors (health facilities, infrastructure, etc.) as possible determinants of gender discrimination. Gender discrimination appears in later life—Macintyre, Hunt, and Sweeting (1996) critically reviewed and concluded that the “whole topic warrants periodic re-examination” (p. 7), including systematic assessments across societies. They might be generalized at different stages of development and with different cultural attitudes toward appropriate gender roles. For instance, a good number of seminal reviews done by Idler and Benyamini (1997) have documented independent association of self-rated health with mortality, even after they controlled for a variety of indicators of health status, psychological functioning, and SES. Studies also found that participants who rate their health as poor have a 2 to 5 times higher risk of dying compared with persons reporting excellent or good health (DeSalvo, Bloser, Reynolds, He, & Munter, 2006; Idler & Benyamini, 1997). Evidences from different settings have shown higher rates of poor self-rated health and lower rates of excellent or good self-rated health in women, as compared with men (Benyamini, Blumstein, Lusky, & Modan, 2003; Idler, Russell, & Davis, 2000; Kowal et al., 2010; Phaswana-Mafuya et al., 2013).
Explanations for the differential health outcomes among older men and women often underscore socioeconomic inequality as a fundamental cause for variations in their well-being (Adler & Ostrove, 1999; Huisman et al., 2003; McDonough & Walters, 2001). The theory of “Fundamental Causes” developed by Link and Phelan (1995) established why the association between SES and mortality has persisted despite radical changes in the diseases and risk factors that are presumed to explain it. The theory proposed that the enduring association results because SES embodies an array of resources, includes economic resources, knowledge, power, and several beneficial social connections that protect health no matter what mechanisms are relevant at any given time, that has been supported by several studies (Phelan, Link, & Tehranifar, 2010).
Denton, Prus, and Walters (2004) provided a useful framework and suggested that health is affected by socioeconomic determinants such as education, income, and employment; behavioral determinants such as smoking, obesity, and physical inactivity; and psychosocial determinants such as critical life events, chronic stressors, and psychological resources. However, in this study, we focus on the socioeconomic determinants of the gender gap due to data constraints. This model offers a good starting point to understand the gender gap in perceived health. People with a higher SES tend to have lower morbidity and mortality and perceive being in better health than those with a low SES (Beckfield, 2004; Wilkinson & Marmot, 2003). The availability of resources explains the positive association between SES and good health suggesting that people with more socioeconomic resources, including higher education and higher incomes, are more likely to be in good health. Women are less likely to be employed and are more likely to have lower incomes and do more domestic labor than men (Denton et al., 2004; Lu, 2006). Access to goods and resources is likely to result in different health outcomes for men and women (Bird & Rieker, 1999). Arber and Cooper (1999) indicated that women’s health is put at a disadvantage, because they have less access to material and social resources that foster good health.
As gender is a measure of biological/genetic and social differences, it is likely that the health inequalities between men and women reflect sex-related biological and social factors, and the interplay between them (Bird & Rieker, 1999). In terms of social factors, researchers pose two general hypotheses to account for gender-based inequalities in health. The differential exposure hypothesis suggests that women report higher levels of health problems because of their reduced access to material and social conditions that foster health (Arber & Cooper, 1999; Ross & Bird, 1994), and from the greater stress associated with their gender and marital roles. The differential vulnerability hypothesis, however, suggests that women report higher levels of health problems because they react differently to the material, behavioral, and psychosocial conditions that foster health (McDonough & Walters, 2001).
The aim of the study is to explore whether gender difference in self-rated heath can be attributed to socioeconomic context in which women and men live. Although SES- and gender-related inequalities in health are well documented, only a limited number of studies from developing countries combine these two different strands of literature to assess how gender differences in SES shape differences in self-rated health among older men and women.
Data and Method
In this article, data from the 60th round of National Sample Survey (NSS) conducted between January and June 2004 are used (National Sample Survey Organization [NSSO], 2004). The NSSO is a nationwide, large-scale population-based survey data collected by the Ministry of Statistics and Programme Implementation, Government of India (GOI). The 60th round of NSSO collected data on “Household Consumer Expenditure,” “Employment and Unemployment,” and “Morbidity and Health Care.” The study used the Morbidity and Health Care schedule of the 60th round of NSSO. In the Morbidity and Health Care schedule, the following aspects were covered: morbidity and utilization of health care services, including immunization and maternity care, problems of aged persons, and expenditure of households for availing health care services. More specifically, the data provide information on various aspects of the older population, including living arrangement, number of living sons/daughters, the state of economic independence, person/persons financially supporting the aged, loans, and so on. Information on physical mobility, ailment on the date of inquiry, own perception about the current state of health, and own perception about the relative state of health are also provided. The survey covers a representative sample of about 34,831 older people in the age group 60 and above from 29 states and 6 Union Territories in India.
The present study used self-rated health as a measure of health status. In this survey, the question posed to them was “What is your own perception about your current state of health?” The question had three categories (excellent/very good, good/fair, and poor). We categorized the response categories into two groups, “Poor” which includes only poor and “Good” which includes excellent/very good and good/fair.
Information on the following demographic and socioeconomic variables such as sex, age, marital status, education, work status, monthly per capita consumption expenditure (MPCE), economic independence, religion, social group, living arrangement, place of residence, and region of residence. In this analysis, the variables were categorized as follows:
Sex: male, female.
Age: 60 to 69, 70 to 79, 80 and above.
Marital status: currently married, widowed, never married/divorced/separated.
Education: illiterate, primary, secondary, higher and above.
Work status: engaged in economic activity, engaged in extended System of National Accounts (SNA) activity, others.
MPCE tertile: poor, middle, rich.
Economic independence: independent, partially dependent, fully dependent.
Religion: Hindu, Muslim, Others.
Social groups: Scheduled Castes (SCs), Scheduled Tribes (STs), Other Backward Classes (OBCs), and Others.
Living arrangement: alone, with spouse only, with spouse and others, without spouse and with children, other relation, and other nonrelation.
Place of residence: rural, urban.
Region of residence: Region of residence: North, Central, East, Northeast,West, and South to study socioeconomic determinants of gender difference in self-rated health.
Age is categorized as “youngest-old” elderly (age group 60-69), “old-old” elderly (age group 70-69), and “oldest-old” elderly (age group 80 and above). It is worth mentioning that the MPCE is used as a proxy of poverty. MPCE is estimated by using household consumer expenditure during the last 30 days, and comprises purchases, value of home produce, receipts in exchange of goods and services, gifts and loans, and free collection by adjusting for the size of the household.
Usual activity status was categorized on the basis of activities that are incorporated within the national income of the country (producing goods and services for the market as “engaged in economic activity”), those that are not incorporated within the national income of the country (subsistence production), and those falling outside the market realm as extended SNA activities and others (unemployed but seeking work, renters, pensioners, remittance recipients, disabled, beggars, prostitutes, etc.).
Regional variation in the level of overall development, available health facilities, and family structure was evident; attention was paid to adjust the estimates for region of residence. For this purpose, India was divided into six regions based on the geographical locations and cultural settings. The six regions consist of North (Jammu and Kashmir, Himachal Pradesh, Punjab, Haryana, Rajasthan, Delhi, and Uttaranchal), Central (Uttar Pradesh, Madhya Pradesh, and Chhattisgarh), East (Bihar, Jharkhand, West Bengal, and Orissa), Northeast (Arunachal Pradesh, Assam, Manipur, Meghalaya, Mizoram, Nagaland, Sikkim, and Tripura), West (Gujarat, Maharashtra, and Goa), and South (Andhra Pradesh, Karnataka, Kerala, and Tamil Nadu).
To assess the determinants of gender difference in self-rated health status among the older population, first, bivariate analyses were used to examine the nature of association between health status by selected socioeconomic and demographic background characteristics using chi-square test of significance. Second, to examine which factors best explain and predict self-rated health among men and women, multivariate logit regression model was estimated. For all the statistical tests, p values of <.001, <.01, and <.05 were considered for statistical significance. The analyses were conducted using Stata version 10.0 (Statacorp, 2007).
Results
Profile of the Respondents
Table 1 shows the percentage distribution of socioeconomic/demographic factor by sex of the older population in India. Majority of the older population belonged to the youngest-old age group of 60 to 69 years. While just one in every five men was widowed, three in every five women were widowed at the time of survey. More than 50% of the older men and 83% of women were illiterate. About 50% of the older men compared with 1 in 10 older women were engaged in economic activity and two fifths of the older men and women had a poor economic status. More than half (53%) of the older men reported economic independence compared with 15% of women. Religionwise distribution shows that majority of older men and women were from the Hindu religion. Majority of older men (62%) were residing with spouse and other members, whereas nearly half (49%) of older women were residing without spouse but with their children. More than one third of the older men were living with spouse and other members in a household. However, nearly 50% of the older women were living without a spouse but with children. Nearly 75% of the older men and women were from rural areas. Regionwise distribution shows that the majority of older men and women were residing in the Southern region as the proportion of older persons was higher in this region.
Sample Distribution of Older Population by Selected Background Characteristics, National Sample Survey—2004, India.

Note: SNA = System of National Accounts; MPCE = monthly per capita consumption expenditure; OBCs = Other Backward Classes; SCs = Scheduled Castes; STs = Scheduled Tribes.
Unweighted sample size.
Religion other than Muslim and Hindu.
Caste other than STs, SCs, and OBCs.
Differentials in Poor Self-Rated Health
Table 2 presents results of selected socioeconomic-associated variables with poor self-rated health status by male and female older population. Overall, poor self-rated health was more common among older women (26%) than among older men (22%). The proportion of older persons reporting poor self-rated health increased consistently with age and was highest in the oldest-old age group (≥80 years) for both the sexes (44% among men and 48% among women). The percentage of older persons reporting poor self-rated health was found to be highest for those who were widowed, for both the sexes, and this proportion was higher among women than among their male counterparts (27% among men and 29% among women). Educational attainment showed a negative association with poor self-rated health outcome for both the sexes. However, a higher proportion of women consistently reported poor self-rated health than men in all the educational categories. The group that “engaged in other types of activity” had the highest prevalence of poor self-rated health (33% among men and 38% among women). However, a higher proportion of women engaged in economic activity reported poor self-rated health outcome (14%) than men (12%).
Bivariate Associations Between Self-Rated Poor Health by Sex According to Selected Background Characteristics, National Sample Survey—2004, India.
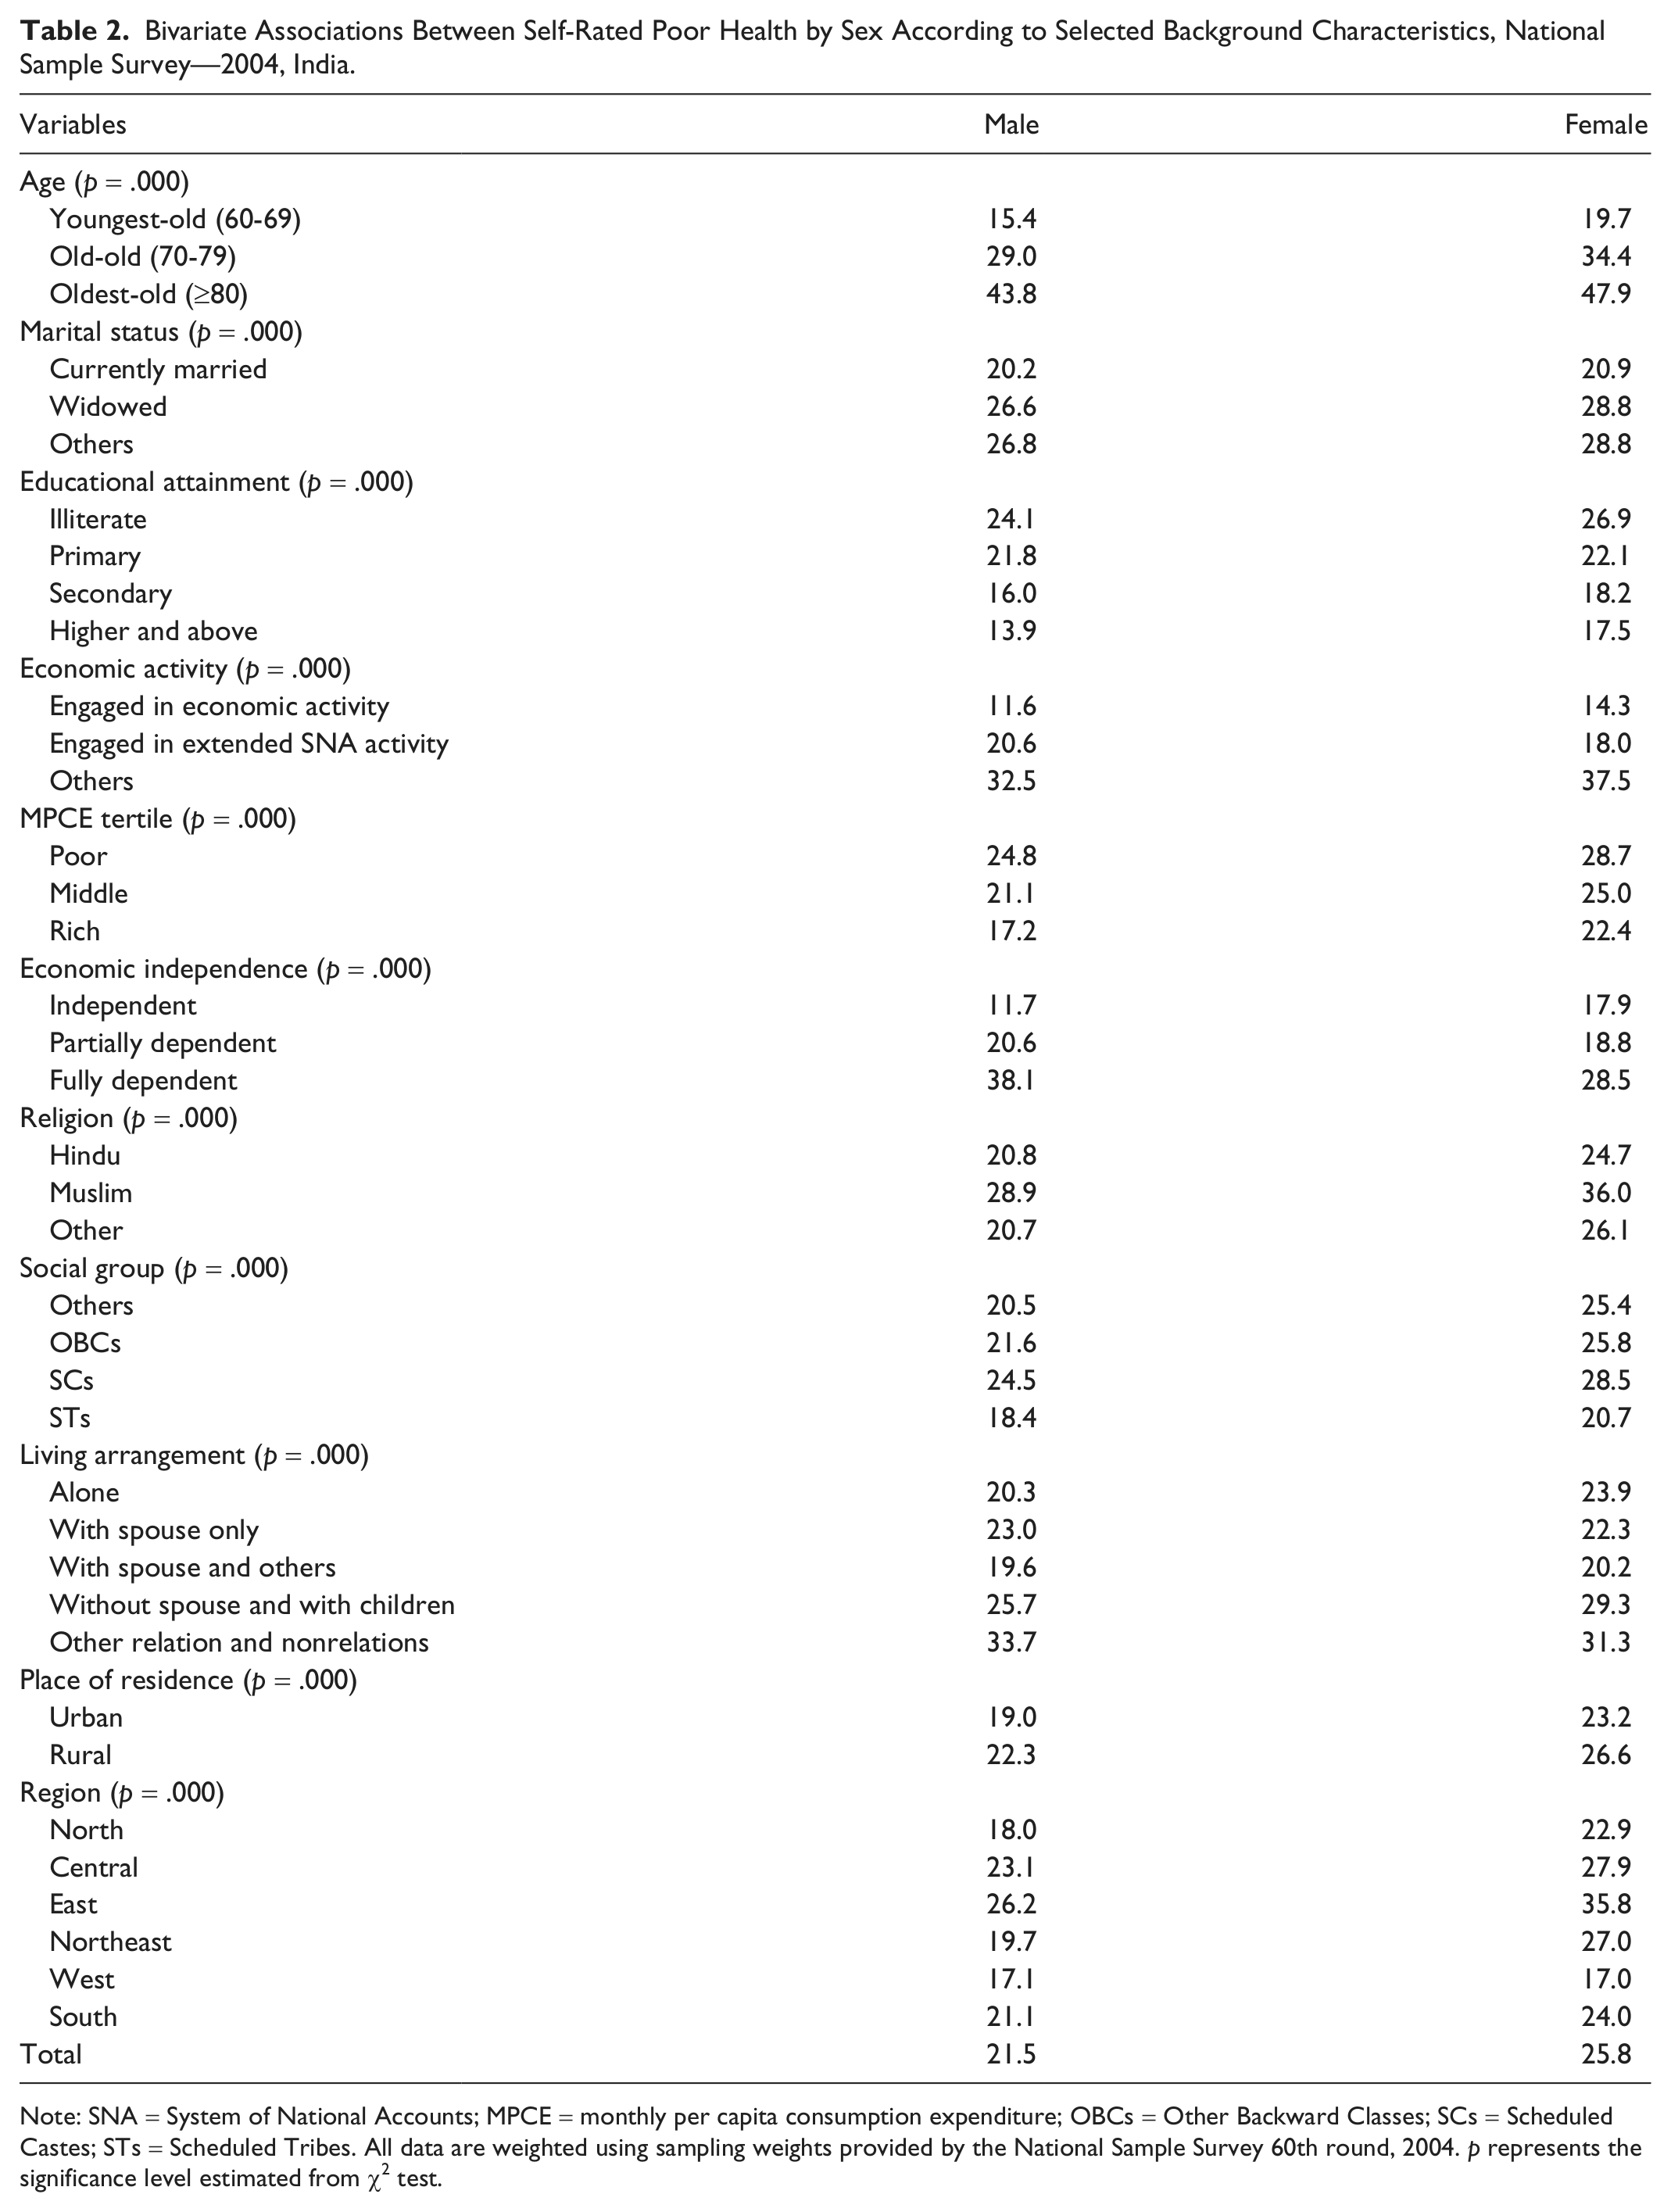
Note: SNA = System of National Accounts; MPCE = monthly per capita consumption expenditure; OBCs = Other Backward Classes; SCs = Scheduled Castes; STs = Scheduled Tribes. All data are weighted using sampling weights provided by the National Sample Survey 60th round, 2004. p represents the significance level estimated from χ2 test.
The MPCE was negatively associated with poor self-rated health in both the sexes. A higher proportion of older persons, particularly women (29%), reported poor self-rated health. The result of economic independence shows that a higher proportion of independent older women (18%) reported poor self-rated health than their male counterparts (12%). Those who were fully dependent on other family members had the highest percentage of reporting poor self-rated health in both the sexes (38% among men and 29% among women). The poor self-rated health was higher among older women than among men irrespective of their religion. By religion, higher percentage of Muslim women reported poor self-rated health (36%). A higher percentage of men (25%) and women (29%) from SCs reported poor self-rated health. Women living alone (24%) and without a spouse but with children (29%) were more likely to report poor self-rated health than men. However, a higher percentage of men living with other relations and nonrelations (34%) reported poor self-rated health.
Place of residence indicating rural–urban differences in reporting poor self-rated health was almost similar for both the sexes and the proportion reporting poor self-rated health was higher among women than among their male counterparts. Except in the Western region, a high proportion of women in all regions reported poor self-rated health; however, it was highest in the East region for both sexes.
Determinants of Poor Self-Rated Health
Table 3 presents results of multivariate logit models estimated to examine the association between selected socioeconomic and demographic predictors on self-rated health. Results reiterate that age is positively and strongly associated with the poor self-rated health for both the sexes. Old-old elderly (odds ratio [OR] = 1.59, p = .000, 95% confidence interval [CI] = [1.451, 1.731] for men and OR = 1.6, p = .000, 95% CI = [1.464, 1.744] for women) and oldest-old elderly for men and for women were more likely to report poor self-rated health compared with youngest-old elderly. Moreover, the odds of poor self-rated health were higher among oldest-old women than among oldest-old men. Educational attainment was not significantly associated with women’s poor self-rated health, while a negative relationship was evident with poor self-rated health for men with secondary (0.81) and higher and above (0.62) educational level compared with illiterate men. Engagement in “other type of activity” was significantly associated with poor self-rated health in both the sexes, while engagement with extended SNA activity was significantly associated with poor self-rated health among men only. Elderly women who engaged in “other type of activity” were more likely to report poor self-rated health compared with those engaged in economic activity (OR = 2.35, p = .000, 95% CI = [1.953, 2.822]).
Logistic Regression Results: Likelihood Estimates of Poor Self-Rated Health Among Older Population, National Sample Survey—2004, India.

Note: CI = confidence interval; [ref.] = reference category; SNA = System of National Accounts; MPCE = monthly per capita consumption expenditure; OBCs = Other Backward Classes; SCs = Scheduled Castes; STs = Scheduled Tribes.
The likelihood of poor self-rated health was significantly lower among richer men (OR = 0.83, p = .003, 95% CI = [0.738, 0.941]) and richer women (OR = 0.83, p = .001, 95% CI = [0.741, 0.928]) than among poor men and poor women, respectively. Older men who were partially economically dependent on others were more likely to report poor self-rated health compared with economically independent men (OR = 1.63, p = .000, 95% CI = [1.44, 1.834]). Moreover, the odds of poor self-rated health were higher among men (2.40) and women (1.53) who were fully economically dependent compared with economically independent men and women, respectively.
The likelihood of poor self-rated health was higher among Muslim men (OR = 1.38, p = .000, 95% CI = [1.217, 1.567]) and women (OR = 1.5, p = .000, 95% CI = [1.328, 1.69]) compared with their Hindu counterparts. However, among Muslims and other religions, the odds of reported poor self-rated health were higher among older women. The association between social groups and self-rated health was clearly evident among women. Older women from the SCs were more likely to report poor self-rated health compared with women from other castes (OR = 1.24, p = .000, 95% CI = [1.103, 1.397]). However, the odds of reporting poor self-rated health were lower among ST women compared with women of other castes (0.69). Rural women were more likely to report poor self-reported health compared with their urban counterparts (OR = 1.29, p = .000, 95% CI = [1.174, 1.406]). Older men and women residing in Central and East region were more likely to report poor self-rated health than those in the North region. However, the odds of poor self-rated health were higher in the Central region for men (OR = 1.41, p = .000, 95% CI = [1.235, 1.618]) and women (OR = 1.87, p = .000, 95% CI = [1.638, 2.125]) compared with the North region.
Discussion and Conclusion
This study highlights socioeconomic factors that affect the gender difference in poor self-rated health among older men and women in India. The self-rated health status of older persons has been used as a response variable in the present study. Several earlier studies have shown that self-reported health among older men and women is a valid measure of the respondent’s objective health status, an important predictor of survival in old age and a strong predictor of healthy longevity (Ghosh & Husain, 2010; Idler et al., 2000; Lee, 2000; McCallum, Shadbolt, & Wang, 1994). Moreover, multiple studies, conducted in a variety of cultures and settings, have consistently shown that persons reporting poorer self-rated health suffer a higher subsequent risk of mortality. Such studies have spanned a wide range of populations, from persons with illnesses such as cancer (Shadbolt, Barresi, & Craft, 2002) and cardiovascular disease (Bardage, Isacson, & Pedersen, 2001) to the elderly (Idler, Kasl, & Lemke, 1990; Ishizaki, Kai, & Imanaka, 2006) and the general population (Heistaro, Jousilahti, Lahelma, Vartiainen, & Puska, 2001; Larsson, Hemmingsson, Allebeck, & Lundberg, 2002). Poor self-rated health has also been shown to be independently predictive of subsequent morbidity and higher health care utilization (DeSalvo, Fan, McDonell, & Fihn, 2005).
The results of this study confirmed the findings from other studies that a higher proportion of older women reported poor self-rated health compared with men in India (Agrawal & Arokiasamy, 2010; Rahman & Liu, 2000). Age was significantly and strongly associated with the poor self-rated health among men and women. The odds of poor self-rated health outcome were higher among oldest-old (≥80) compared with the youngest-old (60-69). Previous studies conducted elsewhere also highlighted strong age effect on poor rating of health status (Kelleher, Friel, Nic, & Tay, 2003). Moreover, the odds of poor self-rated health were more among the oldest-old women than the oldest-old men. This age effect of poor self-rated health may suggest that older women assess their current well-being and illnesses together with other intangible factors, such as their expectation of future health in rating their current health (Gilmore, McKee, & Rose, 2002).
Fewer educated older men reported poor self-rated health than the illiterate. Previous studies have also shown inverse relationships between the educational level and self-rated health (Lahelma, Martikainen, Laaksonen, & Aittomaki, 2004). In this study, the predictive ability of poor self-assessed health was greater for persons with higher education as compared with the lowest educated (Dowd & Zajacova, 2007; Huisman, van Lenthe, & Mackenbach, 2007). It has been argued that people with different educational backgrounds may emphasize different dimensions of health when assessing their overall level of health (Dowd & Zajacova, 2007). For instance, if less educated persons were to rely more on stressors that they experience in daily life when assessing and reporting their overall health, it might reduce the association of their self-assessed health with subsequent mortality as compared with that of higher educated persons (Huisman et al., 2007). There was more poor self-rated health reported by older women engaged in other activity than by older men. This could, to some extent, be linked with the poor physical status of older women than men. Older men and women who have a high MPCE reported lower poor self-rated health. This finding is in keeping with those of other studies, which demonstrated that more older people with a poor economic status reported poor health (Ng et al., 2010). This is probably because richer households have adequate resources and can spend a higher proportion of their earning on diet food and health care. Economic dependency of older men and women has higher odds of poor self-rated health status. This suggests that being economically dependent could restrict the final say on health care needs and demands of elders, and older men and women have to rely on their immediate caretaker’s decisions. From the present study, it may be argued that economic conditions seem to be the crucial factor determining the elderly health status (Alam, 2008; Ghosh & Husain, 2010; Guilmoto & Rajan, 2002; Mini, 2009; Rajan & Kumar, 2003).
As far as the social groups are concerned, more Muslims and SCs and older women reported poor self-rated health than other reference groups. Muslims and SCs in general, and women in particular, are at a relatively disadvantageous position in terms of education and economic status in the Indian social strata compared with Others. The finding that Muslim women are more likely to report poor self-rated health is consistent with other work (Alam, 2008). The poor self-rated health reported by STs could be explained in terms of social conditioning of perceptions that STs have lower expectations and are content with lower actual health status (A. K. Sen, 1993, 2006). In contrast, Muslims and SCs, who have benefited more from affirmative action (GOI, 2006), have higher expectations, and they are dissatisfied with a health status that is better than that of STs. However, poor self-rated health by other religious older women is quite surprising as no previous evidence exists. As the general health and socioeconomic and demographic indicators of other religious groups in India are better than those of Hindus and Muslims, these could be partially linked with their advanced knowledge and awareness about broad health-related dimensions and their high expectations.
The findings clearly suggest gender difference in poor self-rated health by older women in rural areas. This health disadvantage of rural women over urban women and even rural men is the combined effect of residential disadvantage in terms of lack of proper health care infrastructure and other essential civic amenities in rural areas alongside societal and changing family norms. Traditionally, rural Indian women served as the backbone of the rural economy and majority of them have extended their contributions as farmworkers and taking care of household livestock. Poor household environment and traditional cooking practices led to an increased risk of diseases and poor health status in later life. Furthermore, studies have shown that migration from rural to urban areas, work pressure and physical strain on the children, coupled with rising costs of living that intensifies competition for scarce family resources, adversely affects relations between the elderly and their family members (Agewell Foundation, 2010). Such trends lead to social isolation and lack of social networks between the children and the elderly. In particular, the plight of rural elderly females calls for the most concern. Starting from an initially disadvantaged position in a patriarchal society, the status of a woman deteriorates sharply as she loses her functional importance within the family and society, particularly in rural areas (Bagchi, 1997). Furthermore, lack of economic security, mobility, and scope for social interaction increases her social isolation and vulnerability (Ghosh & Husain, 2010).
The variations in poor self-rated health by older men and women across the different regions of the country may be partly linked to the diversity of regions in terms of availability of resources and the state of socioeconomic and demographic progress. The states covered under the Central and East regions are characterized by below-average socioeconomic and demographic indicators compared with those in other regions. The primary health care infrastructure in these states is below average and accessibility to these facilities is also not universal. However, states belonging to the South and West regions have an improved SES. The early demographic transition experienced by states belonging to the Southern regions that have an increased proportion of elderly population led to the foundation of policies for the elderly in these states.
Recently, the National Council for Older Persons (NCOP; GOI, 2008) has been constituted to advice and aid the government in developing policies and programs for older persons. The council has called for researchers to identify key issues pertaining to the older population in India. Based on a large nationally representative sample, this study could provide some key messages for future policies and programs. Recognizing the growing magnitude of the issues related to the older population in India, the GOI has initiated a number of social welfare programs and policies. For example, the National Social Assistance Program (GOI, 1995) made the first attempt to provide a social security network to the elderly through the provisioning of, inter alia, a pension scheme for the elderly destitute (Gokhale, 2003). The National Policy on Older Persons 1999 (GOI, 1999) is another major step forward in this regard. The concept of healthy aging enunciated in this policy was further reiterated in the National Population Policy 2000 (GOI, 2000). This study could strengthen our understanding of the distribution and determinants of health and well-being by sex, and provide stronger evidence on which to base national programs on population health and aging.
This study examined sex differences in health among older adults and found that men reported significantly better health than women. It also revealed a wide variation in how individual and socioeconomic characteristics explain the gaps in self-reported health between men and women. Furthermore, studies are needed to examine individual and contextual determinants to which the health gaps between older men and women can be attributed, including gender roles, thus addressing the health inequalities observed. There is a clear need for gender-sensitive health interventions to address the higher level of poor health reported by older women and the documented health differences between the sexes. Moreover, in a country where social security systems and affordable health care for the older population are largely lacking, an integrated approach is needed in research in inequalities in health as well as in social and health policies addressed to the elderly.
This study reports some limitations including self-rated measure that primarily based on individual’s assessment of their health, which is indeed directly dependent on their own social experiences (A. Sen, 2002). However, in the global public health literature, the use of self-rated health measure has face validity, particularly its relationship to SES (Subramanian, Subramanyam, Selvaraj, & Kawachi, 2009). Due to data constrains, this study could not include measures like social network, community characteristics, and neighborhood environment that might affect perceived self-rated health among older men and women. The present study utilizes MPCE as a proxy indicator for measuring relative economic positions of the household. As this information is based on household expenditure in last 30 days, the probability of recall bias could not be ruled out completely.
Footnotes
Authors’ Note
The study is based on the data available in the public domain for use; therefore, no ethics statement or institutional approval is required for this work.
Declaration of Conflicting Interests
The author(s) declared no potential conflicts of interest with respect to the research, authorship, and/or publication of this article.
Funding
The author(s) received no financial support for the research and/or authorship of this article.
Author Biographies