
Abstract
Recent research suggests that China’s Belt and Road Initiative (BRI) would improve the bilateral trade between China and its partners. This article uses detailed bilateral export data from 1990 to 2017 to investigate the impact of China’s BRI on its trade partners using neural network analysis techniques and structural gravity model estimations. Our main findings suggest that the BRI countries would raise exports by a modest 5.053%. This indicates that export and network upgrades should be considered from economic and policy perspectives. The results also show that neural networks is more robust compared with structural gravity framework.
Keywords
Introduction
The Belt and Road Initiative (BRI) is a core aspect of China’s proactive actions in foreign and economic strategy. In fact, the driving force for the BRI is the development of a first-class network of trading routes capable of serving as a bridge linking China to other parts of the world with ease (Ali et al., 2021). This initiative is taught by many as a tool or a blueprint to heavily promote Chinas trade via global foreign investment while cementing the go out agenda of the central government. For instance, in the case of East Africa, seven sovereign nations including Djibouti, Ethiopia, Kenya, Rwanda, and Tanzania are in the BRI partnership (Miao et al., 2020). Available literature espouses that the trading ties between Ethiopia and Djibouti have been cemented and strengthened since the birth of the BRI (Lewis et al., 2021). Specifically, this success is linked to construction of transportation facilities including ports, roads, and rail for the mutual benefit of the member states. Admittedly, most of the infrastructural projects executed through the BRI across Africa were on top of the 2063 agenda of the African Union (AU), as graphically shown in Figure 1. Within the ambit of economic blocs and trade partnership, East African countries are recognized as members of four main regional economic partnerships. These are the East African Community (EAC), the Common Market for Eastern and Southern Africa (COMESA), and the Intergovernmental Authority on Development (IGAD) with the Southern African Development Community (SADC; see Leshoele, 2020). Without a doubt, infrastructure growth for economic networking is the main pillar of the BRI. On the basis of this, it can be opined that the BRI has birthed the emergence of a plethora of policy coordination, financial assistance, investment projects, and trade facilitation to minimize or eradicate trade impediments and glitches among member countries (Abdulsalam et al., 2021).

China’s share of African Regional Projects.
Despite the picture painted in the above narrative, there is a dearth and paucity of information about how the BRI affects the economic fortunes of participating countries among the different regional blocs in light of alternatives. In particular, this includes the existing regional socioeconomic integrations that have the wherewithal to reduce the cost element on intranational trade and international trade. The strand of studies which assess the effect of the BRI on bilateral trade flow constantly apply the global computable general equilibrium (CGE) model and the gravity model of bilateral trade to estimate the trade flows among member countries. These studies concluded that the BRI actually increases trading activities (Baniya et al., 2020; Herrero & Xu, 2017). Generally, this study builds and goes beyond the frontiers of prior studies to analyze the impact of the BRI on the economies of participatory countries in a more robust manner. Specifically, the study leveraged on the structural gravity model (SGM) and neural network analysis (NNA) to better appreciate the impact of BRI on economic activities. The study used sample data from sovereign nations with European Union (EU), EAC, Association of Southeast Asian Nations (ASEAN), and SADC membership.
The key contributions of this article are as followed. First, it explores a significant and underresearched field of bilateral trading within the schema of the BRI. Although some studies have dwelt on the trading activities in the ambit of the BRI over the years, the authors of these studies chiefly analyzed trade flows between China and its trading partners at the country level (Di Stefano et al., 2021; Ho et al., 2020). In other words, they failed to consider the intriguing trading activities between the BRI and non-BRI countries at the sectoral level to broaden the horizon on the subject matter. Second, we employed a state-of-the-art structural gravity equation by Yotov et al. (2016) and Anderson et al. (2018), to compute BRI-related transport projects on a large number of countries for a general equilibrium (GE) situation. Moreover, we used an applied novel approach as in Larch et al. (2020), the SGM to identify the bilateral trade effects stemming from the BRI in a unified framework following Anderson and Van Wincoop (2004) and Egger and Larch (2008b). In particular, we extended their cross-sectional setup to a panel framework as proposed by Yotov et al. (2016) for panel data and accounted for full endowment GE effects as suggested by Larch et al. (2017). Third, this study applies a novel approach in a form of machine learning algorithm and data mining concept (i.e., artificial neural network [ANN]) to analyze China’s BRI effects on trade flows and demonstrates how ANN complements the conventional econometric approach. The use of ANN in this study is relevant and valuable not only because of its higher predictive power but also because of its ability to estimate complex trade relationships (Ho et al., 2020; Wohl & Kennedy, 2018). Stated differently, machine learning techniques are poised with the propensity to address the limitations of traditional econometrics. To achieve this, the study developed a model of ANN based on panel regression analysis and evaluated the two approaches based on the unseen data set between 2013 and 2017 export values. Finally, their predictive performance was compared with reference to the model forecast errors, using the case of trade between China and its trading partners within the BRI, principally the EAC.
Our preliminary results show the main findings below: The neural network (NN) has a high degree of accuracy in prediction compared with the SGM in terms of root mean square error (RMSE), which is in line with Wohl and Kennedy (2018) and Ho et al. (2020). China’s trade growth effects slightly increase over time under the BRI pointing to the importance of using panel data for trade policy evaluation. The BRI trade boosting effect is qualitatively in line with the results offered by Baniya et al. (2020) and Bastos (2020).
The remainder of the article is structured as follows: Section “A Brief Review of the Literature” offers a brief review of the literature by comparing NN with econometrics and statistics of structural gravity approach. Sections “Panel Data SGM” and “NNs and Implementation” present the overview of the structural panel data gravity and NN models. Section “Data Selection and Description of Variables” introduces the data set and the cleaning techniques and provides a detailed account of features. Section “Estimation Results and Analysis” presents the results and analysis of the model and compares NN predictions with actual trade between China and its BRI members. The final Section “Conclusion” concludes.
A Brief Review of the Literature
This section discusses the ANNs and SGM estimation on economic integration perspectives among the member countries of the BRI. The section highlights different methods used by studies that put the trade effects of the BRI at the center of their investigation. This is to justify the application of ANNs and SGM estimation in this study.
Most of the previous literature on the trading effects of regional trade agreements (RTAs) relies on various approaches, primarily traditional gravity models and recently structural gravity equations. However, few studies that have used NN methods as a predictive mechanism have garnered much attention. Among the few studies conducted so far, Nummelin and Hänninen (2016), in particular, compared the trade flows on soft sawn-wood time series forecasts by countries based on machine learning models with estimates from support vector machines (SVMs), NNs, and decision trees. According to their results, machine learning approaches were very accurate and consistent with the predictive analysis of the global sawn-wood trade flows, as confirmed by Gopinath et al. (2020). Gopinath et al. (2021) and Athey (2018) presented an assessment of the early commitments of machine learning to economics in their research papers, as well as expectations about their future contributions. They also discussed a few aspects of developing econometric integration of machine learning and causal inference, including its impact on the concept of organized research tools activity and research issues. In a similar vein, Elif (2014) conducted an NNA with a gravity model. The findings revealed that NN techniques might be superior to traditional gravity equations in interpreting bilateral trade flows, by considering the R2 or MSE as criteria. Furthermore, the application of ANNs to analyze macroeconomic variables has been perceived as the most robust (Bajari et al., 2015; Gradojevic & Yang, 2000; Tkacz & Hu, 1999; Varian, 2014).
However, structural gravity equations have always been the most compelling theoretical and empirical economic models. It can be used to estimate policies related to international trade flows in a wide range of surveys (Anderson, 2011; Kabir et al., 2017). The incorporation of broader theoretical bases of gravity into current practice has resulted in a more precise and efficient estimate and analysis of the spatial relationships defined by gravity (Larch & Yotov, 2016; Silva & Tenreyro, 2006). Besides the trade flow, the gravity models are were used to answer a range of questions, from the nexus between trade and regional integration (Grossman & Helpman, 1994; Helpman & Hoffmaister, 1997) to the impact of trade between regional blocs and other parts of the world (Carrère, 2004). The most relevant SGM for this study is the strand of literature devoted to analyzing the influence of trade arrangements and monetary union on trade volumes. The extent of the effects sparked a prolonged debate that new estimation techniques have been encouraged to resolve model mis-specification and endogeneity issues related to omitted variables, relying primarily on different country time-invariant with fixed effects (Carrère, 2006; Baldwin & Taglioni, 2006). Baier and Bergstrand (2007) empirically advanced that the different ways to handle likely endogeneity with respect to RTAs are to quantify the gravity model with a fixed-effects estimator. This, in effect, demands a fixed bilateral effect for country pairs and trading specific arrangements including the COMESA (Geda & Kebret, 2008), the EAC (Nsabimana & Tirkaso, 2019), African Continental Free Trade Area (AfCFTA; Abrego et al., 2019), and the ASEAN-China FTA (Rehman et al., 2020).
Research shows that all participating countries of the BRI encourage international trade, economic cooperation, and foreign direct investment (FDI; Baniya et al., 2020; Foo et al., 2019; Herrero & Xu, 2017; Mao et al., 2019). Herrero and Xu (2017) extensively investigated the impact of China’s BRI on the European (EU) market through cross-border infrastructure and bilateral trade. The authors applied the standard augmented gravity model, as proposed by Larch and Yotov (2016) and Baier and Bergstrand (2009). The findings of the study demonstrated that the majority of EU countries would benefit from a reduction in travel time by 8% to 10% as regards the development of trade.
Similarly, Mao et al. (2019) assessed the effects of China’s BRI on node countries’ export performance by applying propensity score matching and various techniques. They found that China’s BRI had an upward trend that significantly influenced the node countries’ exports to China. Regional heterogeneity analysis revealed a smaller positive impact on Central and East Asian and North African countries but higher on the other areas. In a similar vein, Kohl (2019) also reported the effect of the BRI on supply chain welfare and trade in 64 countries during 2002 to 2011 by using an SGM. They found that infrastructural spending would offer asymmetric benefits to Russia, China, and South-East Asian nations resulting from higher access to the EU market. Using the extended gravity model, Foo et al. (2019) further considered ASEAN countries and China over the period 2000 to 2016 to investigate the potential effect on integration and trade volumes in these economies of the BRI policy. The findings show that BRI promotes bilateral trade in ASEAN countries. Baniya et al. (2020) applied a gravity equation and a comparative advantage approach on the currently concerned 71 BRI countries aside from evaluating the effect on export trade values and trade structures of bilateral time improvements. Results showed that BRI raises trade volumes between member nations close by equal to 4.1%, and a significant positive relationship was found. Also, a positive relationship was found in the global value chains between transport infrastructure and trade reforms.
Based on the above review, NNA techniques are applied to the SGM in this study to analyze bilateral trade flows. The study, therefore, demonstrates how NNA complements the conventional econometric approach. This study also offers a quantitative analysis of the BRI’s impacts on participating countries’ trade by using the panel SGM and NNA, particularly for China and Eastern Africa.
Method
Data Selection and Description of Variables
The BRI was officially launched in 2013; however, projects started years earlier are often considered (Hillman, 2018; Ho et al., 2020; Huang & Li, 2020). The analysis covers a panel data set of 163 countries over the years 1990 to 2017. Some countries are excluded due to a lack of data (see Appendix). Our database therefore contains 4,536 bilateral export observations
Summary Statistics for the Parameters Used in the Analysis.

Note. GDP = gross domestic product.
Cleaning Techniques and Features
The techniques of data cleaning are common practice and a necessity for many estimators. They are used in the prediction process to prevent data anomalies and possible obstacles. Until we began our research, we used several data cleaning techniques. First, we delete all entries that do not have a trade flow value because they are not economically significant and trigger outer problems. Second, we use backward and forward linear interpolation to extrapolate the missing data. Third, to attain a smoother distribution of the data, we took the data log as shown in Figure 2. After this process, we were left with 3,936 observations.
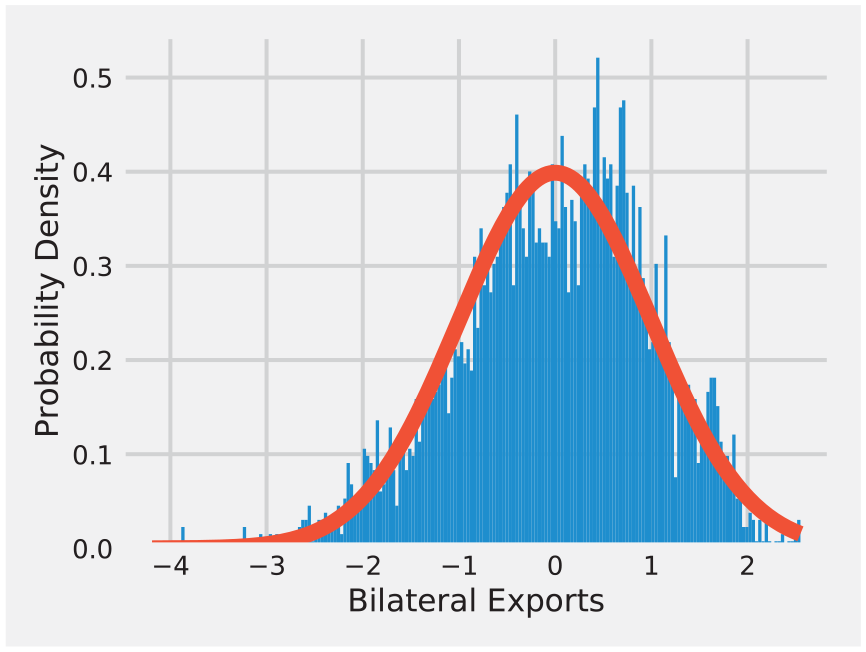
Histogram of feature space distribution of bilateral exports.
For the NN, we standardize the persistent variables (GDP_exporter, GDP_importer), scaling them up to zero and their standard deviation equal to one using Equation 1.

where µ is the mean of the distribution and

Panel Data SGM
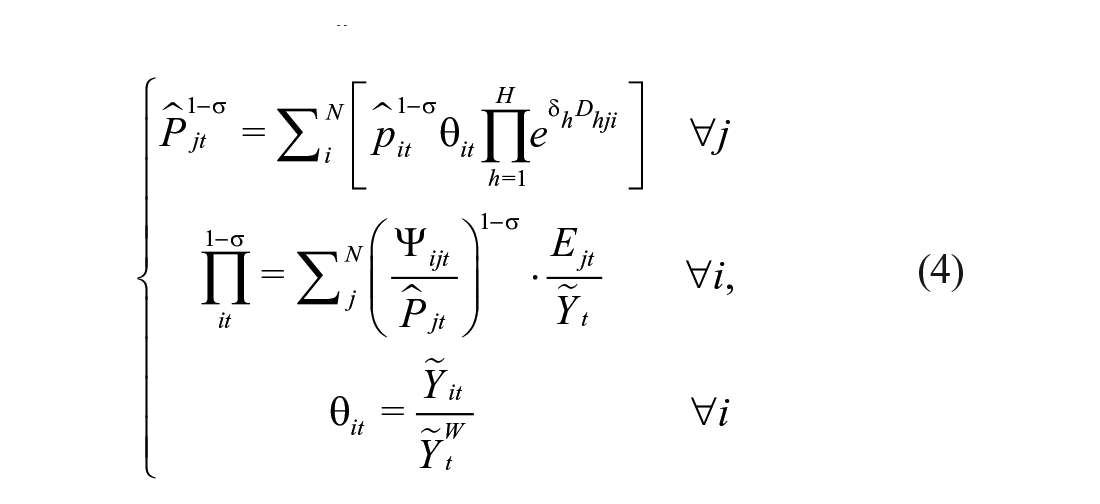
Based on the seminal contribution of Anderson and van Wincoop (2003) and Egger and Larch (2008a), in an N-country endowment economy, we initially describe a set of assumptions to derive a gravity equation. We extend their cross-sectional setup to a panel data structure as suggested by Yotov et al. (2016) and Sellner (2019). Thus, aggregate bilateral exports from each exporter

where
where

where
Econometric Specification and Identification
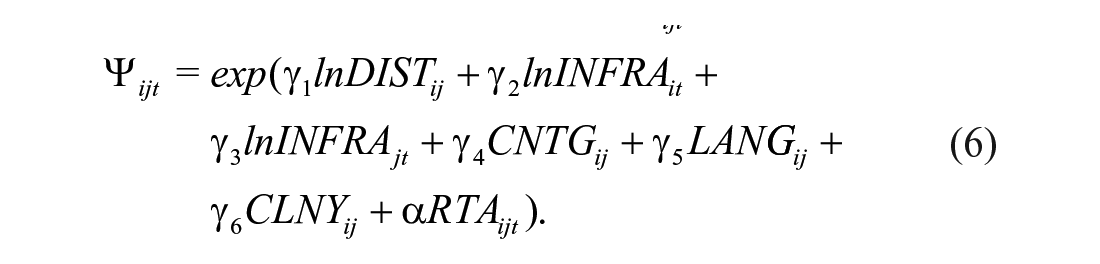
To set up our econometric model, we expanded Larch et al.’s (2020) version of a structural gravity specification by introducing one additional term that captures the bilateral BRI effects on international trade:

Here,
NNs and Implementation
An ANN is a computational model that has gained significant popularity due to a number of claimed benefits derived from the way in which biological NNs process information in the human brain. This describes a specific category of nonlinear models that have been successfully applied to a variety of issues, such as pattern recognition, natural language processing, medical diagnostics, functional synthesis, economics, financial sciences, and forecasting (Adeleye et al., 2020; Gopinath et al., 2021; Wohl & Kennedy, 2018). In a multilayered perceptron (MLP), recognitions are orchestrated into layers and layers are associated with one another as appeared in Figure 3. Specifically, there are three kinds of layers in MLP: the input layer, hidden layer(s), and the output layer (Chiu et al., 2020). The input layer gets input designs and the output layer could contain a rundown of arrangements or output signal to which those input arrays may delineate. Hidden layers change the weightings on those inputs until the error of the ANN is minimalized (Acheampong & Boateng, 2019; Ho et al., 2020; Wohl & Kennedy, 2018). The mathematical form of the MLP output can be written as:

where

Artificial neural network with 13-13-1 structure.
This study applies Scikit-learn, Pandas, and Keras build on top of Tensorflow. NN models usually differ in topology, node characteristics, and training or learning rules. These rules fix the initial set of weights and display how weights should be altered and adjusted to improve performance. We also use Adam optimizer Kingma and Ba (2014) to train the network for 100 epochs with a training speed of lr =
Evaluating Goodness of Fit Measures
To determine the predictive performance of the structural gravity trade model, the conventional econometric analysis and the new ANN approach are applied. Consistent with recent studies from Gopinath et al.(2020) and Ho et al. (2020), two metrics in this study estimate the predictability of the regression model for panel data: the coefficient of determination
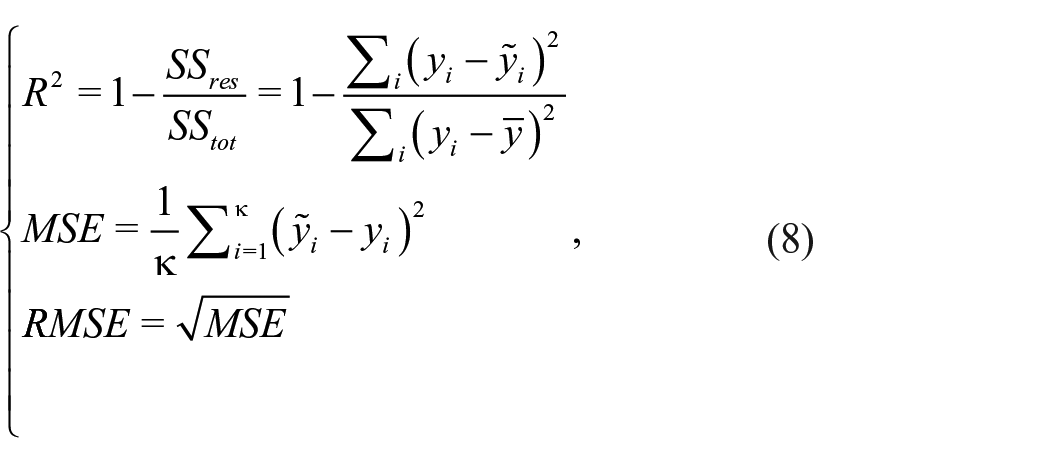
where
Estimation Results and Analysis
Results of Panel Structural Gravity Estimations
In Table 2, all the coefficients have the normal sign; the main special case is the coefficient of the contiguity indicators that appear to have a negative effect in the event that we consider PPML. Focusing on the PPML panel structural gravity specifications with fixed effects to estimate Equation 7, all the estimates are in accordance with previous expectations except contiguity. We attain a negative and highly statistically substantial estimate of the impact of distance
BRI Effects on International Trade: PPML Estimations.

Note. Fixed effects are included in the regression but not reported for brevity. However, robust standard errors are reported in Column (2). PPML = Poisson pseudo maximum likelihood; BRI = Belt and Road Initiative.
p < .05.
Results of the ANN Model
We evaluate the training dynamics for each sample, and the data gathered were randomly split into three subsets: training, testing, and validation where 60% of the data were used in the training stage, 40% in the validation stage, and 40% in the testing stage, given some helpful sample information (see Table 3).
Training Results.

Note. RMSE = root mean square error.
Table 3 shows the RMSE and R-squared
In Figure 4, we also illustrated the training loss and the inverse confidence of our prediction on a validation set. Here, the validation loss was calculated at the end of each epoch. Two deductions can be made from Figure 4. First, the ratio between the training loss and the validation loss indicates that the network steadily learns. In addition, the training rate is similar or slightly higher than the validation rate before Epoch 4, and beyond Epoch 4, the training loss and validation loss remain constant, showing that they have reached a convergence threshold.

Training and validation loss.
Figure 5 emphasizes the regression plots of China’s BRI bilateral trade flows between its members with respect to training, validation, and testing data. A solid line displays the best linear fit in Figure 5. Mean squared error is obtained for three subsets of the data set separately after training the NN, which is computed as the average squared difference between standardized network outputs and targets.

Outputs produced by the artificial network versus targets.
Predictions Performance of the NN
To demonstrate one application for forecasting, we trained the NN on the entire data set with country fixed effects from 1990 to 2013 and used it to forecast trade between China’s BRI and its major trading partners between 2013 and 2017, mainly Eastern and Southern Africa. We supplied the NN with the actual trade flow of China’s BRI and its trading partners during that era without readjusting the model otherwise. The findings are shown in Figure 6. The NN estimates are reasonably close to actual trade values even 5 years beyond the period of training.

Artificial neural network predictions versus Actual Trade.
Discussion
This study adopted NN models in the context of international trade and raised concerns about their applicability and prediction accuracy. Using data from 1990 to 2017, the baseline specification of the standard SGM of trade flows was applied to NN mechanisms. NN models were built using a series of indicators, which included widely used structural gravity parameters such as the scale of economies, their distance from one another, trade agreements, and their related frictions, as shown in Tables 1 and 4. In conjunction with the data properties, the validation statistics aided in the explanation of NN projections and the relative significance of structural gravity parameters. In addition, NNs were used in this analysis to discover associations between exports and the gravity parameters.
Description of Variables Selected.

Note. GDP = gross domestic product; CEPII = Centre d’Etudes de Prospectives et d’Informations Internationales; BRI = Belt and Road Initiative; ASEAN = Association of Southeast Asian Nations; EAC = East African Community; SADC = Southern African Development Community.
The results of NN indicate that the models match well in the short to medium term (2013–2017), implying that forecasts strongly track actuals because the models have a solid adjusted R2 and trade details span a vast range of countries and years, as demonstrated in Figures 4 to 6. This is in line with the works of Elif (2014) and Gopinath et al. (2020). A significant benefit of the NN model is its capacity to distinguish which parameters within the series of indicators contain more knowledge about bilateral trade flows. However, these findings are compatible with the literature on trading and SGMs (Anderson, 2016), NN powers at selecting features, forecasting, and economic potential (Wohl & Kennedy, 2018).
Predicting foreign trading trends is important for public and private sector decision-making. This study highlights the importance of NNs in accurately forecasting trading trends than structural gravity across various time intervals. Existing trade projections, such as those issued by the WTO, the ASEAN, and the AfCFTA, are focused on a mixture of model-based analyses and expert judgment and thus, have a large degree of uncertainty. It is beneficial to comprehend why trading activities occur in its manner. A scientific investigation that SGMs with new requirements may be promoted. In addition, it is advantageous to forecast trade between two countries with a significant degree of precision. Therefore, a realistic inquiry on NNs should be encouraged. Accurate predictions of international trade will help policymakers, analysts, and businesses alike to plan with utmost certainty.
The scope of this study is restricted to an examination of traditional economic forces within the SGM. Additional sources of instability, such as trade agreements, information and communications technology (ICT) and digital infrastructure, and environmental degradation, should be investigated in future studies. Researchers are encouraged to combine modern machine learning techniques with traditional econometric techniques while examining theoretical models that account for global trade flows at the national and sectoral levels under the BRI. This contributes to our understanding of the BRI position and effect on enhancing communication and fostering trading activities both inside and outside the BRI operational areas.
Conclusion
This article is the first attempt to examine the effects of the BRI of China on bilateral trade, and the resulting trade impacts of the Belt and Road countries using a combination of SGM and ANN analysis. We mainly focused on the relative performance of ANNs versus panel SGMs in analyzing bilateral trade flows for selected BRI economies, particularly in Eastern Africa and Southern Africa, using annual data from 1990 until 2017. The findings demonstrate that contrast between the R2 generated by NNs (0.96) and the SGM (0.89) indicates that NN modeling provides marginally higher predictive power (Gopinath et al., 2020; Ho et al., 2020; Wohl & Kennedy, 2018). Our results also depict that NNs make accurate estimation and forecasting than other candidate methods. The accuracy of ANN can be very beneficial for researchers and policymakers. A quick glance at the prediction reveals that Exports of BRI economies in Eastern and Southern Africa have seen some improvement in their global export pickup since the mid-2013s, even though their export values are significantly lower than those of the participating BRI countries (EU, ASEAN, EAC, and the rest of the world). Similarly, BRI members that are more integrated into the regional agreement would tend to boost their exports. Moreover, both two techniques may boost the overall prediction performance. In this regard, NNs could lead to complementary methods to SGMs, which are in accordance with international economics literature.
Footnotes
Appendix
List of BRI Countries in This Study.

|
|
Country | Code(iso3) |
|
Country | Code(iso3) |
|---|---|---|---|---|---|
| 1 | Albania | ALB | 39 | Madagascar | MDG |
| 2 | Armenia | ARM | 40 | Maldives | MDV |
| 3 | Azerbaijan | AZE | 41 | Macedonia, FYR | MKD |
| 4 | Burundi | BDI | 42 | Myanmar | MMR |
| 5 | Bangladesh | BGD | 43 | Mongolia | MNG |
| 6 | Bulgaria | BGR | 44 | Mozambique | MOZ |
| 7 | Bosnia and Herzegovina | BIH | 45 | Mauritania | MRT |
| 8 | Belarus | BLR | 46 | Mauritius | MUS |
| 9 | Brunei Darussalam | BRN | 47 | Malaysia | MYS |
| 10 | Bhutan | BTN | 48 | Nepal | NPL |
| 11 | Czech Republic | CZE | 49 | Oman | OMN |
| 12 | Djibouti | DJI | 50 | Pakistan | PAK |
| 13 | Algeria | DZA | 51 | Philippines | PHL |
| 14 | Egypt, Arab Rep. | EGY | 52 | Poland | POL |
| 15 | Estonia | EST | 53 | Qatar | QAT |
| 16 | Ethiopia | ETH | 54 | Romania | ROU |
| 17 | Georgia | GEO | 55 | Russian Federation | RUS |
| 18 | Guinea | GIN | 56 | Rwanda | RWA |
| 19 | Croatia | HRV | 57 | Saudi Arabia | SAU |
| 20 | Hungary | HUN | 58 | Sudan | SDN |
| 21 | Indonesia | IDN | 59 | Singapore | SGP |
| 22 | India | IND | 60 | Somalia | SOM |
| 23 | Iran, Islamic Rep. | IRN | 61 | Slovak Republic | SVK |
| 24 | Iraq | IRQ | 62 | Slovenia | SVN |
| 25 | Israel | ISR | 63 | Thailand | THA |
| 26 | Jordan | JOR | 64 | Tajikistan | TJK |
| 27 | Kazakhstan | KAZ | 65 | Turkmenistan | TKM |
| 28 | Kenya | KEN | 66 | Turkey | TUR |
| 29 | Kyrgyz Republic | KGZ | 67 | Tanzania | TZA |
| 30 | Cambodia | KHM | 68 | Uganda | UGA |
| 31 | Kuwait | KWT | 69 | Ukraine | UKR |
| 32 | Lao PDR | LAO | 70 | Uzbekistan | UZB |
| 33 | Lebanon | LBN | 71 | Vietnam | VNM |
| 34 | Sri Lanka | LKA | 72 | Yemen, Rep. | YEM |
| 35 | Lithuania | LTU | 73 | South Africa | ZAF |
| 36 | Latvia | LVA | 74 | Zambia | ZMB |
| 37 | Morocco | MAR | 75 | Zimbabwe | ZWE |
| 38 | Moldova | MDA | 76 | China | CHN |
BRI = Belt and Road Initiative.
Author Note
Edem Koffi Amouzou is now affiliated to University of Electronic Science and Technology of China, Chengdu, Sichuan, P.R. China.
Declaration of Conflicting Interests
The author(s) declared no potential conflicts of interest with respect to the research, authorship, and/or publication of this article.
Funding
The author(s) received no financial support for the research and/or authorship of this article.