
Abstract
In the context of Industrial 4.0, Vietnam has emerged to play a critical role in the global supply chain while facing intense competition and fast changes. However, what drives manufacturing enterprises in Vietnam to innovate themselves and how well they perform in coping with business obstacle remains one of the central questions in the extent of studies. Therefore, this research primarily attempts to establish how innovation investment and obstacles affect technological and non-technological innovations, especially in the growth phase of the industry life cycle (ILC), with an analysis of available data obtained from the General Statistics Office of Vietnam and World Bank Enterprise Survey data with the use of descriptive statistics and regression analysis. The outcome of this article highlights that researchers and practitioners should consider the importance of the industry life cycle in the choice of technological or non-technological innovation through third significant contributions. First, the innovation investment is driven by R&D, and formal training enables both technological- and non-technological innovation. Second, the innovation obstacle related to finance, policy, competition, and regulation directly impacts the choice of innovation activities. Third, this study demonstrates that the firm’s engagement in technological- and non-technological innovation in line with innovation investment can help maintain successful post-innovation performance.
Keywords
Introduction
After three decades since the 1986 Doi-moi (Renovation), Vietnam had emerged as one of the most dynamic emerging countries in the South East Asian region. The developments of 4IR digitalize the whole of society and state management and span across innovations in enterprises such as new materials, innovative operating models for manufacturing. In addition, Vietnam has recently joined the Comprehensive and Progressive Agreement for Trans-Pacific Partnership (CPTPP), the EU-Vietnam Free Trade Agreement (EVFTA), and the Investment Protection Agreement (EVIPA). These agreements make the Vietnamese market lucrative, attracting foreign enterprises’ investment (World Bank, 2020). That leads to the fact that Vietnamese manufacturing firms should strengthen their creative and specialized capabilities to adapt to the new digital eras. Several studies depict the patterns and determinants of a firm’s innovation activities using microdata from the Vietnam SMEs (Doan & Vu, 2016; Anh, 2014; Nguyen et al., 2008). To some extent, the picture of innovative behavior among Vietnamese manufacturing firms is incomplete since SMEs’ innovation efforts are low and tend to be informal (Anh, 2014). The key reason leading to impossibly conduct innovation is partly low awareness about innovation and SMEs’ inherent internal capability (Anh, 2014; Brach et al., 2012). Besides, most of these studies have focused on a limited set of factors, including firm size, ownership types, and other firm-specific characteristics (Hue, 2019). Therefore, the awareness of Vietnamese manufacturing enterprises’ innovation types is a driving force for business growth and the latest phenomenon.
Innovation plays a vital role in reshaping the future of production inclusively and sustainably (Martin & Leurent, 2017). Innovation is not merely to yield new knowledge but also to develop new products or services, new process technologies, new organizational structures, or new managerial approaches. Therefore, it contributes significantly to boosting productivity, improving competitiveness, and ensuring long-term survival (Q. Chen et al., 2020; Radicic & Djalilov, 2019; Exposito & Sanchis-Llopis, 2018; Minetti et al., 2015). In the context of globalization, the majority of firms are now facing rapid changes in technology, leading to shorter product life cycles. A comprehensive understanding of firms’ technological and non-technological innovations is crucial for emerging countries to compete globally (García Álvarez-Coque et al., 2017). Therefore, manufacturing firms may conduct various innovation decisions involving technological and non-technological aspects (Organisation for Economic Co-operation and Development [OECD]. et al., 2005) to increase their performance, competitiveness, and adaption to the industry life cycle (Cucculelli & Peruzzi, 2020; Geldes et al., 2017; Tavassoli, 2015; Tavassoli & Karlsson, 2015).
Technological innovations are usually affiliated with product and process innovation. However, non-technological innovations are generally associated with organizational and marketing innovations (Rajapathirana & Hui, 2018; Tavassoli & Karlsson, 2015; Karlsson & Tavassoli, 2015; OECD et al., 2005). The body of literature shows that manufacturing firms seek technological innovations to accelerate value creation, competitive advantage among industries, and enhance firm performance (Coad et al., 2019; Ramadani et al., 2019; Snihur & Wiklund, 2019; Rajapathirana & Hui, 2018). Besides, recent studies argue that non-technological innovation appears to be recognized as a strong potential factor to contribute to firm organization performance rather than technological innovations such as increasing total sales and helping business minimize risks (Radicic & Djalilov, 2019; Geldes et al., 2017; Černe et al., 2016). Therefore, it is vital to analyze how the differences between technological and non-technological innovation in manufacturing firms across the industry growth stage, especially in the influence of firm-level innovation determinants.
This article aims to examine whether internal and external factors directly influence the way Vietnamese manufacturing firms choose technological or non-technological innovation over the industry life cycle. To examine these factors, available data provided by the General Statistics Office of Vietnam data and World Bank survey data in 2015 are subjected to analysis. A total number of two sectors in two digits over the period 2000 to 2015 provides 663 observations drawn from the General Statistics Office of Vietnam (GSOV). Therefore, this study’s main contribution is the comprehensive analysis based on empirical data, which reveals the links between each kind of innovation and the survival of businesses and firm ownership in the period of industry growth, filling in the gaps that previous studies have not mentioned. The researcher also explored the impact of R&D make or buy, with emphasis on the environmental obstacles that the company faces in innovation management. Consequently, an overview of innovation strategies involving technological and non-technological change for manufacturing firms in Vietnam is suggested.
This article has five sections. Following the introduction section, section “Literature and Hypotheses” reviews the theoretical background and our hypotheses development. Section “Method” presents the empirical data and research methodology. The empirical findings and discussions are introduced in section “Results.” Finally, in section “Conclusion,” conclusions and suggestions for future research are given.
Literature and Hypotheses
Industry Life Cycle
It is argued that the firms’ innovation behaviors take place in the industry life cycle (Tavassoli, 2015; Klepper, 1996). According to the emerging literature of the industry life cycle, four stages in an industry’s development are commonly recognized: introduction (or emergence), growth, maturity, and decline (Audretsch & Feldman, 1996). The first stage significantly involves product innovation through a variety of exploratory techniques and assistance between production, marketing, and distribution capabilities (Grant, 2016). The investment requirements and financial resources play the most crucial role in the transition period from the first product to the next generation (Haiyan et al., 2020; Peltoniemi, 2011). As the life cycle evolves toward the growth stage, output proliferates in line with an investment in R&D, development of human resources, plant, and equipment (Grant, 2016). Although distribution and marketing channels help businesses maximize production capacity, the administrative apparatus’s tension also occurs, leading to managerial and organizational innovation demands. In the maturity stage, R&D investment, management, manufacturing, and marketing techniques all reach a relatively advanced degree of refinement rather than in the previous stage, so significant innovations tend to be fewer. The successful key in this phase is the effective controlling cost through economies of scale, and the best competitive advantage for firms is production efficiency. The final stage is characterized as “the routinized technological regime.” In this stage, the incumbent enterprises tend to increase the pressure for cost-cutting, encourage the departure of incompetent industries, and create opportunities for the rest to capture the next market trend (Haiyan et al., 2020; Grant, 2016).
According to Schumpeter (1934), the interaction of innovation and industry life cycle is shown to be the development and transformation of technology associated with industries’ growth. In addition, dynamic competition appears as emerging new technologies and products, and innovation types are considered as the direction for the firm survival. This study supports the importance of technological and non-technological innovation in the growing stage of ILC, which is an instrument to cope with the high degree of heterogeneity in the competitive environment, particularly as diversified product design and market-oriented unpredictability. Recent empirical pieces of evidence also emphasize the influence of ILC on innovation (Cucculelli & Peruzzi, 2020; Tavassoli, 2015). More specifically, using data of 9,602 European manufacturing firms, it is shown that firm ownership affects the innovation types (Cucculelli & Peruzzi, 2020). Also, Tavassoli (2015) analyzes how firm-level innovation determinants change over the stages of ILC by firm-level CIS4 data of Sweden. Thus, as discussed in this article, the innovation activities will begin vigorously and continuously at the growth phase of the ILC. This period requires high standardization, which makes businesses invest actively and quickly in production capacity. Besides, the alignment with process improvement, design modification, and production scale will create cost advantages and greater flexibility to help businesses efficiently respond to market obstacles.
Technological and Non-Technological Innovation
Technological innovation is considered as combining product and process innovation to successfully transfer new business opportunities and ideas (OECD, 2018; OECD et al., 2005). Product innovation is “a new or improved good or service that differs significantly from the firm’s previous goods or services, and that has been introduced on the market.” (OECD, 2018). New knowledge or technologies can be applied to create different products, which possess a competitive advantage in cost, performance, and quality over previous products. Besides, process innovation is “a new or improved business process for one or more business functions that differ significantly from the firm’s previous business processes and has been brought into use by the firm” (OECD, 2018). Through significant changes in techniques, equipment, or software, process innovation can be intended to do some cost-cutting of a product or service, as well as increase the quality and reliability for the customer.
“Non-technological” innovation focuses on all the innovation activities of manufacturing firms that are excluded from using technological new, including organizational and marketing innovation. More specifically, organizational innovation refers to the implementation of “new or significantly amended forms of organization, business structures or practices,” aimed at reducing costs, improving internal efficiency or effectiveness and approaching markets and customers” (Geldes et al., 2017; Černe et al., 2016; OECD et al., 2005). Meanwhile, marketing innovation emphasizes the implementation of new marketing methods concerning significant changes in the promotion, packaging, or placement of display products and product design and appearance, which is not related to functional characteristics (Geldes et al., 2017; Černe et al., 2016; OECD et al., 2005). Table 1 provides several characteristics of technological- and non-technological innovation.
The Characteristics of Technological- and Non-Technological Innovation.

Several recent studies have focused on exploiting the role of technological- and non-technological innovation in maintaining firm survival and growth. Radicic and Djalilov (2019) explore how technological innovation and non-technology affect export intensity in small and medium-sized enterprises (SMEs). Besides, Geldes et al. (2017) mention the influence of technological and non-technological innovations on firm performance across diverse industries. Camisón and Villar-López (2011) also examine whether organizational and marketing innovation is affected by learning capabilities and corporate memory and consider their role in a sustainable competitive advantage based on the theoretical framework capabilities-based view. Our research focuses on a more detailed assessment of innovation obstacles and Vietnamese manufacturing investment that influences technological innovation, including products and processes. Furthermore, we also analyze whether technological innovation causes will be the main drivers of organizational and marketing innovation.
Hypothesis Development
Many studies focus on the relationship between innovation obstacles and types of innovations (Bodlaj et al., 2020; Hartono & Kusumawardhani, 2019; Tavassoli, 2015; Madrid et al., 2009). Studying the importance of innovation obstacles for Indonesia’s manufacturing firms, Hartono and Kusumawardhani (2019) find that market and institutional obstacles do not significantly impact innovation, while employee and organizational barriers positively affect all types of innovation, except organizational innovation. Similarly, Madrid-Guijarro et al. (2009) demonstrate that management and process innovation are adversely affected by human and financial resource constraints in Spanish businesses. Our hypothesis supports Tavassoli (2015) argument that manufacturing firms will participate in innovation activities facing the business environmental obstacle in the growth phase. Also, small manufacturing firms in the growth phase would lack internal resources and might have difficulty investing heavily in innovation. Given this supporting evidence, we examine the impact of external obstacles on technological- and non-technological innovation in the industry life cycle. In particular, four obstacles from the external environment are considered: the firm’s current financial potential, the practice of competitors, political instability, and customs and trade regulation. Therefore, we hypothesize the following:
Hypothesis 1
There is a positive relationship between innovation obstacle and the propensity for technological and non-technological innovation in the growth phase of ILC
The correct choice between the model of technological and non-technological innovation needs to be based on how much the company has invested in innovation inputs such as investment in internal R&D, investment in external R&D, and employees’ training (OECD et al., 2005). A recent empirical study on the European Community Innovation Survey, Tsinopoulos et al. (2018) shows that external R&D investments influence the introduction of process innovation. More specifically, the higher the external R&D investment, the higher the likelihood of implementing a process innovation. Similarly, using a multinomial logit regression model to analyze the determinants of different innovation types, Karlsson and Tavassoli (2015) emphasize internal R&D spending and innovation training activities significantly impact technological- and non-technological innovation. Moreover, Martínez-Román and Romero (2017) demonstrate that investment in R&D, business planning, and employees’ training activities has a significant effect on introducing technological- and non-technological innovations. They proposed that external R&D cooperation with universities and technology centers will bring about success in innovation. This study examines how the level of R&D investment and formal training in the industry growth phase affects the choice of technological- and non-technological innovations. Following Tavassoli (2015) research, manufacturing firms have an appropriate level of R&D and employees’ training investment in the growth stage of ILC, which may benefit from a higher return rate on innovation (especially for product innovation) than firms in the later stages of ILC, we hypothesize the following.
Hypothesis 2
There is a positive relationship between innovation investment and the propensity for technological and non-technological innovation in the growth phase of ILC
Our research also focuses on how technological- and non-technological innovation affect firm performance in the growth phase of ILC. Implementing innovation seems to indeed be the building blocks of a firm’s performance and success in the future (Gërguri-Rashiti et al., 2017). In this regard, Exposito and Sanchis-Llopis (2018) indicate that the different impacts of technological innovations on products, processes, and non-technological innovation on organizations for financial and operational performance in the context of a Spanish sample of SMEs. Geldes et al. (2017) confirm in an empirical Chile study the relationship between non-technological innovations (marketing and organizational innovations) with innovative performance. Covering the insurance industry, Rajapathirana and Hui (2018) investigate the relationship between innovation type and different aspects of innovation, markets, and financial performance. However, there is very little research in the literature explaining the positive relationship between technological- and non-technological innovation and financial and operational achievement during ILC, especially the growth phase. Despite research by Cucculelli and Peruzzi (2020) mention the impact of innovation over ILC, there is still a gap in determining innovation performance. Therefore, we will hypothesize as follows.
Hypothesis 3
The better the firm’s choice of implementing technological- and non-technological innovation during the growth phase of ILC, the higher the chances of achieving a successful post-innovation performance.
Method
Sample
Vietnam is an exciting context for studying the firm’s innovation patterns due to its on-going economic and political transformation. Recently, the Vietnamese government has made many efforts to create a favorable business environment and support digital transformation to catch up with the 4IR trends (e.g., Directive 16 on the development of the Industry 4.0 of the Resolution No. 36a/NQ-CP on e-government, issued on May 4, 2017). As a country in the process of industrialization, modernization, and international integration, the 4IR opens up numerous opportunities for Vietnam to upgrade the technological level, create a tremendous change of form of business service, as well as is a great opportunity for industrial production with advanced science and technology. In contrast, the 4IR also poses challenges for several specific sectors and areas such as technological innovation requirements in information technology, the requirements for innovation in the management and production model, optimization business model, and new and better intellectual property management system in the digital age. The revolutionary changes in science and technology lead to dramatic changes in the structure, economic model, state management system, and business operation mode. Therefore, Vietnamese manufacturing enterprises have undergone a transformation from a labor-cost-driven model to an innovative-driven model, with new firms setting up while backward incumbent firms exit or restructure to adapt to the emerging competitive market (Santarelli & Tran, 2017).
Data derived from the “World Bank’s Microdata Library” detail responses from Vietnamese manufacturing small and medium enterprises. The “Enterprise survey” aims to track changes of Vietnamese businesses over time and assessments of reforms. The data were collected using interviews directly with candidates in the manufacturing sector. Only registered companies are considered in the 2015 Enterprise Survey. The survey includes sections ranging from general information to individual opinions, from growth constraints to performance for the fiscal year, contributing to statistically significant indicators.
Methods for Identification of ILC Stages
This research aims to find out the determinant factors that affect innovation types and then discover how it penetrates the manufacturing firms during the growth phase of ILC. The method of determining three ILC phases (growth, maturity, and decline) is related to Tavassoli (2015) research, using the Birch index of employment growth at 59 two-digit manufacturing sectors. For instance, Tavassoli (2015) distributes all sectors at the two-digit NACE into 15 groups, depending on employment growth. Group 1 had always shown a positive relationship with net employment growth over 15 years. Group 2 also has a positive relationship with net employment growth but the exception of 1 year. Group 3 has a positive relationship with net employment growth but an exception of 2 years. Finally, Group 15 shows an entirely negative relationship with net employment growth over 2000–2015. After that, the growth phase consists of groups of 1 to 5, the mature phase contains groups 6 to 9, and the group, 10 to 15, shows the decline phase (See Figure 1 for examples). Similarly, Cucculelli and Peruzzi (2020) also use the above-proposed method to compare allocate a growing or mature/declining phase. Thus, based on the industry’s employment growth changes, we can classify industries into the growth, maturity, and decline phase of ILC (see Appendix B).
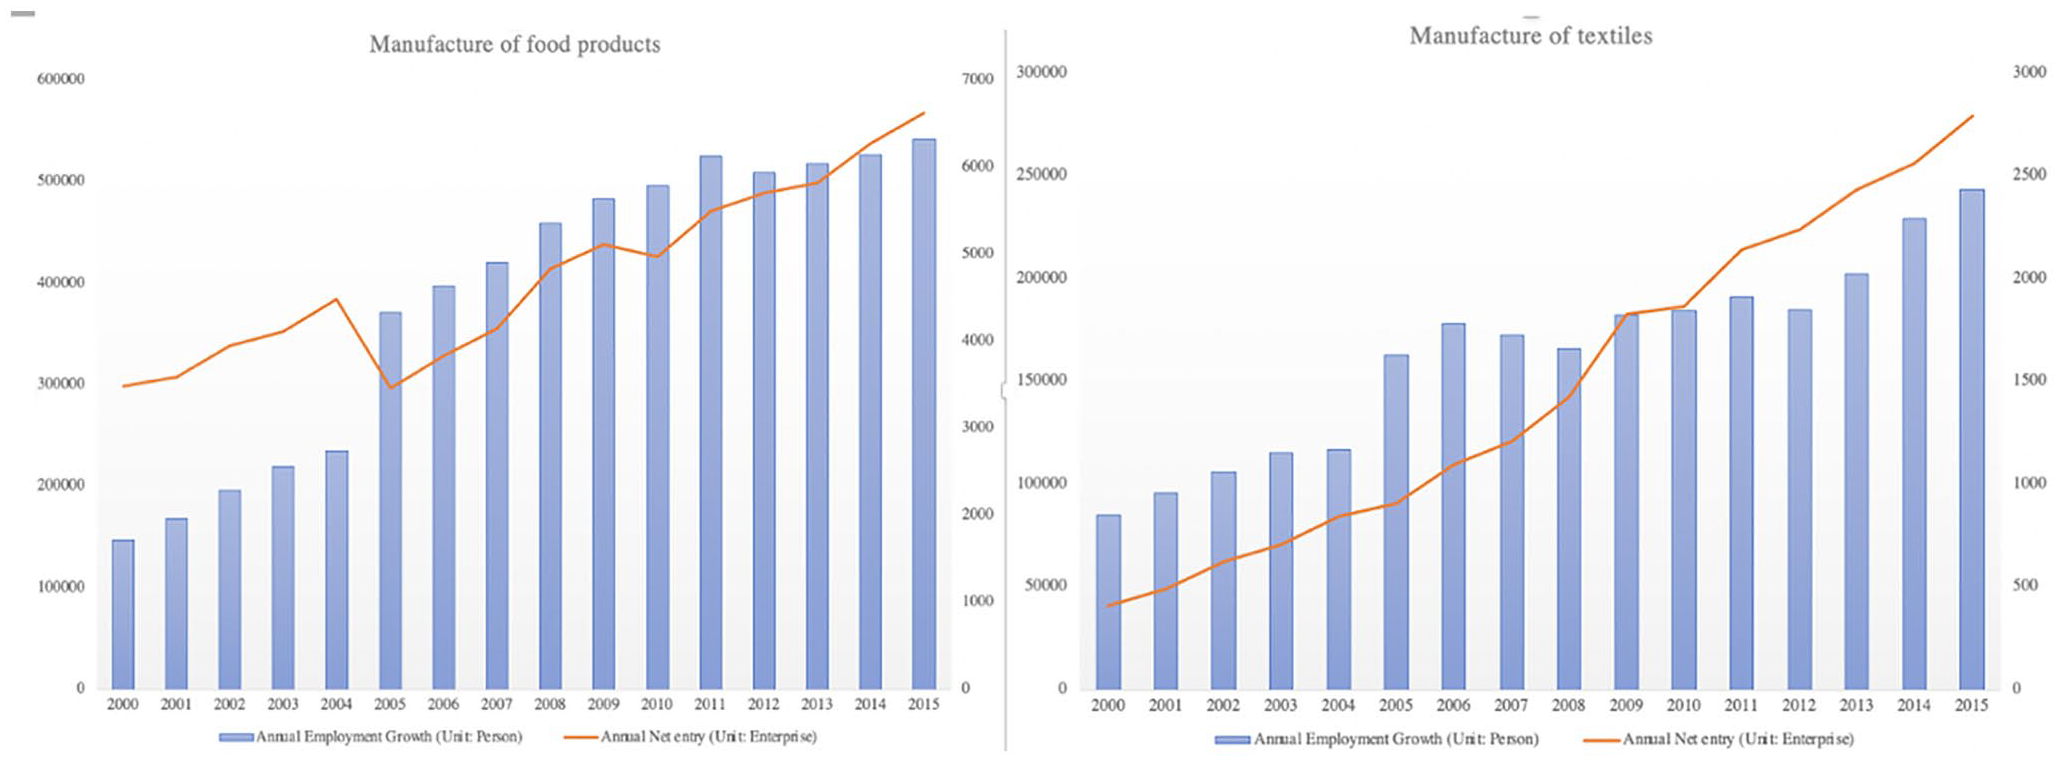
The ILC determination method adopted the number of employment and firm growth.
Our dataset is based on a harmonious combination of two sources formed in Vietnam (1) using the General Statistics Office of Vietnam data to identify the stage of ILC and (2) adopting World Bank Enterprise Survey data for containing questions on technological and non-technological innovations. First, employment growth data in the 23 manufacturing sectors for two-digit code during 2000–2015 of Vietnam manufacturing are covered by the General Statistics Office of Vietnam (GSOV). According to Tavassoli (2015), Vietnamese industries are classified into three phases of ILC (see Appendix B). This classification method shows that Vietnamese manufacturing companies are almost still in the growing stage, consistently with theoretical predictions. Second, we integrate with microdata from the World Bank Enterprise Survey (2014–2015) and only consider the manufacturing sectors. This dataset ends up with 663 manufacturing enterprises corresponding to 21 manufacturing sectors that define the growth phase of ILC (Appendix C).
Measures
This study specifically examines the influence of innovation investment and obstacle factors on technological and non-technological innovation, followed by a review of the performance-control instinct of innovation. Consequently, innovation investment is categorized into three dimensions: R&D make, R&D buy, and formal training for employees. Four critical aspects of innovation obstacles for its choice on technological- and non-technological innovation: the obstacle of firms in the finance (rivalry), the policy, the influence of competition, and trade regulation. Finally, we considered the firm age, firm size, top manager experience, and firm ownership structure as control variables.
Dependent variable
The classification of technological innovation (TECH-INN) and non-technological innovation (NTECH-INN) is found in the 2015 World Bank Vietnam Enterprise Survey. TECH-INN consists of two types: product innovation and process innovation. Product innovation (TECH_PROD) is captured using a dummy variable, indicating whether the firms introduced new or significantly improved products (1 = yes, 0 = no). Process innovation (TECH_PROC) is a dummy variable which equals 1 (one) in case that the firm introduced any new or significantly improved methods of manufacturing products, and otherwise 0 (zero). Also, NTECH-INN includes two types: organizational innovation and marketing innovation. Organizational innovation (NTECH_ORGN) is a dummy variable which equals 1 (one) in case that the firm establishments introduced any new or significantly improved organizational structures or management practices, and otherwise 0 (zero). Marketing innovation (NTECH_MART) is also a dummy variable equals to 1 (one) if the firm establishment introduced new or significantly improved marketing methods and otherwise 0 (zero). Appendix C indicated that Vietnamese manufacturing companies introduce more technological innovation during growing periods than other ILC stage. More specifically, during the growth stage, firms invest in product innovation in 33.8% of cases, product innovation in 35.3% of cases, and non-technological change, including organizations innovation in less than 20% of cases marketing innovation account for 29.7% of case.
We rely on the Sale Growth Rate (SALE) to know the business’s condition status after innovation. Sales growth is calculated using the percent growth in the net sales from one fiscal period to another (Frazier & Howell, 1983). Sale Growth Rate is then calculated as (Current Period Net Sales—Prior Period Net Sales) / Prior Period Net Sales. All data are from World Bank Vietnam Enterprise Survey, 2015.
Independent variable
To test Hypotheses 1 and 2, we use a set of independent variables referring to innovation investment (INVEST) such as R&D activities and formal training to its employees and innovation obstacle (OBST) following as finance, policy, competition, and regulation. We distinguish two types of R&D investments involved in the innovation process. First, the company spends on R&D activities, either in-house or contracted with other enterprises, reflecting in the firm’s decision. Next, quick access to advanced outside technology can be done in several different ways, such as a purchase or license of any patented or non-patented inventions, hired away skilled personnel, or acquire other types of knowledge for the development. We group these activities into the firm’s BUY decision in this study. We measure the R&D make (R&D_MAKE) and R&D buy (R&D_BUY) using the question in World Bank Vietnam Enterprise Survey, 2015: “a dummy variable equal to one of the firm spend on formal research and development activities, either in-house or contracted with other companies, and zero otherwise” and “a dummy variable equal to one of the firm purchase or license any patented or non-patented inventions, or other types of knowledge for the development of new or significantly improved products or services and process, and zero otherwise.” Similarly, formal training (TRAIN) measurements also obtained from the World Bank Microdata were collected for the prior 2 years during the growing stage: “a dummy variable equal to one of the provide formal training to any of its employees specifically for the development and/or introduction of new or significantly improved products or service and process, and zero otherwise.” The obstacle of business environment used by finance (FINN), policy (POLT), competition (COMP), and trade regulation (TRADE) was measured using the questions: “To what degree is Financial obstacle to the current operations of this establishment?,” “To what degree is Political obstacle to the current operations of this establishment?,” “To what degree is Competition obstacles to the current operations of this establishment?” and “To what degree is Custom and trade regulation obstacle to the current operations of this establishment?,” respectively. The 5-point Likert-type-scale describes the importance of political instability (no obstacles–very obstacles).
Control variables
Control variables include the firm size (SIZE), firm age (AGE), top manager experience (EXPR), and firm ownership structure (STRUCT). SIZE plays a crucial role in responding to external environmental changes and is proportional to its survival (Uzzi, 1996). Large companies will find it more difficult to innovating concerning organizational structure than small ones due to the inertia. The World Bank data rely on the number of employees that the company possesses to appropriately group, coding small, medium, and large equals 1, 2, and 3, respectively. The young companies exhibit weakness in implementing innovation due to the lack of workforce and the ability to withstand productivity losses because of the side effects of restructuring (Levinthal, 1991). They lack market-oriented skills, negotiate, and exchange information with partners, as well as create alliances or acquire potential patented. The survey question from the World Bank: “In what year did this establishment begin operation?” helps us to identify which developmental target group the company is in and make appropriate comments for each specific circumstance. Similarly, EXPR is also measured by the question, “How many years of experience working in this sector does the Top Manager have?.” Finally, STRUC is measured by the question “What is this firm’s current legal status?” in the World Bank Enterprise Survey.
Research Method
Using the dichotomous variables in this article (TECH_PROD, TECH_PROC, NTECH_ORGN, and NTECH_MART) as a dependent variable to test hypotheses 1 to 3 of this article, the logistic regression is the appropriate analysis. We apply the maximum-likelihood estimation to predict the logit model, a suitable tool to estimate the parameters and asymptotic values for a large sample study. We evaluate the whole logit model through −2 log-likelihood, Model
Results
Descriptive Statistics
Table 2 presents the mean, standard deviation, and correlations for the 663 Vietnamese manufacturing companies collected during 2014–2016 by World Bank. Appendix C indicated that more than 224 samples conducted TECH_PROD, 234 samples for TECH_PROC, 126 samples using NTECH_ORGN, and 197 samples using NTECH_MART. Table 2 also informs us that firms with higher investment in R&D_MAKE, R&D_BUY, and TRAIN are involved in technological innovation and non-technological innovation. The statistically positive correlation between the obstacle in FINN, POLT, COMP, and TRADE and the likelihood of a company innovating indicate that Vietnamese manufacturing enterprises in the growth phase will participate in technological- and non-technological innovation when there is an increase in environmental obstacles.
Mean, Deviation, and Correlation.

Correlation is significant at the .05 level (two-tailed). **Correlation is significant at the .01 level (two-tailed).
Regression Analysis
Tables 3 and 4 show the hierarchical logistic regression analysis results in which the dependent variable is TECH_PROD, TECH_PROC, NTECH_ORGN, and NTECH_MART (coding dummy variable for each type, Yes = 1; No = 0). This table includes four types of innovation, and each one starts from control variables, internal variables, and external variables to the full model. These results test each logit model’s significance and present 2-log-likelihood, Cox and Snell R2, Nagelkerke R2, and Chi-square. The product innovation model in Model 1 analyzes the control variables thanks to the AGE, SIZE, EXPR, and STRUCT. The next model adds an enterprise’s innovation investment (Model 2), including R&D_MAKE, R&D_BUY, and TRAIN. The results show us that businesses that invest heavily in R&D_MAKE and TRAIN positively affect product innovation (β = 1.579, p value <.001, β = 1.277, p value <.01, respectively). Considering the full model (Model 4), POLT and COMP motivate manufacturing enterprises to innovate products to maintain competitive advantage, particularly POLT (β = −.151, p value <.1), and the competition obstacle (β = .210, p value <.01). Similarly, TECH_PROC in Model 8 also shows the impact of innovation investment and the obstacles in the business environment. R&D_MAKE, R&D_BUY, and TRAIN have a direct positive impact on TECH_PROC (β = 1.286, p value <.001, β = 1.534, p value <.01, and β = .797, p value <.01 respectively). Also, FINN, COMP, and TRADE hypotheses have significantly affected the innovation process (β = .163, p value <.05, β = .234, p value <.01, and β = .160, p value <.05, respectively). In addition, the innovation model 4 of TECH_PROD (chi-square = 153.799, p value <.001; Cox and Snell R2 = .207, Nagelkerke R2 =.287) and TECH_PROC (chi-square = 146.111, p value <.001; Cox and Snell R2 = .198, Nagelkerke R2 =.272) are significant. Similar to TECH-INN results, the hierarchical logistic regression analysis of NTECH-INN showed that NTECH_ORGN (Model 12) and NTECH_MART (Model 16) receives considerable support from R&D_MAKE, R&D_BUY and TRAIN when the industry enters the growth phase of ILC. More specifically, the obstacle of COMP strongly affects two types: NTECH_ORGN (β = .205, p value <.1) and NTECH_MART (β = .304, p value <.001). Thus, Hypotheses 1 and 2 are supported.
Results of the Hierarchical Logistic Regression Analysis: Predicting Technological Innovation Adoption (N = 663).

Note. Number in column is unstandardized regression coefficient and standard error of the coefficient.
Bold value indicates a statistically significant difference with a p-value less than 0.1.
p < .10. *p < .05. **p < .01. ***p < .001.
Results of the Hierarchical Logistic Regression Analysis: Predicting Non-Technological Innovation Adoption (N = 663).
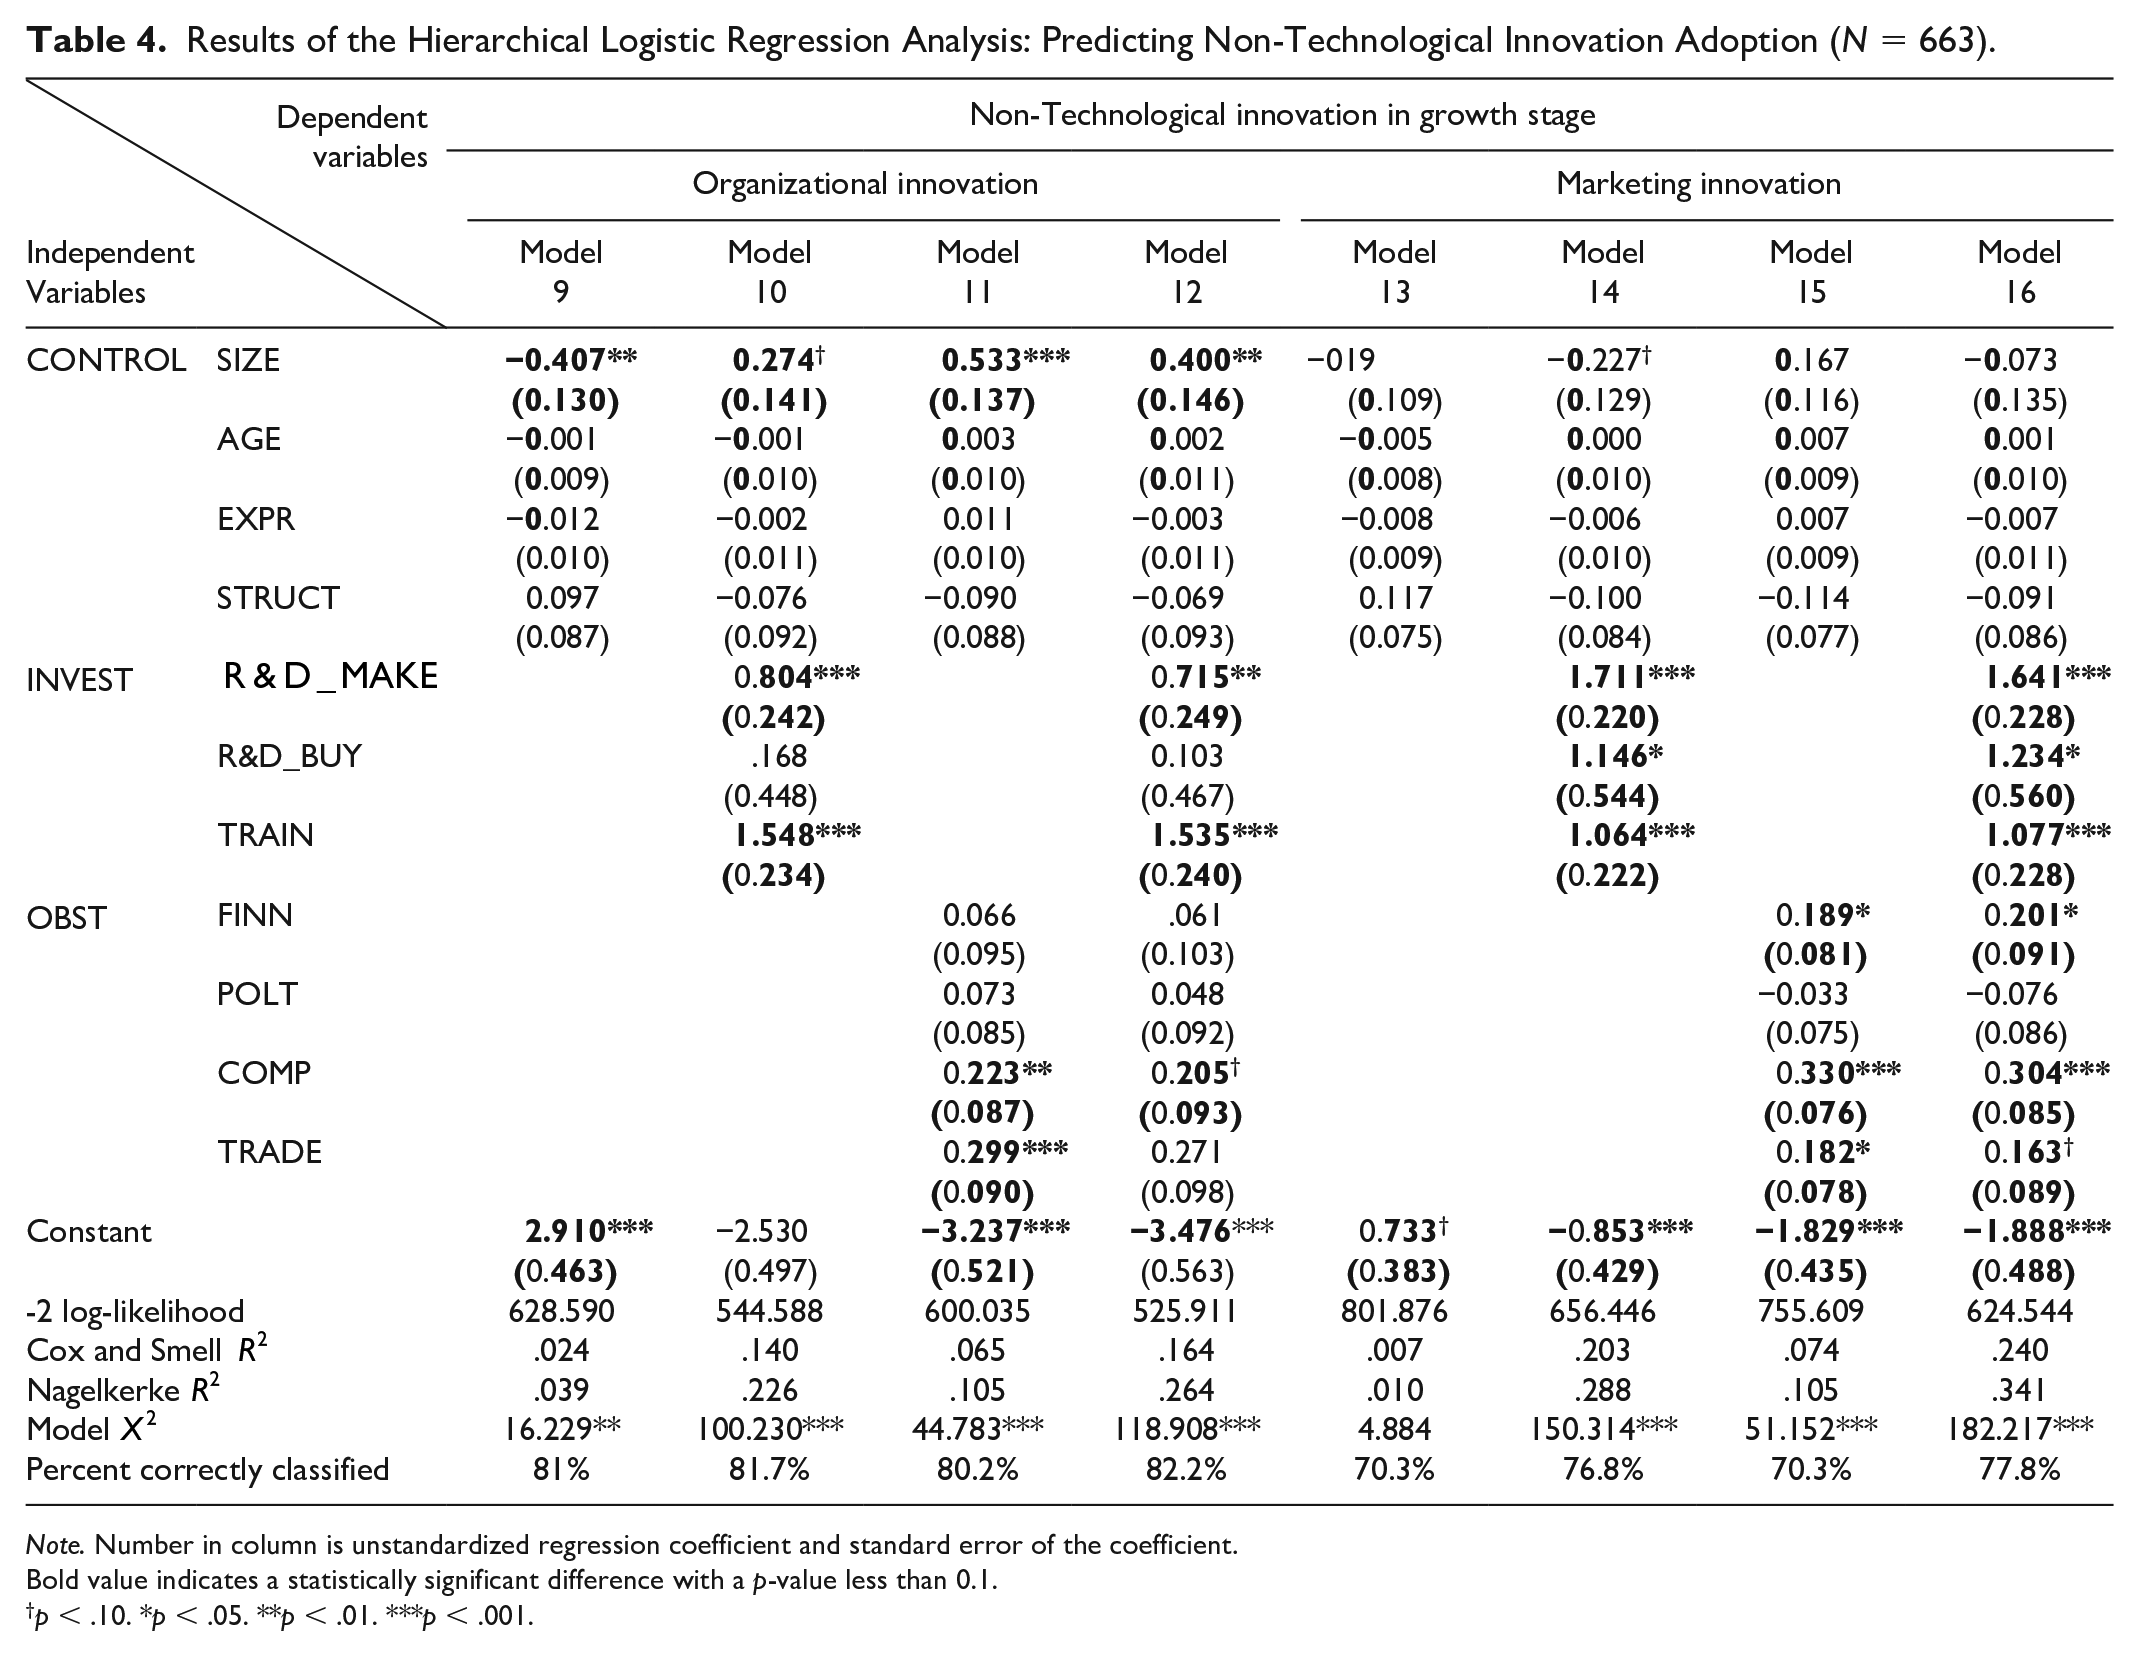
Note. Number in column is unstandardized regression coefficient and standard error of the coefficient.
Bold value indicates a statistically significant difference with a p-value less than 0.1.
p < .10. *p < .05. **p < .01. ***p < .001.
Table 5 reports the hierarchical linear regression analysis outcome, which is joined by mediated variables, an actual test for evaluating the last hypotheses. In general, the next assumptions forecasted the influence of embedded mediation, INVEST, and OBS by selecting TECH-INN and NTECH-INN. SALE was calculated in Vietnam between November 2014 and April 2016. Baron and Kenny (1986) propose testing a mediated relationship through evaluated whether the internal and external variables have a significant impact on firm performance at the same time. The results in Model 2 presented SALE regresses on NTECH_ORGN (β = −.094, p value <.05), NTECH_MART (β = .085, p value <.1), AGE (β = .119, p value <.01), EXPR (β = −.077, p value <.1), and TRAIN (β = .116, p value < .01). However, the NTECH-INN model mediates the OBST’s effect on the SALE is not considered in hierarchical linear regression analysis. The influence of the mediated variables on the Sale Growth Rate is significant with non-technological innovation, particularly organization and marketing innovation. In addition, the more substantial the firm age and formal training, the more likely the firm will have a higher Sale Growth Rate through marketing innovation. Thus, Hypothesis 4 supported in terms of non-technological innovation.
Results of the Hierarchical Linear Regression Analysis: Technological and Non-Technological Innovation–Sale Growth Rate.

Note. Number in column is a standardized regression coefficient.
Bold value indicates a statistically significant difference with a p-value less than 0.1.
p < .10. *p < .05. **p < .01. ***p < .001.
Model 3 to Model 12 in Table 5 shows the correlation between ownership and SALE in the four dimensions of innovation when the ILC during the growth stage. These results are consistent with the more significant the percentage of ownership, the higher the chances of achieving a successful post-innovation performance during the growth stage. It is in line with Minetti et al. (2015) results, which determine the positive influence of ownership on technological innovation, using survey data from EFIGE. Model 6 shows that TECH-INN in a shareholding company with non-traded shares influences the SALE. In particular, we find that a shareholding company with non-traded shares performs TECH_PROD has a positive impact on the firm outcome (β = .207, p value <.1), and TECH_PROC perform in the opposite direction (β = −.294, p value <.05). Another regression on NTECH-INN shows that the NTECH_ORGN and NTECH_MART are not directly affected by the four types of firms’ ownership, such as the shareholding company with shares trade in the stock market, the shareholding company non-traded shares, partnership, and limited partnership. However, NTECH_ORGN and NTECH_MART performed in the sole proprietorship, which is the highest percentage of ownership, shows a negative effect on the SALE (β = −.108, p value <.1; β = −.137, p value <.05). Overall, these results suggest that the impact of the ILC on TECH-INN and NTECH-INN during the growth stage is also significantly affected by the firms’ ownership structure.
Discussion
Results have provided evidence to support the proposed hypotheses. Remarkably, findings reveal a clear distinction between innovation types driven by different factors and give an accurate view of their association with firm performance. The nature of innovation investment (including the investment in R&D make or buy, and formal training for employees) and the obstacle of the business environment (namely financial, political, competitive, and regulation obstacle) significantly influence distinct types of innovation over the stage of ILC, which in turn determine the continued existence of the manufacturing enterprise.
In terms of technological innovation, the outcomes highlight that product innovation is mainly based on the investment in R&D (make), formal training, and the obstacle of politics and competition. Besides, process innovation is driven by both factor innovation investment and the business environment barriers, except for political obstacles (Cucculelli & Peruzzi, 2020; Hartono & Kusumawardhani, 2019; Madrid-Guijarro et al., 2009). Concerning non-technological innovation, the results show that innovation investment actively promote organizational innovation, including business practices on R&D (make) and competitive obstacles. Finally, marketing innovation is strongly influenced by external factors such as finance, competitors, and trade regulation. Besides, the investment in R&D and formal training have a significant negative impact on marketing innovation (Tavassoli, 2015).
Regarding sales growth rate, the manufacturing firm’s engagement in marketing innovation in line with firm age, management’s experience, and formal training investment can help maintain successful post-innovation performance (Cucculelli & Peruzzi, 2020; Hartono & Kusumawardhani, 2019).
Practical and Policy Implications
This study supplements the current management literature by examining the different effects of internal and external drivers on innovation adoptions and their influence on firm performance in the context of the Vietnamese manufacturing industry, which has rarely been empirically investigated. The findings uncover specific patterns of technological and non-technological innovation strategies, reveal specific drivers to various types of innovation, and shed some light on policy and practice. Policy-makers and practitioners may follow up on the findings to enact different policies and actions to trigger and manage innovation activities.
The findings demonstrate that continues to advance theory concerning the impact of external obstacles on technological and non-technological innovation in the industry life cycle (Hartono & Kusumawardhani, 2019; Tavassoli, 2015; Madrid-Guijarro et al., 2009; Silva et al., 2008). In particular, the enterprise’s innovation efforts can be reduced, originating from financial, competition, political, and regulation obstacles, which support our Hypotheses 1. Using CIS4 data comparing countries belonging to developed economies in Western Europe, Eastern Europe, and Central Europe, Hashi and Stojčić (2013) do not indicate the impact of environmental barriers on performance successfully through the mediation of technological and non-technological innovation. On the contrary, in the context of Vietnam, we find that environmental constraints are significantly considered as another aspect of explaining the impact of technological and non-technological innovation on manufacturing firms’ performance.
The findings support our hypotheses and other scholars’ arguments (Martínez et al., 2017; Karlsson & Tavassoli, 2015; Tavassoli, 2015; OECD et al., 2005) that the greater the company invests in staff training, the higher organization’s ability to adopt innovation, which results in a higher level of performance. In this vein, manufacturing firms operating at the growth stage in the industry life cycle should increase investment in internal and external R&D development, staff training, and machinery acquisition; such actions are intended to create a competitive innovation strategy as a consequence (Freeman & Soete, 1997).
Several practical applications and policy implications are provided for policy-makers in Vietnam. Foremost, this research provides a better understanding of innovation strategies and their determinants in the manufacturing industry. Thus, it is crucial for integration into the management knowledge that allows companies to fully benefit from each innovation project carried out (i.e., increase investment in R&D and formal training, and decrease the external environment’s obstacle). Since each project is characterized by a different type of innovation (product, process, organization, and marketing), managers must identify an appropriate integration mechanism via leverage the outputs and learning from the projects. Besides, our study points out several weaknesses in human resource management in Vietnam now. For instance, most Vietnamese manufacturing companies only concentrate much more on developing knowledge and technical skills rather than training potential people as the tangible assets needed to innovate. Therefore, to promote the likelihood of innovation success, companies should transform their human resource management strategy and pay more attention to the investment and development of necessary skills by their employees under technological and non-technological innovation.
Second, this study proposes a mixed policy combining financial and non-financial instruments that would be adaptive to Vietnam’s economic development landscape. Our findings show that manufacturing firms participate in R&D to make a difference compared to their competitors and increase profits. However, the firm’s motivation to conduct R&D is decreased due to the costs and uncertainties in R&D investment, the time required to capture investment return, and the ability of competitors to capture the knowledge spillover effect. To foster national innovation and global competitiveness in the context of the 4IR, technological and non-technological innovation highly essential to suggest appropriate policies targeting specific types of businesses, especially in businesses that rely on innovation and new technologies in the manufacturing industry. Basically, the majority of support for R&D and innovation in the manufacturing enterprise consists of financial and non-financial policies. Financial instruments constitute direct financing (e.g., credit and guarantee loans, repayment loans, competitive subsidies, innovation support coupons) and indirect financing (e.g., incentives R&D tax). Meanwhile, non-financial instruments include a set of tools like innovative business services, event planning, supporting technology transfer, and promoting cooperation between research institutions and businesses that drive business innovation. The interactions between policy instruments can be complementary and interchangeable, depending on different situations and at specific times. In addition, the effectiveness of a policy instrument is almost always dependent on its interaction with other instruments at different times and for various purposes. Actually, several manufacturing firms tend to invest insufficiently in R&D activities. Hence, these policy instruments will support the government to reshape the direction of business efforts into new R&D areas or areas that benefit sustainable development manufacturing enterprises. Furthermore, to promote the national innovation environment, the intellectual property law should be strictly reinforced to ensure that enterprises’ investments in R&D will receive a decent return.
With these findings, this study will supplement the deficiency in current research on innovation because of the lack of evidence from the manufacturing firm samples in developing countries such as Vietnam. It is evident that the contributions of the technical innovation spending, which is characterized as R&D to new product (NP) innovation, productivity, and profitability in a developing economy such as China, are surprisingly robust (Jefferson et al., 2006). It is also parallel to those found in the U.S. literature (Tassey, 2010; Segerstrom et al., 1990). However, Chinese high-tech firms remain the insufficiency of internal R&D expenditure and the weakness of absorptive capacity. Thus, on the macro-level, the Chinese government should reform the innovation service system, while on the micro-level, firms should readjust their innovation strategy portfolio (Y. Chen & Yuan, 2007). In the context of Vietnam, we will provide a decision-making basis for the central Government’s current actions to profoundly construct and improve the innovation service system.
Conclusion
Over the years, innovation had a dramatic impact on not just the individual manufacturing firms but also on their productivity and competitiveness. Actually, most innovative manufacturing enterprises overall are growing enormously faster and more successful than the least innovative. As the competitive environment changes rapidly through scientific and technological advances, scholars are continually reinforcing the theoretical view of innovation as a competitive tool. This study examines how internal and external factors affect the way Vietnamese manufacturing firms choose technological or non-technological innovation over the industry life cycle, drawing on a sample of 663 manufacturing enterprises. From that, we aim to raise awareness about how challenges derived from internal and external changes affect the adoption of innovation strategies. The findings suggest that researchers and practitioners should consider the importance of the industry life cycle in the choice of technological or non-technological innovation. Besides, there is no simple winning strategy that exists by simultaneously combining many forms of innovation. In addition, our research has proven that the effectiveness of innovation strategy significantly depends on the institutional context, the surrounding environment, and, more importantly, the business’s existing characteristics when deciding to execute an innovation strategy.
Some limitations of this study should be addressed. The World Bank dataset used in this paper does not cover each type of innovation’s costs and effects. We are limited in comparing specific functions of each class to help managers optimize the options. For instance, great benefits need trade-offs of performance, but even a high cost, especially a change in structure, may negatively impact profits and expenses. Next, applying cross-sectional design in the study of innovation management will face many limitations in causal inference. A clear direction for the future is to use longitudinal designs to subjoin a comprehensive view of the role of technological and non-technological innovation in the manufacturing context. It will be interesting to look at the factors that influence the decision to use innovation tools in different industries. In addition, future studies on planning strategies may refer to the ability to innovate as a determinant of a company’s competitiveness, especially studying the interaction of market orientation and the ability to innovate.
Footnotes
Appendix A. Industry life cycle: Stages And Characteristics is determined by Grant (2016)
Appendix B
The Determination Method of ILC.

| Code | Manufacturing | General statistic office of Vietnam description | Industry stage | |
|---|---|---|---|---|
| Method I a | Method II b | |||
| 15 | Food | Manufacture of food products | G | G |
| 16 | Tobacco | Manufacture of tobacco products | D | M |
| 17 | Textiles | Manufacture of textiles | G | G |
| 18 | Garments | Manufacture of garments | G | G |
| 19 | Leather | Tanning and dressing of leather; manufacture of luggage, handbags, saddler, harness, and footwear | G | G |
| 20 | Wood | Manufacture of wood and products of wood and cork, except furniture; manufacture of articles of straw and plaiting materials | G | G |
| 21 | Paper | Manufacture of pulp, paper, and paper products | G | G |
| 22 | Publishing, printing, and Recorded media | Publishing, printing, and reproduction of recorded media | G | G |
| 23 | Refined petroleum product | Manufacture of coke, refined petroleum products, and nuclear fuel | M | G |
| 24 | Chemicals | Manufacture of chemicals and chemical products | G | G |
| 25 | Plastic & rubber | Manufacture of rubber and plastic products | G | G |
| 26 | Non-metallic mineral products | Manufacture of other non-metallic mineral products | G | G |
| 27 | Basic metals | Manufacture of basic metals | G | G |
| 28 | Fabricated metal products | Manufacture of fabricated metal products, except machinery and equipment | G | G |
| 29 & 30 | Machinery and equipment | Manufacture of machinery and equipment | G | G |
| 31 & 32 | Electronics | Manufacture of electrical equipment | G | G |
| 33 | Precision instruments | Manufacture of computer, electronic and optical products | G | G |
| 34 & 35 | Transport machines | Manufacture of motor vehicles; trailers, and semi-trailers | G | G |
| 36 | Furniture | Manufacture of furniture | G | G |
| 37 | Recycling | Waste collection, treatment, and disposal activities; materials recovery | G | G |
Note. ILC = industry life cycle; G = growing phase; D = declining phase; M = mature phase.
The period for determining the industry life cycle is 15 years, from 2000–2015. Accordingly, five manufacturing industries, and two services industries: Food and Beverages (ISIC Rev. 3.1 code 15), Garments (ISIC code 18), Non-metallic mineral products (ISIC code 26), Fabricated metal products (ISIC code 28), Other Manufacturing (ISIC codes 16,17, 19–25, 27, 29–37), Retail (ISIC code 52) and Other Services (ISIC codes 51 and 72) from World Bank Enterprise Survey are divided into groups from 1 to 15. The method of determination depends on the amount of annual employment growth in the sector, thanks to Tavassoli (2014) methodology. Group 1 had always shown a positive relationship with net employment growth over 15 years. Group 2 also has a positive relationship with net employment growth, but the exception of 1 year. Group 3 has a positive relationship with net employment growth but an exception of 2 years. Finally, Group 15 shows an entirely negative relationship with net employment growth over 2000–2015. After that, the growth life cycle consists of groups of 1 to 5, the mature ILC contains groups 6–9, and the group 10–15 shows the decline phase (the primary method used in this paper).b Similar to the method of determining the industry life cycle through net employment growth, but the embedded measurement is a net entry.
Appendix C
The Summary Data Table for Technological and Non-Technological Innovation.

| Manufacturing in industry growth phase (N = 663) | Number |
SIZE | TECH–INN | NTECH–INN | ||||||||
|---|---|---|---|---|---|---|---|---|---|---|---|---|
| TECH_PROD | TECH_PROC | NTECH_ORGN | NTECH_MART | |||||||||
| Small | Medium | Large | Yes | No | Yes | No | Yes | No | Yes | No | ||
| Food | 136 (100%) |
48 (35%) |
50 (37%) |
38 (28% |
43 (31.6%) |
93 (68.4%) |
43 (31.6%) |
93 (68.4%) |
20 (14.7%) |
116 (85.3% |
38 (27.9%) |
98 (72.1%) |
| Textiles | 20 (100%) |
9 (45%) |
8 (40%) |
3 (15%) |
8 (40%) |
12 (60%) |
7 (35%) |
13 (65%) |
6 (30%) |
14 (70%) |
8 (40%) |
12 (60%) |
| Garments | 136 (100%) |
42 (30%) |
47 (35%) |
47 (35%) |
36 (26.5%) |
100 (73.5%) |
50 (36.8%) |
86 (63.2%) |
21 (15.4%) |
115 (84.6%) |
35 (25.7%) |
101 (74.3%) |
| Leather | 9 (100%) |
2 (22%) |
2 (22%) |
5 (56%) |
3 (33.3%) |
9 (66.7%) |
4 (44.4%) |
5 (55.6%) |
2 (22.2%) |
7 (77.8%) |
2 (22.2%) |
7 (77.8%) |
| Wood | 16 (100%) |
6 (37%) |
10 (63%) |
0 (0%) |
6 (37.5%) |
10 (62.5%) |
7 (43.8%) |
9 (56.3%) |
4 (25%) |
12 (75%) |
6 (37.5%) |
10 (62.5%) |
| Paper | 8 (100%) |
4 (50%) |
3 (38%) |
1 (13%) |
3 (37.5%) |
5 (62.5%) |
2 (25%) |
6 (75%) |
1 (12.5%) |
7 (87.5%) |
1 (12.5%) |
7 (87.5%) |
| Publishing, printing, and Recorded media | 13 (100%) |
7 (54%) |
5 (38%) |
1 (8%) |
6 (46.2%) |
7 (53.8%) |
6 (46.2%) |
7 (53.8%) |
3 (23.1%) |
10 (76.9%) |
5 (38.5%) |
8 (61.5%) |
| Chemicals | 7 (100%) |
2 (29%) |
3 (43%) |
2 (29%) |
3 (42.9%) |
4 (57.1%) |
3 (42.9%) |
4 (57.1%) |
2 (28.6%) |
5 (71.4%) |
3 (42.9%) |
4 (57.1%) |
| Plastic & rubber | 14 (100%) |
4 (29%) |
6 (43%) |
4 (29%) |
5 (35.7%) |
9 (64.3%) |
4 (28.6%) |
10 (71.4%) |
1 (7.1%) |
13 (92.9%) |
3 (21.4%) |
11 (78.6%) |
| Non-metallic mineral products | 128 (100%) |
35 (27%) |
48 (38%) |
45 (35%) |
46 (35.9%) |
82 (64.1%) |
51 (39.8%) |
77 (60.2%) |
29 (22.7%) |
99 (77.3%) |
41 (32%) |
87 (68%) |
| Basic metals | 10 (100%) |
4 (40%) |
2 (20%) |
4 (40%) |
4 (40%) |
6 (60%) |
3 (30%) |
7 (70%) |
2 (20%) |
8 (80%) |
2 (20%) |
8 (80%) |
| Fabricated metal products | 129 (100%) |
57 (44%) |
37 (29%) |
35 (27%) |
48 (37.2%) |
81 (62.8%) |
46 (35.7%) |
83 (64.3%) |
30 (23.3%) |
99 (76.7%) |
42 (32.6%) |
87 (67.4%) |
| Machinery and equipment | 15 (100%) |
7 (47%) |
4 (27%) |
4 (27%) |
2 (13.3%) |
13 (86.7%) |
2 (13.3%) |
13 (86.7%) |
2 (13.3%) |
13 (86.7%) |
4 (26.7%) |
11 (73.3%) |
| Electronics | 6 (100%) |
1 (17%) |
4 (67%) |
1 (17%) |
4 (66.7%) |
2 (33.3%) |
2 (33.3%) |
4 (66.7%) |
1 (16.7%) |
5 (83.3%) |
3 (50%) |
3 (50%) |
| Precision instruments | 0 | 0 | 0 | 0 | 0 | 0 | 0 | 0 | 0 | 0 | 0 | 0 |
| Transport machines | 2 (100%) |
1 (50%) |
0 | 1 (50%) |
1 (50%) |
1 (50%) |
1 (50%) |
1 (50%) |
1 (50%) |
1 (50%) |
1 (50%) |
1 (50%) |
| Furniture | 14 (100%) |
8 (57%) |
4 (29%) |
2 (14%) |
6 (42.9%) |
9 (57.1%) |
3 (21.4%) |
11 (78.6%) |
1 (7.1%) |
13 (92.9%) |
3 (21.4%) |
11 (78.6%) |
| Recycling | 0 | 0 | 0 | 0 | 0 | 0 | 0 | 0 | 0 | 0 | 0 | 0 |
| Total | 663 (100%) |
237 (36% |
233 (35%) |
193 (29%) |
224 (33.8%) |
439 (66.2%) |
234 (35.3%) |
429 (64.7%) |
126 (19%) |
537 (81%) |
197 (29.7%) |
466 (70.3%) |
Appendix D. Variable Definitions is reported from the World Bank Enterprise Surveys ( http://www.enterprisesurveys.org ),2014-2016
Variable Definitions.

| Variable name | Acronyms | Variable construction | Type of answer | |
|---|---|---|---|---|
|
|
Firm’s Age | AGE | In what year did this establishment begin operations? | Year |
| Firm’s Size | Number of employees | 1 = Small >=5 and <=19 2 = Medium >=20 and <=99 3 = Large >=100 |
||
| Top Manager Experience | EXPR | How many years of experience working in this sector does the Top Manager have? | Number | |
| Firm Ownership Structure | STRUCT | What is this firm’s current legal status? | 1 = Shareholding company with shares trade in the stock market 2 = Shareholding company with non-traded shares or shares traded 2 privately 3 = Sole proprietorship 4 = Partnership 5 = Limited partnership 6 = Other |
|
|
|
R & D Make | R&D_MAKE | During the last 3 years, did this establishment spend on formal research and development activities, either in-house or contracted with other companies, excluding market research survey? | 1 = Yes; 2 = No |
| R & D Buy | R&D_BUY | During the last 3 years, did this establishment purchase or license any patented or non-patented inventions or other types of knowledge to develop new or significantly improved products or services and processes? | ||
| Formal Training | TRAIN | During the last 3 years, did this establishment provide formal training to any of its employees specifically to develop and/or introduce new or significantly improved products or services and processes? | ||
|
|
Financial obstacle | FINN | To what degree is a |
0 = No obstacle 1 = Minor obstacle 2 = Moderate obstacle 3 = Major obstacle 4 = Very Severe Obstacle |
| Political Obstacle | POLT | To what degree is a |
||
| Competition obstacle | COMP | To what degree is |
||
| Custom and trade regulation obstacle | TRADE | To what degree is the |
||
| Technological Innovation (TECH–INN) and Non–Technological Innovation (NTECH–INN) | Product Innovation | TECH_PROD | During the last 3 years, has this establishment introduced new or significantly improved products or services? | 1 = Yes; 2 = No |
| Process Innovation | TECH_PROC | During the last 3 years, has this establishment introduced any new or significantly improved methods of manufacturing products or offering services? | ||
| Organization Innovation | NTECH_ORGN | During the last 3 years, has this establishment introduced any new or significantly improved organizational structures or management practices? | ||
| Marketing Innovation | NTECH_MART | During the last 3 years, has this establishment introduced new or significantly improved marketing methods? | ||
| SALE | Sale Growth Rate | SALE | (Total Sales in 2015—Total Sales in 2013) / Total Sales in 2013) | Number |
Acknowledgements
We are thankful to the Three Anonymous Reviewers for their valuable comments, which will help us clarify our results and statements as well as improve the quality of our manuscript to the benefit of a broader readership.
Author Contributions
All authors contributed equally to the manuscript; all authors had approved the final version.
Declaration of Conflicting Interests
The author(s) declared no potential conflicts of interest with respect to the research, authorship, and/or publication of this article.
Funding
The author(s) received no financial support for the research, authorship, and/or publication of this article.