
Abstract
This study aims to survey user-generated content (UGC) from diners in certified green restaurants, discover the green images they recall, and demonstrate the usefulness of applying a probabilistic topic model to comprehend customers’ perceptions. Postvisit online reviews (N = 28,098), in the form of unstructured texts from the TripAdvisor.com website, were used to find freely recalled green-restaurant images. These data were preprocessed with a structural topic model (STM) algorithm to select 51 relevant categories of images. These image categories were compared with the findings of previous studies to discover unique restaurant attributes. Furthermore, a topic-level network and a green-restaurant network were drawn to discover the most easily recallable image categories and their attributes. This machine-learning-based approach improved the reproducibility of unstructured data analyses, overcoming the subjectivity of qualitative data analysis. Theoretical and practical implications are offered for topic modeling methodology along with marketing strategies for restaurateurs.
Keywords
Introduction
Hospitality firms have implemented sustainable—or “green”—practices to respond to customers’ demands for proenvironment corporate action (Aragon-Correa et al., 2015). However, a restaurateur’s commitment to creating a green image by implementing sustainable practices may not always lead to positive outcomes if such practices are not communicated to or noticed by customers (Yadav et al., 2016). The discrepancy between the green image a company seeks to convey to stakeholders and those stakeholders’ actual perceptions may be greater in the restaurant sphere than in other business sectors, partly because many sustainable practices occur back-of-house (Brown et al., 2006). Therefore, restaurateurs may need to isolate and focus on their most effective green practices by uncovering the specific green attributes that customers recognize and appreciate. More importantly, due to limited cognitive capacity, people often do not process all potential attributes at the same time, but rather sort newly acquired information into general image categories within their memories (Fiske & Pavelchak, 1986). Therefore, to understand customers’ true green images, it is required that one first identify whether customers perceive the green attributes and salient green-image categories that are stored in their memories (Keaveney & Hunt, 1992).
Grouping freely recalled responses into various categories can be useful when trying to understand customer-image categories and the attributes relevant to specific stimuli and emotional responses (Wang et al., 2018). In other words, operationalizing images using recalled texts allows researchers to capture comprehensive image elements that go beyond the objective evaluations of predetermined attributes (Andrews, 2017). However, accessing free-recall content may be difficult if there is no obvious data repository. That is, asking participants to recall their experiences about green practices may influence customers’ responses by encouraging them to think about the topic—despite a generalized lack of interest.
Today’s customers are motivated to share their stories about their consumption experiences with the public through social networking and online review sites. Thus, this study analyzed green-restaurant customers’ responses about their dining experiences expressed in their own words by accessing user-generated content (UGC) found on TripAdvisor. This UGC serves as a rich source of company images collectively formed by customers based on their actual experiences.
Extending this background, this study took as its purpose examining customers’ images of certified green restaurants to identify customers’ perceptions without prompting specific green-restaurant attributes. We analyzed customers’ opinions expressed in the form of unstructured text data (i.e., UGC) with topic modeling to discover topical categories or themes from massive amounts of text (Chuang et al., 2014). Moreover, we extended our findings to identify images that can be easily recalled based on the image associative network theory. The specific research questions addressed in this study are as follows:
Literature Review
Green Image and Consumers’ Restaurant Selection Attributes
Jeong et al. (2014) further defined the green image of a restaurant as “the function of green practices that are important for the evaluation of the greenness of the restaurant” (p. 13). Such images may be influenced by customers’ experiences or their prior knowledge about the company (Han et al., 2009). However, Han et al. (2009) focused only on the emotional responses of green-hotel customers and did not consider salient attributes to operationalize the green image. Therefore, this study proposes to conceptualize green images in the restaurant context and recommends a new approach to operationalizing the green-image concept.
A green image has a positive effect on individuals’ perceptions and decision-making, such as their attitudes and satisfaction. However, this aspect remains under debate in the hospitality literature. For example, Han and Kim (2010) argue that customers may not always prefer green facilities due to uncertain or skeptical attitudes toward corporate environmental claims or other service quality attributes, which outweigh green attributes in customers’ minds. Manaktola and Jauhari (2007) also demonstrated that tourists prioritized sanitation over green-business practices, especially when evaluating hospitality offerings.
Consumers consider a multifaceted assortment of service elements in assessing the quality of selected restaurants (Johns & Pine, 2002), and it is vital for restaurateurs to classify these attributes. In existing studies (Liu & Tse, 2018), these attributes have largely coalesced into five categories: food-related, service-related, price/value, atmosphere/convenience, and other.
Review of Green Restaurants
Green restaurants are defined in a variety of ways: they may be those that reduce pollution, implement recycling and composting, target water and energy efficiency, employ sustainable waste management, or provide healthy, locally grown, or organic food options on their menus (Jang et al., 2011). Namkung and Jang (2013) classified restaurants’ green practices into two sectors: food-focused and environment-focused. Despite the environmental impact of the restaurant industry, the majority of hospitality sustainability research has focused on the hotel and lodging industry (Line & Runyan, 2012).
Previous researchers used the theory of reasoned action, theory of planned behavior (Jang et al., 2015), norm activation model (Han & Hwang, 2016), and value-belief-norm theory (Han, 2015) as their theoretical bases for research. These studies have primarily investigated factors or antecedents of customers’ perceptions, satisfaction and attitudes, intentions to visit or to continue patronizing or recommending proenvironmental hospitality operations, and willingness to pay more (Han et al., 2020). The discordant result is that while the number of green restaurants has grown steadily, the scholarship on green-restaurant customers has remained mired in the hypothetical, with actual green diners being largely ignored.
Furthermore, the existing research has mostly employed the traditional qualitative, quantitative, and mixed-method approaches (focus groups, individual interviews, online/offline surveys, scenario-based experimental research). Some of these approaches have been limited because of small sample sizes, leading to a lack of generalizability, while their researcher-derived questions have undermined their capacity to examine subjects’ true motivations and feelings (Namkung & Jang, 2013). The possibility of respondents’ unintentionally reporting inflated ethical drives due to social desirability bias has also been noted (Auger & Devinney, 2007). In addition, it can be hard to generate the latent structures of data sets using traditional content analyses. These challenges can contribute to discrepancies between behavioral intentions and actual behaviors (Kim et al., 2013), with the hypothetical scenarios presented in survey instruments being poor stand-ins for actual customer events. An overview of green-restaurant research is presented in Table 1.
Overview of Recent Relevant Literature on Green Restaurants in the Hospitality Industry.
Note. ANOVA = analysis of variance; MANOVA = multivariate analysis of variance; UGC = user-generated content; SEM = structural equation modeling; PLS = partial least-squares.
Structural Topic Modeling (STM)
The hospitality and tourism research contexts, when employing big-data approaches, have commonly used word-frequency analysis, geovisualization, and sentiment analysis to examine the massive tomes of unstructured UGC made available by the advent of social media (Lu & Stepchenkova, 2015). Among these approaches, topic modeling remains one of the most frequently employed by industry and social-science investigators as they search for latent topics (Kaplan & Vakili, 2015).
A generative probabilistic model has been applied to understand the semantic memory, a mode of memory in which informational nodes are arranged according to their semantic similarities (e.g., Griffiths et al., 2007; Griffiths & Steyvers, 2002, 2003). Topics, which consist of a list of words with a different degree of relevance to a particular target, are considered to be image categories (Griffiths & Steyvers, 2002). Furthermore, the probability distribution of the words indicates the likelihood of particular informational nodes being activated and recalled (Griffiths & Steyvers, 2002). Accordingly, the topics discovered in probabilistic topic modeling are considered to be image categories in memory, and the words belonging to each topic act as the specific attributes relevant to each image category (Griffiths & Steyvers, 2003).
A probabilistic topic model enables the discovery of latent topic structures by analyzing observed vocabulary in documents (Blei et al., 2003). Topic modeling algorithms are applications of machine-learning techniques that produce major themes from large amounts of text data. The algorithm generates collections of semantically coherent words, often called top words, each one an array of words consistent with a certain topic. Topic modeling can also calculate the prevalence of the extracted topics (i.e., topic weights) and the probabilistic association between top words and each topic.
Relevant studies introduced an STM that includes metadata in the estimation model to measure systematic differences in topic proportions and topical content depending on observed covariates (Roberts et al., 2014). This approach takes UGC as an unstructured data set and mines it for unrevealed topics (Roberts et al., 2016). STM attempts to obtain additional strength and enhance predictive power by replacing a global prior with a more flexible distribution (Roberts et al., 2016). This result is to be expected as STM was developed by social scientists, who are mostly interested in testing hypotheses by examining relationships among variables. STM has been popularly adopted in social science literature (Gilardi & Wüest, 2017; Hu et al., 2019). In hospitality and tourism studies, for example, existing studies have used STM to discern relevant service quality elements buried in unstructured customer reviews (Ding et al., 2020), as well as to analyze employees’ online reviews to assess job satisfaction (Stamolampros et al., 2019) and perform satisfaction analyses of hotel visitors. This study implemented STM to discover the salient image categories.
The Image Associative Network Theory
The image associative network theory has been applied widely to understanding the image structure stored in memory and the process of retrieving information encoded in the human mind (Keller, 1993). According to this model, memory is stored in the form of an associative network, which consists of nodes containing information and concepts and relational links connecting these nodes (Anderson, 1983). When the retrieval cues are presented, the informational nodes stored in the human memory network are activated to be recalled (Collins & Loftus, 1975).
“Node” is used to denote the basic element of the memory network, with each node containing a concept related to an entity (Wang & Horng, 2016). A node can be created not only by the direct experience of a product or services but also via vicarious means, including marketing materials and word-of-mouth communication (Keller, 1993). Moreover, the existing nodes tend to be sustained in memory and influence the process of evaluating any new stimulus (Henderson et al., 1998). As mentioned, the informational nodes in the memory network are connected with the relational links. If a node is linked to a high number of other nodes, its associated image can easily be recalled, whereas loosely connected image associations are further out of mind (Anderson, 1983; Keller, 1993). Therefore, the strength of image association indicates the likelihood of image nodes being activated from memory (Teichert & Schöntag, 2010).
According to a spreading activation theory, when a particular image association is activated, the activation spreads to other image associations to which it is strongly connected through relational links (Anderson & Pirolli, 1984). As the strength of these relational links determines the quality and quantity of spreading activations from activated image association to other image associations, it also determines the likelihood of an image association being activated and recalled (Gensler et al., 2015). Wang et al. (2018) incorporated a concept called core periphery into the destination image network map to discover which image nodes have the highest likelihood of being recalled.
The application of this network mapping on freely recalled texts shared by actual customers is useful for discovering the specific attributes that are memorable to customers. Still, most previous studies regarding green restaurants chose to use predetermined measurements. In contrast, this study used stories shared by actual restaurant customers to capture their memorable experiences and reshape them into a network formed from unstructured texts.
Method
Sample
This study examined postvisit reviews of green restaurants. Customer reviews of green restaurants that have been certified by the Green Restaurant Association (GRA). GRA is an international nonprofit organization with comprehensive certification standards, including both food- and environment-focused green practices (Schubert et al., 2010). For the restaurants to be certified, they must have implemented a certain degree of green practices according to various sustainability standards. Most of the green restaurants certified by GRA are located in the United States, particularly in California, Illinois, Pennsylvania, Texas, and New York, the states with most green restaurants. A list of 618 certified green restaurants (as of August 22, 2018) was obtained from the GRA website (www.dinegreen.com). Among various consumer review websites, this study chose TripAdvisor, the largest travel review site worldwide, as its data source because it boasts more than 859 million reviews (TripAdvisor, 2020). Out of 618 certified green restaurants, 128 commercial, noncatering restaurant operations were available on TripAdvisor. All 37,052 UGC reviews written for these 128 restaurants were collected from TripAdvisor in February 2019 using a Python-based web crawling tool. Among these, reviews written before March 2014 (i.e., those more than 5 years old) were removed. To ensure the reviewers had experienced a green-restaurant practices, only reviews written after a particular restaurant achieved certification with the GRA were included in the final sample. Furthermore, restaurants with fewer than 50 reviews were excluded from the sample to ensure the effects of the green-restaurant characteristics were derived from a sufficient number of reviews. Consequently, the final data set stretched across 60 months (March 2014 and February 2019) and featured 25,098 customer-produced reviews covering 70 GRA-certified restaurants. The sampling procedure is displayed in Figure 1.

The process of sampling.
Text Preprocessing and Data Analysis
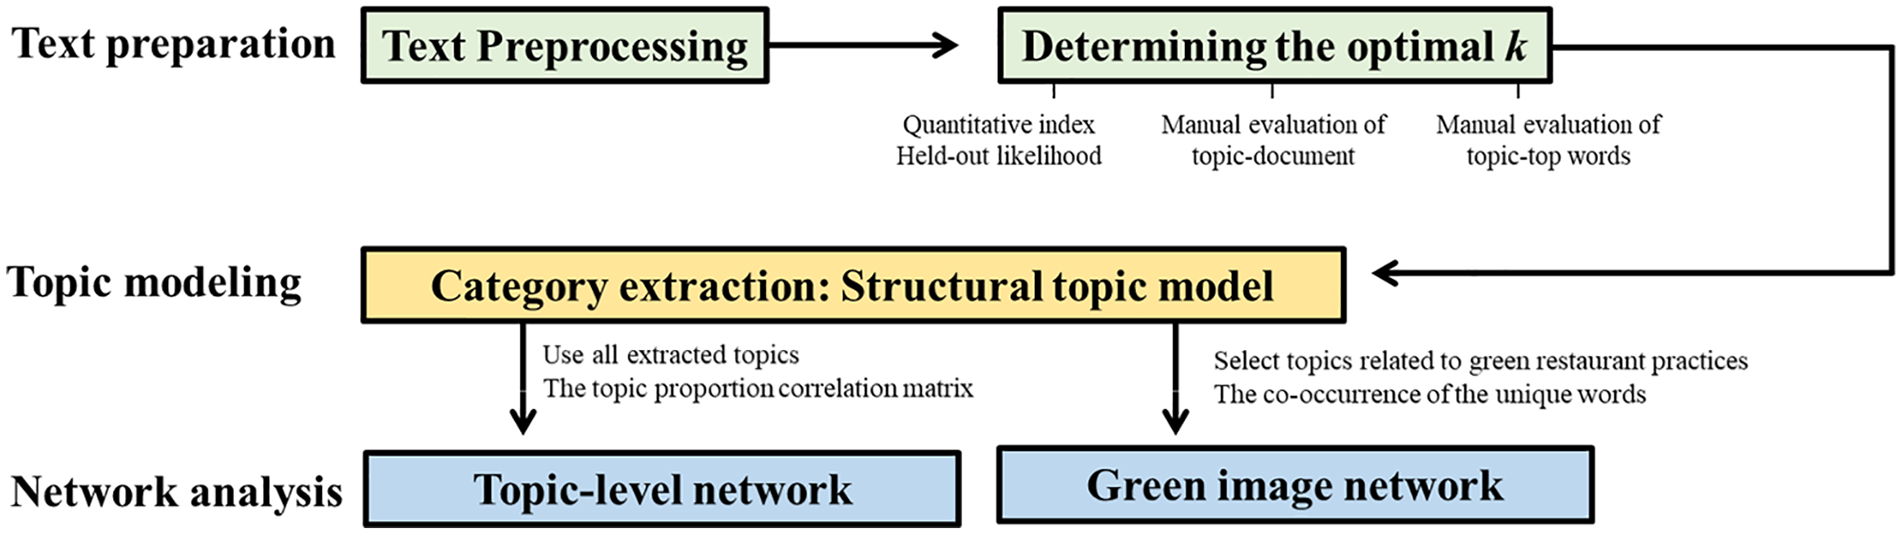
To uncover the major categories underpinning this massive amount of UGC, STM (a topic modeling technique) was employed (Roberts et al., 2014). Before conducting STM, text preprocessing was conducted to prepare the corpus for text mining, all in line with the model set forth by Park et al. (2018). Creating context-specific stop words was necessary to improve the topic quality of the data set by removing words that appeared frequently but were not meaningful (Wallach et al., 2009). Word frequency was conducted with online reviews to come up with these stop words. For example, due to nature of restaurant reviews, food names frequently appeared in reviews, which led many topics related to types of menus, not green-restaurant practices. Since this study aims to discover salient perceptions about restaurants attributes, including green practices, researchers decided to remove menu item and food names. Along with these stop words, the authors reviewed a list of other frequent stop words, such as prepositions (e.g., across, over) and adverbs (actually, however), and removed them. The four quantitative indices (i.e., held-out likelihood, residuals, semantic coherence, and lower bound) were compared to determine the optimal k value. Based on a rough approximation, the performances of topic models with a varying number of k were compared, and k = 51 was determined to be optimal.
Content Analyses
Topic modeling automatically generates a collection of vocabulary with different probabilistic associations for each selected topic; however, topics generated by the topic modeling need to be labeled manually. Previous studies using topic modeling have usually labeled topics based on top words only. To improve comprehension of the topics, this study conducted additional manual content analyses. Two researchers independently reviewed 20 top words and 20 documents closely related to each topic (i.e., the reviews with the highest topic proportion in each topic) to determine the preliminary labels. After the researchers separately named the preliminary label for each topic, the initial labels were compared. If the topic labels were not consistent between the two researchers, the researchers discussed them until they reached consensus on the labels.
Network Analysis
To test spreading activation with freely recalled responses among green-restaurant customers, a topic-level image network was created using the topic proportion correlation matrix (N = 25,098 reviews, 51 topics). The igraph software package in R was used to visualize and obtain the network statistics. The threshold for the topic correlation was set at 0.1, and the edges below the threshold were dropped for the network visualization (Roberts et al., 2016).
The low-level green-image networks (N = 696) were examined by creating a green-image network with online reviews closely related to two green topics (T10 and T37). To create this green-image network, the appearances of unique terms in multiple green-restaurant reviews were tabulated and evaluated. In the green-image network, the nodes are the unique words that represent low-level image associations, and the ties connecting nodes represent the associations among these unique words. Gephi software was used to visualize the green-image network with the unique terms that appeared more than 50 times in the corpus.
Based on the understanding of how nodes flow in the network, an appropriate centrality metric should be chosen to measure the strength of the image association (Wasserman & Faust, 1994). Eigenvector centrality counts the circuitous trajectories and paths nodes visit multiple times (Borgatti, 2005) and enables researchers to measure the influences of long-term and indirect links (Wang et al., 2018). Therefore, this study selected the eigenvector to measure the strength of image association among various centrality measures. The process of data analysis was summarized in Figure 2.
The process of data analysis.
Results
Data Profile
Descriptive characteristics for certified green restaurants (N = 70) and customer reviews (N = 25,098) were identified. The majority of certified green restaurants (N = 58) averaged 4.0 or 4.5 stars in their TripAdvisor ratings. On average, the restaurants had been certified for 6 years (M = 6.2, SE = 3.1), with the longest period of certification being 12 years. To be certified, the restaurant must earn green points by meeting certain environmental standards, and GRA’s star ratings are dependent on these green-point totals. The majority of the certified restaurants (N = 35) attained GRA’s three-star rating.
Topic Modeling: Discovery of Image Categories
Topic modeling was applied to the 25,098 reviews of certified green restaurants to discover salient and frequently noted image categories. Among 51 salient topics discovered from STM, multiple topics represent the same attributes but contained different emotional states. Therefore, the topics were categorized into the following high-level dimensions: four general restaurant attributes (i.e., value, service, atmosphere, and food), green attributes, overall restaurant experience evaluation, and behavioral intentions. A summary of topics is presented in Table 2.
Overview of Topics: Top Words and Topic Weights.

Among the four general restaurant attributes, the number of topics assigned to the food-quality dimension was the highest, accounting for 19.1% of the total topic weight, followed by the service quality dimension, which represented 16.4% of the total topic weight.
In the food-quality dimension, which boasted 10 topics, several topics (Topics 5, 15, and 50) regarded customers’ perceptions about good flavor, but their latent intentions or perceptions associated with these topics were varied. For instance, the top words associated with topic 15 were sweet, satisfy, rich, and creamy. These top words contained vocabulary to describe food flavors and tastes, capturing people’s positive evaluations toward their flavor. In the case of Topic 50, the top words were love, eat, yummy, and place. These words were closely related to people’s emotional satisfaction with flavor and their choice of restaurant selection. Finally, top words for Topic 5 included delicious, back, and went, indicating that this topic is associated with good flavor stimulating customers’ willingness to come back in the future. Topic 11 was also related to food flavor, but included top words related to poor-quality foods, such as dr(y), burnt, and overdone.
Within the service dimension, there were several topics regarding service quality, which contained positive sentiments (e.g., knowledgeable employees [T32], attentive staff [T38]) and negative sentiments (e.g., slow service [T6], inattentive service [T46]). The topic model also extracted topics regarding restaurant atmosphere, such as location (T47) and background music (T20). The value-related topics demonstrated that customers’ evaluation of value was often situation specific.
Two topics related to green practices also emerged, such as local/organic ingredients (T10) and vegetarian/healthy option (T37). GRA notes that serving vegan or vegetarian dishes may reduce harmful environmental impacts (GRA, 2020), and, therefore, this study considered the vegetarian/healthy option (T37) as a pertinent green topic.
To find contrasts within the image categories discovered from UGC and findings of the previous research using the traditional research methods, the topics extracted from STM were compared with the restaurant attributes identified from previous studies (see Table 3).
A Comparison of Topics Derived From STM and Measurement Items Found in Previous Studies.
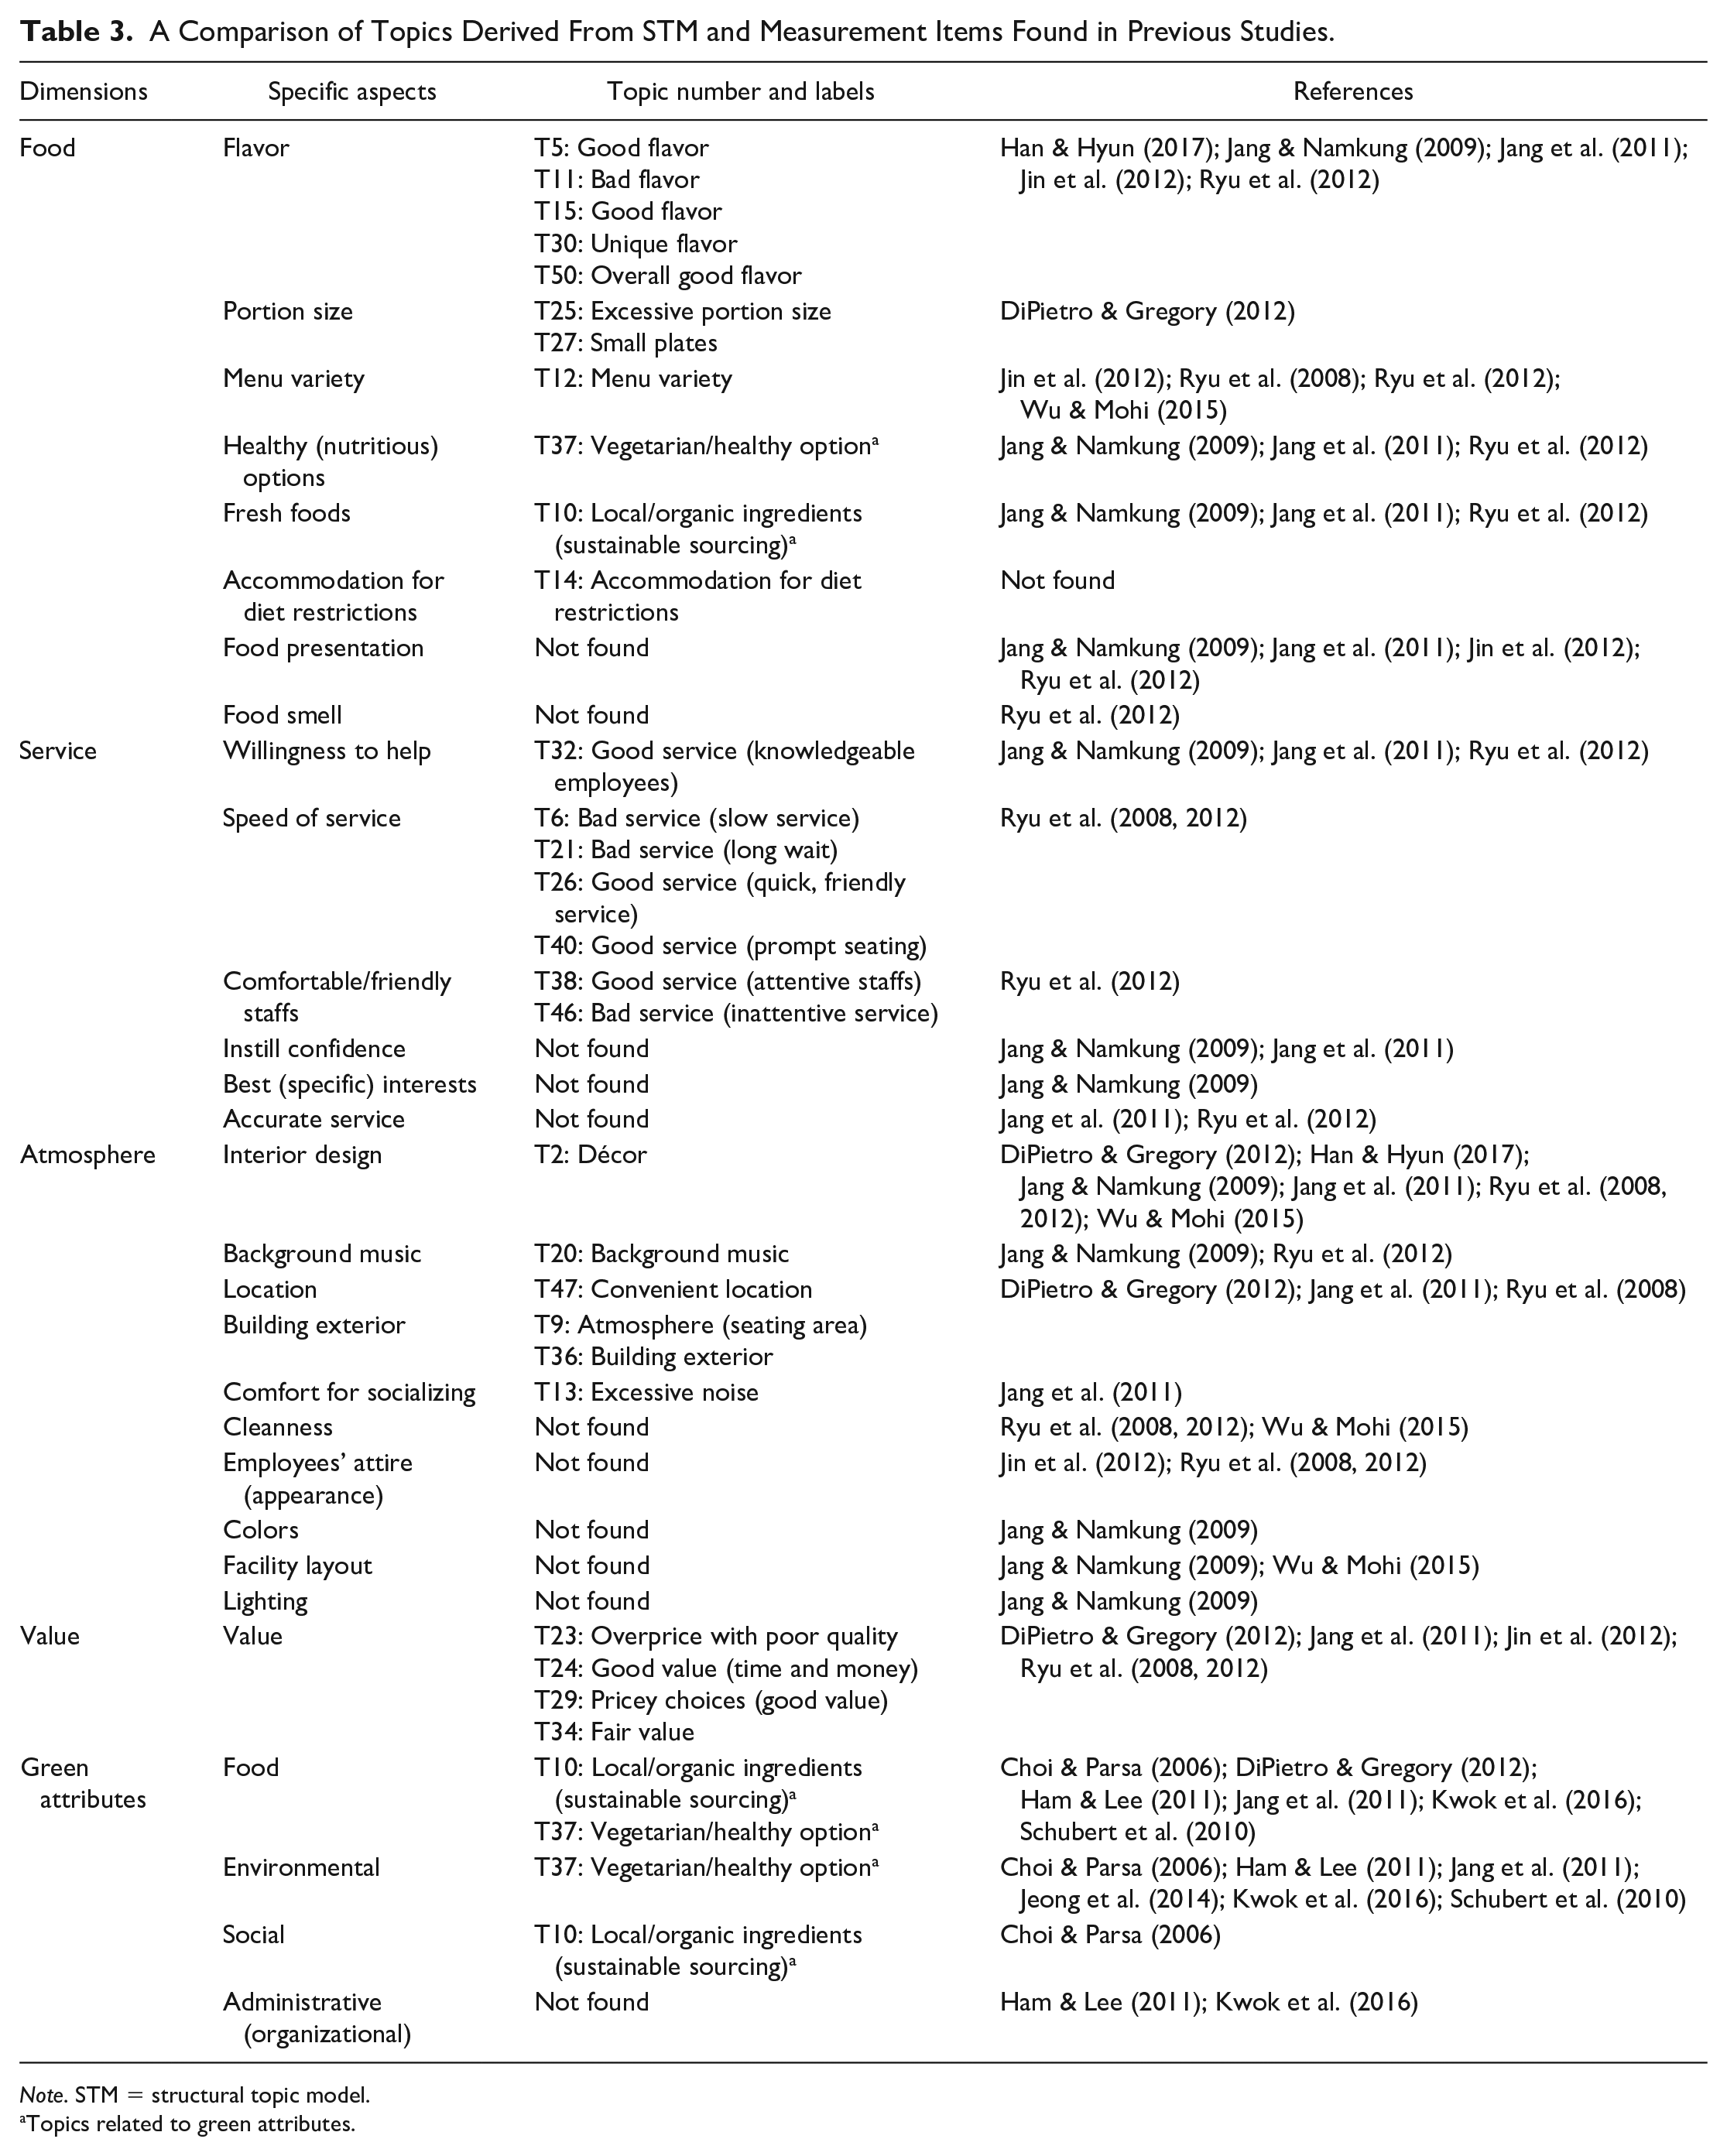
Note. STM = structural topic model.
Topics related to green attributes.
Topic-Level and Image-Level Networks
The associations among topics were estimated by creating a topic network (see Figure 3). According to the topic proportion correlation matrix, the average eigenvector centrality for the 51 topics was 0.24. The size of nodes and labels of the image network were proportional to the eigenvector centrality scores, and the detailed information about the topic network can be found in Table 4. Two topics had centrality scores greater than 0.9, Topic 44 (customer satisfaction) and Topic 5 (good flavor). There were 17 topics with eigenvector centrality scores between 0.8 and the average centrality score, 0.24. These topics pertain to customers’ evaluations of general restaurant attributes (e.g., good service [T32 and T38] and good flavor [T50]) and overall evaluation of restaurants (e.g., positive experience [T51] and satisfaction [T4]). Finally, we found 32 topics with centrality scores lower than the average centrality, which were related to objective descriptions of specific restaurant attributes (e.g., building [T36], location [T47]). Specialized topics related to green-restaurant practices had low centrality scores, and they were separated from the common restaurant attributes that shaped a tight and sizable subgroup (Figure 4).

The topic-level image network.
Topic Weights and Eigenvector Centrality of Image Categories in the Topic-Level Network.


The image network related to green-restaurant practices.
In the green-image network, positive words—such as good, excellent, great, and wonderful—frequently appeared and had the highest eigenvector centrality. Especially, customers related to green practices as healthy and fresh, which can be related to health-related benefits. Also, people found the green menus as delicious. In the green-image network, terms regarding ingredient sourcing (e.g., local, farm [to] table) and vegetarian/healthy options also had high eigenvector centrality. According to the topic-level and the green-image networks, green-restaurant practices serve as a unique restaurant attributes that are distinct from the common restaurant attributes, but they tend to trigger positive sentiment.
Conclusion and Implications
To advance scholarly inquiry, this study analyzed freely recalled customers’ postvisit green-restaurant reviews to capture green-restaurant images that are context specific. To answer its first research question, which sought to identify salient image categories about green restaurants, the study sampled UGC written by actual green-restaurant customers and analyzed it using topic modeling to discover prevalent themes shared across customers. The prevalent themes discovered from green-restaurant reviews may represent most memorable image categories in relation to their green-restaurant experiences. This study found that most online review content consisted of customer appraisals of specific restaurant attributes. To answer the second research question, which focused on the image categories frequently mentioned by green-restaurant customers, the topic weights were compared. A topic modeling algorithm can generate topic weights, which indicate how frequently each topic was mentioned in each review. Each review-level topic weight can be converted into a document-level topic weight to demonstrate topic popularity. In other words, topics with high topic weights were more likely to be mentioned by green-restaurant customers. This quantified index of topic weight can represent the image categories that many green-restaurant customers are likely to perceive. Among the core restaurant attributes, the topic weights related to food quality were the highest and had high topic centrality, indicating that food quality was the most salient core restaurant attribute, as suggested by Ryu et al. (2012). Finally, the last research question, which inquired into the specific image elements associated with the categories relevant to green practices, was answered by discovering topics related to green practices. Although the certified green restaurants in the sample implemented various environment-focused green practices (i.e., recycling, waste reduction), only food-focused green practices appeared in UGC. This finding is in line with prior research that showed food-focused attributes to be prioritized by restaurant customers (Jang et al., 2011). In a similar way, reviewers were less likely to mention restaurants’ participation in green certification programs. Less than 3% of customers who visited a certified green restaurant were later able accurately to identify the eatery’s certification information, indicating a lack of customer interest in certification programs and/or a lack of visibility for certification participation (DiPietro et al., 2013). DiPietro et al. (2013) also found that customers perceived the implementation of green practices in a restaurant operation to be more important than attaining any official green certification.
Based on the image categories discovered, the green-image network structure stored in customers’ memories was identified and analyzed. In terms of the recallability of image categories by spreading activation, positive image categories tended to be retrieved more easily than negative image categories. There was an inconsistency between the frequency and the eigenvector score because some of the image categories people frequently mentioned in UGC were not central in terms of spreading activation (Wang et al., 2018). For example, the image categories containing negative sentiment, which had the relatively high topic weights, were sparsely connected to other image categories. In other words, customers who experienced service failures and expressed negative feelings tended to focus on the negative aspects and rather than talk about other restaurant attributes.
Only a limited number of studies have targeted UGC related to green-restaurant customers at online review sites. Compared with previous studies that used qualitative and quantitative approaches (e.g., surveys, interviews, and focus groups), this study was able to feature far more review texts from a much greater number of actual customers. Postvisit online reviews contain freely recalled experiences shared by actual customers without being prompted by researchers, which may inadvertently stimulate participants’ responses. Hence, the sample of this study may have less inherent selection biases than a convenience sample may entail (Grimmer, 2015; Roberts et al., 2016).
This study used its topic modeling algorithm to investigate green-restaurant customers’ cognitive processes and memorable attributes and emotions. Topic proportion was used as a proxy of the popularity and importance of the topic (Guo et al., 2017). In addition, the topic-level image network was drawn to understand spreading activation among the high-level cognitive units (Anderson, 1983). The spreading activation model suggested the strength of image associations determined the likelihood of image retrieval (Lai & Li, 2012). The strength of image associations measured by the eigenvector centrality allowed authors to discern what restaurant attributes were more important and readily recallable than others (Wang et al., 2018).
The customer review content analyzed here provides a series of practical implications for the restaurant industry. The findings of this study show how restaurant operators can influence their customers to shape a positive image by understanding the salient and recallable images. For example, the number of online reviews containing environment-focused green practices was significantly lower than that for reviews of food-focused green practices, suggesting the low visibility of and/or low interest in environment-focused green practices. This confirmed supposition of previous studies about the low visibility of environment-focused green practices in restaurants (Namkung & Jang, 2013). Arguably, restaurant practitioners interested in harnessing the power of green trends should, therefore, focus on green-food innovations to create and sustain a customer-pleasing green image. Considering the significant efforts required for green-restaurant certification through environment-focused green practices, restaurateurs should publicize such efforts as recycling or composting through various media, social networking, in-restaurant displays, or employee training. Given that customers tend to shape an image even before they visit a restaurant (Bae et al., 2017), promoting environmentally friendly initiatives on social media or via review platforms can improve customers’ awareness. Once customers, drawing on preexposure information, form the impression that a restaurant operates in a sustainable manner, they may maintain a positive stereotype about that restaurant, intensifying customers’ personal attention to environmentally friendly practices (Reynolds & Oakes, 2000).
Because this study’s sample of reviews was gathered from only one website (TripAdvisor.com), the findings of this study are limited to that online platform’s base of patrons. Future studies could combine review data from multiple online review platforms for a more broad-based data analysis. We can also recommend using other types of data sources, such as open-ended surveys or the integration of both surveys and big-data analytics to overcome limitations. They may consider employing on-site surveys to broaden the sample with respondents who may not use social media or cannot access the internet. Because this research considered only reviews written in English for its data analysis, future research targeting reviews written in other languages would provide fascinating contrasts. Similarly, this study explored strictly those green restaurants certified by the GRA. Therefore, follow-on projects could include other types of certified restaurants. They may choose to explore differences in consumer attitudes and images based on further topic modeling covariates, such as demographic characteristics. Finally, this study analyzed online reviews of certified green restaurants only in the United States. Examining customer reactions to restaurants in other countries may provide broader insights into sustainable restaurant practices.
Footnotes
Declaration of Conflicting Interests
The author(s) declared no potential conflicts of interest with respect to the research, authorship, and/or publication of this article.
Funding
The author(s) received no financial support for the research, authorship, and/or publication of this article.