
Abstract
This study investigates how economic and political uncertainty spillovers influence corporate equity volatility in Vietnam. Using dynamic panel estimators addressing endogeneity, the study shows that uncertainties from advanced, emerging, and low-income countries markedly amplify stock return volatility in Vietnam. Similarly, uncertainty from Africa, Asia-Pacific, Europe, Central Asia, the Middle East, and the Western Hemisphere exerts destabilizing effects. However, some of these effects are only significant under an estimator accounting for endogeneity and the dynamic structure of panel data. The study also examines firm-level heterogeneity, which shows that corporate liquidity reduces exposure to spillovers from low-income economies and Africa while government ownership buffers the impact of uncertainty from Asia-Pacific. The findings provide valuable insights for investors, corporations, and policymakers when formulating decisions under the influence of uncertainty spillovers.
Keywords
Introduction
Over a decade after the U.S. global financial crisis, subsequent events such as the European debt turmoil and the Greek fiscal crisis have demonstrated how disturbances originating in a single economy can spread internationally, unsettle financial markets, and hinder economic growth (Fiechter & Zhou, 2016; Podmajerska, 2016). Consequently, uncertainty and its effects have attracted growing scholarly interest (Nguyen & Bao, 2025). Uncertainty in one country or region can spill over to global financial markets (Nguyen, Bao, Le, & Nguyen, 2025; Nguyen, Bao, Tran, & Le, 2025) and heighten the transfer of risks stemming from irregular developments across several nations (Bernal et al., 2016).
Although research on uncertainty has expanded rapidly, important limitations remain. Much of the literature emphasizes economic policy uncertainty and gives less attention to broader measures that incorporate both economic and political dimensions (Karanasos et al., 2022; Shi & Wang, 2023). Many analyses were conducted at the market level, leaving the heterogeneity of firm level responses largely unexplored. Evidence also tends to center on a few large economies as the dominant sources of spillovers (Wang & Xiao, 2023; Yang et al., 2021), which limits understanding of how uncertainty from groups of countries, classified by income or region, can affect other markets. Finally, the potential moderating role of firm level attributes, including liquidity and state ownership, has rarely been examined, leaving the channels through which uncertainty is transmitted insufficiently understood.
Against this backdrop, Vietnam provides a particularly compelling case for investigation. Being among Asia’s fast-growing emerging economies, Vietnam has combined rapid growth with deep global integration. By 2023, total trade had risen to roughly 166% of GDP (World Bank, 2025), which places Vietnam as one of the most globally integrated economies and makes it highly exposed to external turbulence. The Ho Chi Minh City Stock Exchange (HOSE) stands as the flagship market for Vietnam and holds a prominent position within Southeast Asia. The stability of this market is closely linked to the country’s long term growth prospects, since orderly equity markets are vital for sustaining investment and channeling capital efficiently in emerging economies (Ngare et al., 2014). In this context, firm level volatility in stock returns provides an essential signal of financial resilience, capturing changes in investor sentiment (Rupande et al., 2019) and perceptions of risk (Du et al., 2025). Moreover, Vietnam’s transition economy characteristics, including a bank centered financial system, significant state ownership, and a large retail investor base, mean that external shocks may be absorbed, amplified, or transmitted in ways that differ from other emerging markets. Understanding these dynamics is therefore of both scholarly and policy relevance.
This study examines how uncertainty spillovers from other economies and regions affect the volatility of Vietnamese firms’ stock returns using a firm level analysis. Specifically, the study investigates three questions: (i) how uncertainty in low income, emerging, and advanced economies affects volatility in Vietnamese stock returns, (ii) how uncertainties arising from Europe, the Western Hemisphere, the Asia-Pacific region, the Middle East and Central Asia, as well as Africa, contribute to fluctuations in Vietnamese stock return volatility, and (iii) how firms may respond differently to these spillover effects.
The importance of this study can be viewed from multiple dimensions. First, it moves beyond single major economies by systematically examining uncertainty spillovers grouped according to economic status, ranging from advanced to emerging and low-income countries and according to economic regions (Africa, Europe, Asia-Pacific, the Western Hemisphere, and the Middle East with Central Asia). Second, it adopts a firm level analytical approach to identify how corporate characteristics moderate spillovers. This research shows that firm liquidity and state ownership can moderate the intensity of transmission in specific contexts. Third, it contributes to theory by empirically validating the idea that global turbulence can have significant implications for an emerging market. Fourth, it contributes new insights from Vietnam, an emerging transition economy characterized by rapid growth and openness yet rarely examined in the uncertainty spillover literature. Based on the findings, the study offers practical implications for investors, corporate managers, and policymakers.
The structure of the paper is as follows. Section “Literature Review” develops the theoretical background, examines prior empirical evidence, and identifies research gaps. Section “Research Methodology” covers the data, variable construction, and methodology. Section “Empirical Findings and Discussion” delivers the empirical analysis and discussion. Section “Conclusion” concludes by summarizing the findings, drawing practical implications, and acknowledging limitations.
Literature Review
The nexus between uncertainty spillovers from abroad and fluctuations in Vietnam’s stock returns can be theoretically framed through the contributions of Dornbusch et al. (2000), Forbes and Rigobon (2002), Dixit and Pindyck (1994), and Bloom (2009).
Dornbusch et al. (2000) argued that there were several channels through which uncertainty in one nation could spread to another. Specifically, the identified channels were through trade partnerships, the dependency of global financial markets and contagion of investor behaviors. Given the nature of the Vietnamese economy, which has becoming more globalized and globally connected, the potential channels for the spillovers become wider and visible. Hence, turbulence in other economies and regions can spread to Vietnamese economy. Such perspective is supported if the perspective of Forbes and Rigobon (2002) is incorporated. In specific, financial markets were argued to be heavily dependent as there were comovements happening constantly. Such comovements existed in both stable and turbulent periods but became more pronounced during crises due to increased volatility clustering.
The real options theory (Dixit & Pindyck, 1994) suggests that investment decisions of firms are not only driven by the expected returns but also by the value of waiting for additional information to come up before making the decisions. In essence, firms treat investments as options that can be deferred or postponed if the business environment becomes uncertain. Such behaviors could lead to delay in decisions and impose uncertainty in the future cashflows and earnings of firms. Since current price of stock reflects the present value of expected future cashflows, which is discounted at the risk-adjusted rate (Gordon, 1962; Williams, 1938), the elevated uncertainty in future cashflows and earnings increases the risk-adjusted rate. Such changes in risk premium lead to higher fluctuations in stock prices and increased volatility in stock returns.
Bloom (2009) provided additional insights by stating that the effects might be heterogeneous depending on the context and situations of firms. Specifically, there could be certain factors of firms that could alleviate or exacerbate the impacts of uncertainty, which requires further empirical examination. Among the factors, importance of liquidity during crises has been well-documented. For instance, Benmelech et al. (2017) demonstrated that access to liquidity enabled firms to sustain investments and reduce real economic losses. On the supply side, Cornett et al. (2011) found that banks facing liquidity pressures reduced their lending activities, further emphasizing how firm-level liquidity and systemic credit conditions jointly determine corporate resilience in crisis periods. Besides, Chen and Chang (2013) analyzed the behaviors of firms in emerging markets for a 26-year period and found that majority of firms in emerging economies held more cash during financial crisis. Such increase was suggested to be due to the additional that firms gained during crisis when holding more cash as well as due to the extraordinary benefits of saving compared to spending. Accordingly, firms holding more cash during the crisis were found to experience enhanced value-adding effects after the financial uncertainty. Tascón et al. (2024) highlighted that corporate liquidity played a crucial role in preserving firms’ financial stability during the COVID-19 period. Further, state-owned enterprises (SOEs) may enjoy strategic advantages during turbulent periods. Prior studies underline the role of state-owned enterprises (SOEs) in enhancing economic resilience. Assagaf and Ali (2017) demonstrated that government subsidies enabled SOEs to sustain superior financial outcomes compared to private firms, while Qi et al. (2025) further revealed that SOEs contributed to economic stability during the COVID-19 crisis in China.
Existing empirical evidence shows that studies on uncertainty spillovers in financial markets are predominantly centered on how influential nations disseminate their financial shocks. The influential power of countries could be used to classify the research strands. In essence, a country can have either absolute or relative influence on other nations. Countries such as the US or China can be regarded as having absolute influences while a few other nations can be regarded as possessing relative importance to other countries depending on their trade dynamics.
Regarding a specific country that can spread its uncertainty to other countries, the US is a prominent source of cross-border uncertainty. Elevated U.S. EPU heightens volatility in Asia and domestically via direct and indirect channels (Karanasos et al., 2022). Its predictive power for foreign equity markets persists, but magnitudes depend on bilateral ties and the recipient market’s development (Balli et al., 2021). China has emerged, alongside the US, as a major source of uncertainty spillovers. Shi and Wang (2023) find both Chinese and US EPUs forecast global volatility, with US effects most pronounced in 2008. East Asian impacts are heterogeneous and typically weaker for China (Wang & Xiao, 2023). Regionally, China anchors EPU spillovers, whereas the U.S. acts as the global intermediary (Yang et al., 2021). Beyond the US and China’s global reach, regional hubs matter: Korea and Singapore in Asia (Chancharat & Chancharat, 2024); Germany in Europe (Clausen et al., 2019); and Qatar and Saudi Arabia in MENA, via geopolitical and market channels (Elsayed & Helmi, 2021). Evidence shows that, via trade, financial ties, and investor behavior, even low- and middle-income economies can transmit uncertainty, for example, effects on Spain from Latin America (Ghirelli et al., 2021).
Although extensive research links uncertainty spillovers to stock-return volatility, key gaps remain. First, work has centered on economic policy uncertainty, with far less attention to broader economic and political uncertainty, leaving their cross-border effects underexplored. Second, market-level designs dominate; this overlooks firm-level heterogeneity in responses to shocks highlighted by Bloom (2009) and omits firm characteristics that practitioners can leverage to mitigate spillovers. Third, studies often treat single countries, for example, the U.S. (Wang & Xiao, 2023), China (Yang et al., 2021), Germany (Clausen et al., 2019), or South Korea (Chancharat & Chancharat, 2024), as dominant sources; few consider country groups or regions, even though “less-influential” partners can transmit shocks to larger economies (Ghirelli et al., 2021). Fourth, most critically, evidence is absent for Vietnam, leaving stakeholders without guidance for risk management and policy under deepening globalization.
Addressing these gaps, this study focuses the impacts of uncertainty spillovers from different types of economies, regions on volatility in Vietnamese equity returns and the moderating roles of firm liquidity and ownership of state.
Research Methodology
Variables and Data
The dataset we used for the study was constructed from several sources. In specific, the sources for data included the annual reports of listed firms for controlled variables, history of their associated stock prices for corporate stock returns volatility calculation, the databases of the World Bank and the International Monetary Fund for controlled variables and the dataset of Ahir et al. (2022) for the WUI indices. With respect to firm selection, the sample consisted of companies listed on the Ho Chi Minh City Stock Exchange (HOSE), given that it represents the largest stock trading platform in Vietnam. In terms of timeframe, the dataset covers annual observations from 2014 to 2023, except for stock prices and the uncertainty indices constructed by Ahir et al. (2022). As for history of stock prices, they were collected monthly for a 10-year period from January 2014 to December 2023. As for the uncertainty-based indices of Ahir et al. (2022), they were collected on a quarterly basis. To address potential bias from extreme values, the data were winsorized at the 1st and 99th percentiles.
The control variables included in this study comprise size of firm in total assets (FAST), the degree of financial leverage measured by ratio of debt-to-equity (FFIN), the level of liquidity proxied by the assets-to-liabilities ratio (FLDT), whether the firm was owned by the government or not (FGOV), national GDP (NGDP), national lending interest rate (NLIR) and whether there was COVID-19 going on in the country during a year or not (NCVI). Among these variables, FGOV and NCVI are dummy variables taking the value of either 0 or 1. FGOV of firms with any percent of government ownership took the value of 1 and vice versa. NVCI was assigned a value of 1 for the years affected by the pandemic in Vietnam, spanning 2020 to 2023.
The key explanatory variables in the model are the WUI indices. In terms of calculation and scope, the World Uncertainty Index (WUI) reflects both economic and political uncertainty, as it is constructed based on textual analysis of country reports published by the Economist Intelligence Unit (EIU), which focus on macroeconomic and political conditions (Ahir et al., 2022). Specifically, the index measures the frequency of the word “uncertain” (and its variants) as a percentage of total words in each report. This percentage is then multiplied by 1,000,000 for scaling purposes. Higher WUI values indicate higher levels of uncertainty. For illustration, the fluctuation global WUI in accordance with global crises can be observed in Figure 1.

Global WUI fluctuations from 1990Q1 to 2020Q2.
In our study, we use GDP-weighted averages of WUI across countries, grouped by income level and region, as provided by the original dataset of Ahir et al. (2022). Since the scope of the study was to assess the comprehensive spillovers from different economies and regions, the WUI for each economy and region was used. As for the economy-based approach, the indices were computed for advanced economies (WADV), emerging markets (WEME), and economies with low-income (WLIC). As for the region-based approach, the indices were calculated for different regions including the Africa region (WAFR), the Asia-Pacific region (WASP), the Middle Eastern and Central of Asia region (WMEA), the European region (WERP), and the Western Hemisphere region (WWHM).
These country-specific and region-level indices serve as proxies for economic and political uncertainty within their respective economies and regions. As they are originally reported on a quarterly basis, the indices were transformed into annual measures by computing the arithmetic average of the four quarterly values. All the countries that were included in the formulation of these economy-based and region-based indices can be found in Table 1.
List of Countries Incorporated in the Formulations of Economy-Based and Region-Based Uncertainty Indices.

Source.Ahir et al. (2022).
The primary explained variable, which was volatility in stock returns (VSR), was derived through four distinct methods to ensure robustness and reflect multiple dimensions of measurement. The demonstration of the methods used to formulate VSR is presented in Equations 1 to 4.


In Equation 1, the formula resembles the approach of Parkinson (1980) in calculating volatility of equity returns. Within the equation,
In Equation 2, the formula resembles the Generalized Autoregressive Conditional Heteroskedasticity (GARCH) technique in calculating volatility in equity returns, which was adopted from the work of Bollerslev (1986). Within the formula,
The primary parameters in Equation 2 are α, β, and ω, which indicates the impacts of one-period lagged squared returns, one-period lagged volatility and long-term variance. There are, indeed, no fixed values for these parameters. However, Engle and Patton (2001) highlighted the common ranges for α was from .05 to .3 and β was from .6 to .95 based on financial data. Further, Hansen and Lunde (2005) suggested that the sum of α and β should be approximately 1 while Alexander (2008) indicated that ω primarily ranged from .00001 to .0001 in financial data. Within the context of the study, we set the values of α, β and ω at .1, .85 and .0001 respectively aimed at capturing volatility patterns over the short and long horizon, based on monthly stock price observations. The volatility indicator obtained from the GARCH (1,1) approach was then multiplied by 12 to annualize the index.
In Equation 3, volatility in stock returns was calculated by the Exponentially Weighted Moving Average (EWMA) approach as suggested by Longerstaey and Zangari (1996). Within the approach, data regarding stock prices in recent periods plays a more important role compared to stock prices in past periods. In essence, λ is the smoothing factor representing the decay level at which past data becomes less significant while
As for the value of λ, Longerstaey and Zangari (1996) suggested the value of approximately .94 for daily stock price data and .97 for monthly stock price data while Bollen (2015) stated that the most suitable smoothing parameter should be .88. Since our data comprises monthly price, the values smoothing parameter at .97 and .88 were both suitable. Hence, we take the arithmetic mean of these two values at .93 for the smoothing parameter. The volatility indicators calculated by the EWMA approach was then multiplied by 12 to annualize the figures.
In Equation 4, volatility in stock returns was calculated by measuring the standard deviation of monthly returns. The associating figures were then multiplied by 12 to become annual indicators.
In Equation 5, the technique to calculate stock returns is presented, which was used across the Equations 1 to 4 where returns for a period were required.
The four approaches used to calculate VSR reflect different dimensions of stock return volatility, offering complementary insights into firm-level risk exposure. Equation 1 is adapted from Parkinson (1980) and estimates volatility based on the monthly high-low price range. This approach captures the intra-month price dispersion, which reflects the extent of price swings during each month and is especially sensitive to periods of heightened market fluctuations. Equation 2 employs the GARCH (1,1) model, capturing conditional volatility by incorporating both recent shocks to returns and past volatility. It reflects the persistence and clustering of volatility often observed in financial time series. Equation 3 applies the EWMA approach, which gives greater weight to more recent return shocks. This allows the model to adapt more quickly to recent changes in market conditions, making it effective in dynamic or crisis periods. Equation 4 estimates volatility by computing the standard deviation of monthly returns within a given year, providing a measure of realized or historical volatility, which reflects the overall dispersion in returns. Together, these four methods ensure a robust and comprehensive measurement of volatility, accounting for both observed price fluctuations and time-varying risk dynamics in firm-level stock performance.
The summary of all variables and the justification for the inclusion of control variables are provided in Table 2 while summary statistics are included in Table B1.
Description, Sources and Empirical Justification for the Control Variables.
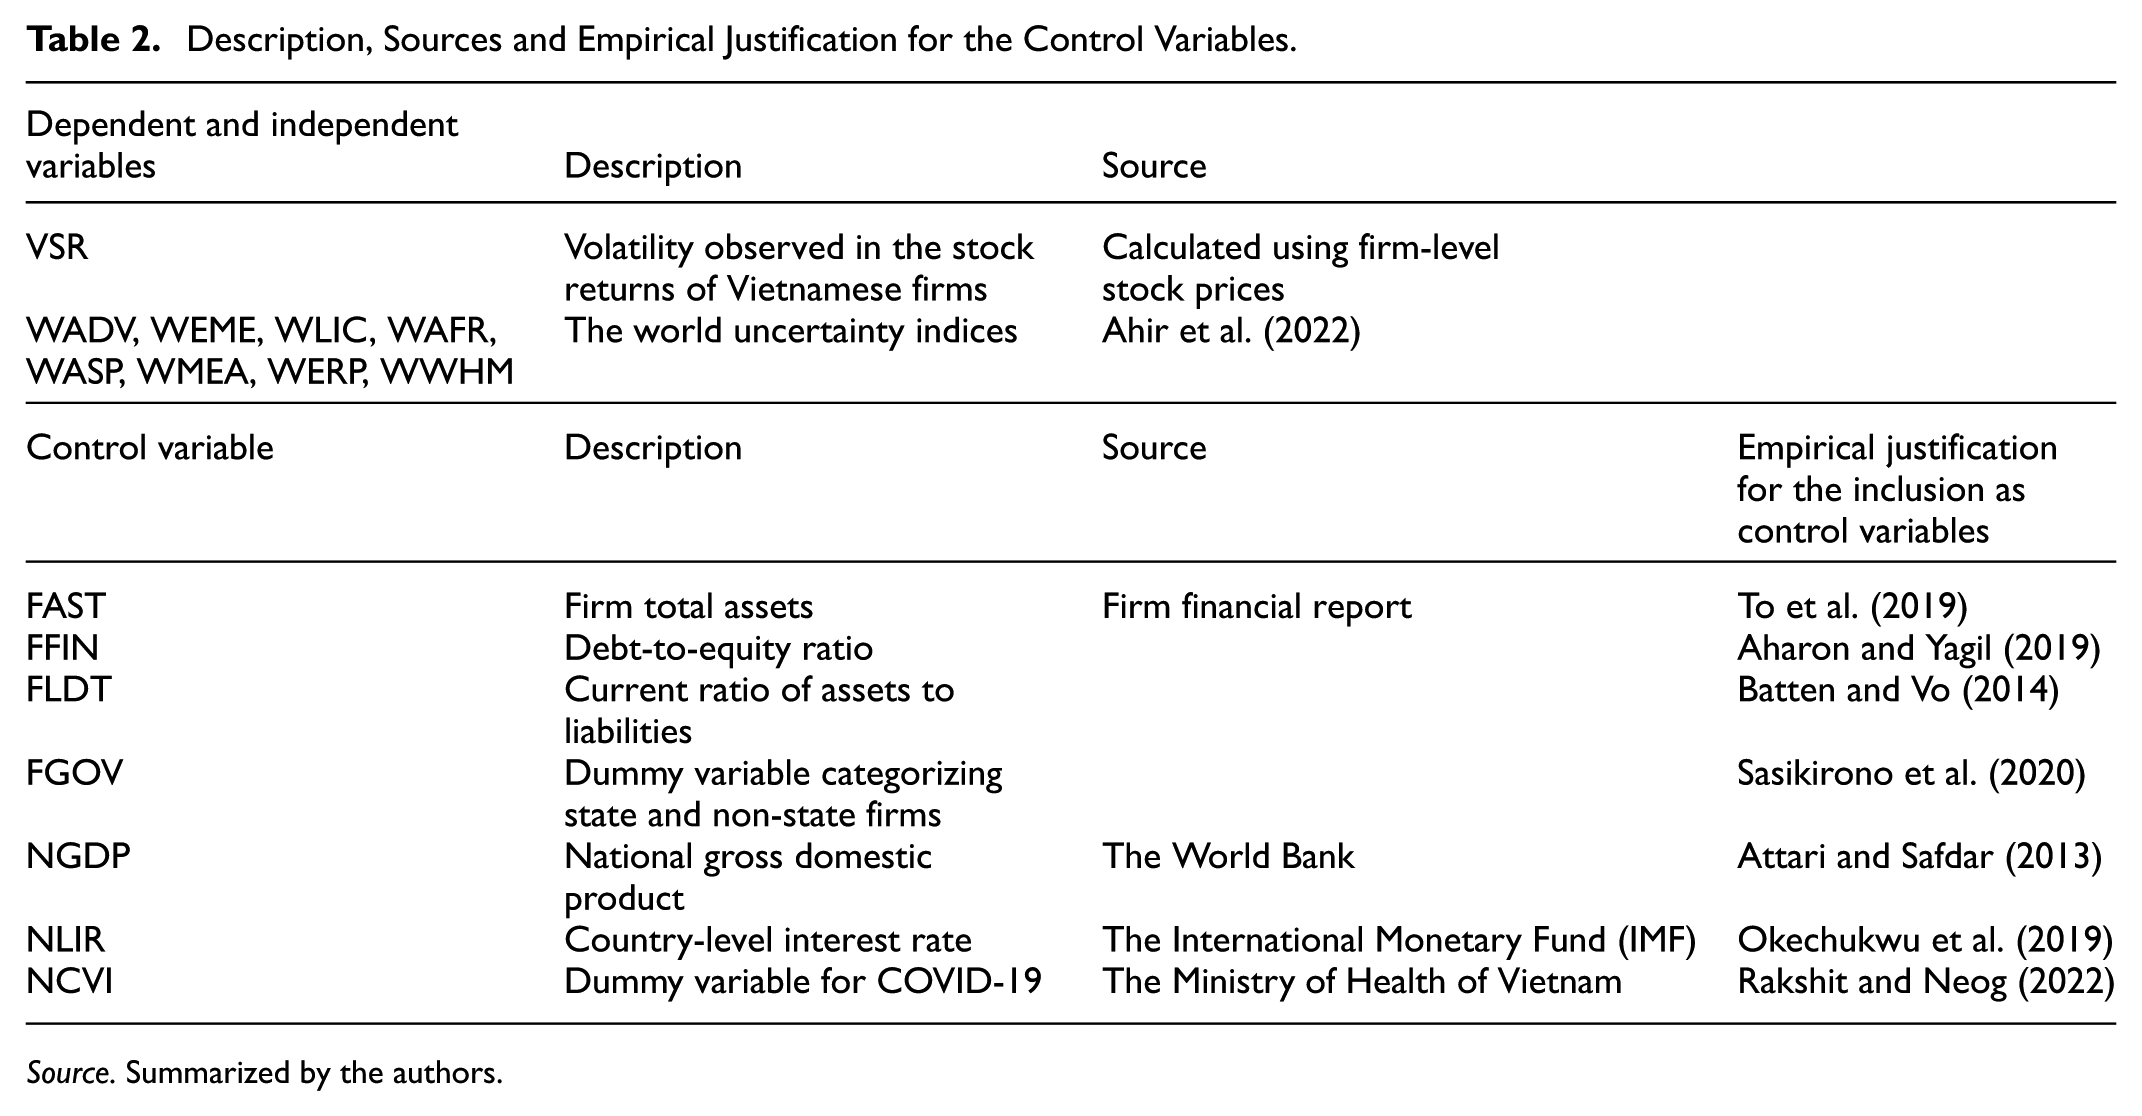
Source. Summarized by the authors.
Estimation Method
The main estimation method applied was the System Generalized Method of Moments (Sys-GMM), developed by Arellano and Bond (1991) and improved by Blundell and Bond (1998). Sys-GMM is particularly suitable for controlling endogeneity in dynamic panel data, thereby preventing biased estimates that might arise from other techniques. Specifically, Sys-GMM deals with issues related to endogeneity by using lagged variables as instruments for the estimation process. However, the method, if not utilized properly, can lead to biased findings because of instrument proliferation (overfitting of instruments). Thus, the robustness of GMM-based estimates requires verification through diagnostic tests. Following Roodman (2009), we applied the AR(2), Hansen, Sargan, and difference-in-Hansen tests, and their results were presented together with the Sys-GMM estimations to support the validity of our empirical findings.
We estimate the model with System GMM (Arellano & Bond, 1991; Blundell & Bond, 1998), exploiting internal lags as instruments to address endogeneity in dynamic panels and limit bias. Because instrument proliferation can overfit and distort results, we report Hansen, Difference-in-Hansen, Sargan, and AR(2) diagnostics (Roodman, 2009) alongside the estimates to assess specification and instrument validity.
The baseline models are expressed as in Equations 6 to 8.


Within the presented empirical models,
Empirical Findings and Discussion
Empirical Findings
We first examine uncertainty spillover effects from an economy-based approach.
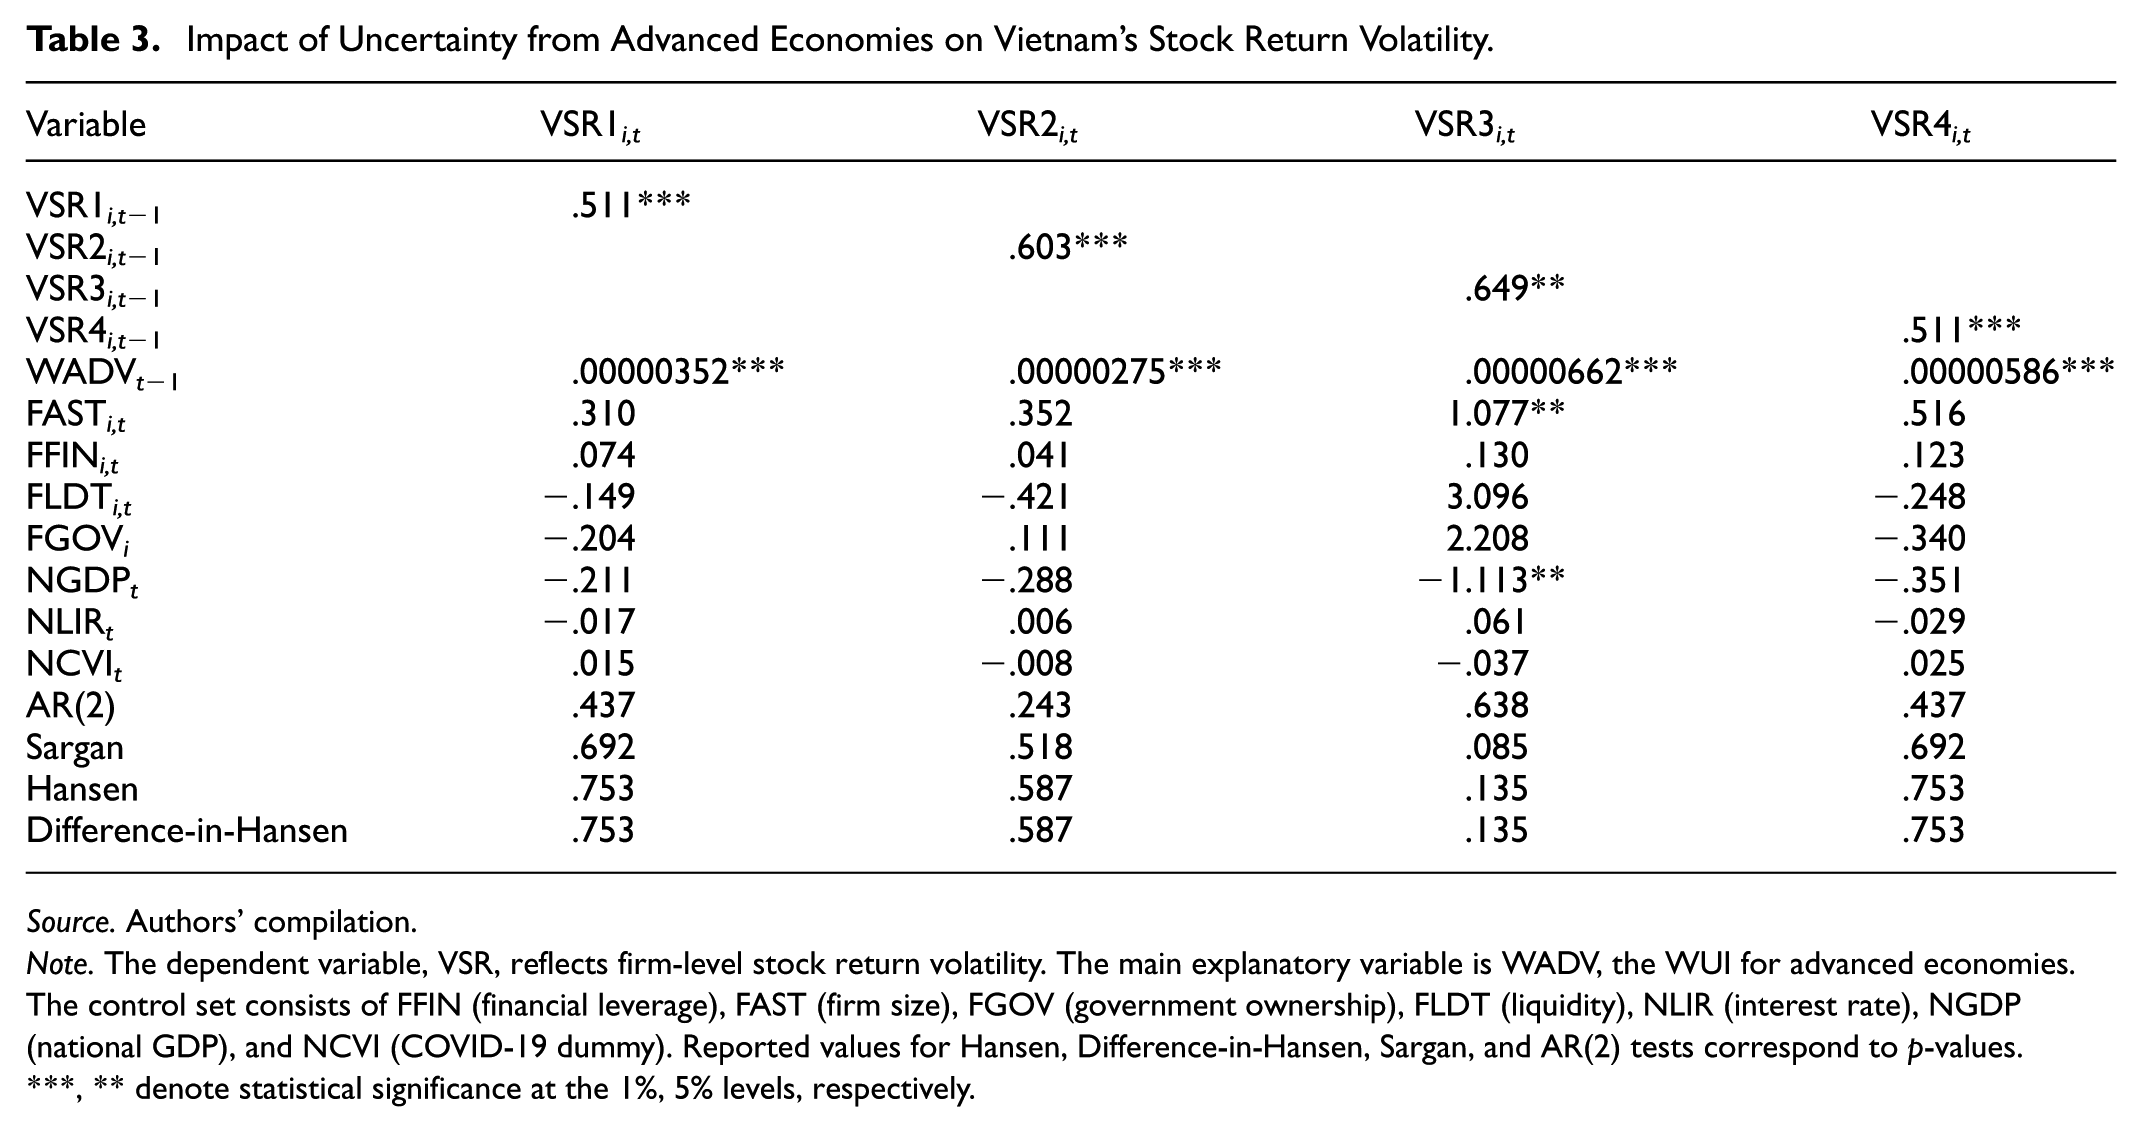
In Table 3, WADV shows strong positive association with all indicators of VSR, which highlights that uncertainty in advanced economies could destabilize and amplify volatility of Vietnamese equity returns. Under each model in the analyses, the results for diagnostic tests are also included, indicating that the findings are reliable and free from instrument-related biases. Following the analysis, we further examine the spillovers from emerging economies.
Impact of Uncertainty from Advanced Economies on Vietnam’s Stock Return Volatility.
Source. Authors’ compilation.
Note. The dependent variable, VSR, reflects firm-level stock return volatility. The main explanatory variable is WADV, the WUI for advanced economies. The control set consists of FFIN (financial leverage), FAST (firm size), FGOV (government ownership), FLDT (liquidity), NLIR (interest rate), NGDP (national GDP), and NCVI (COVID-19 dummy). Reported values for Hansen, Difference-in-Hansen, Sargan, and AR(2) tests correspond to p-values.
, ** denote statistical significance at the 1%, 5% levels, respectively.
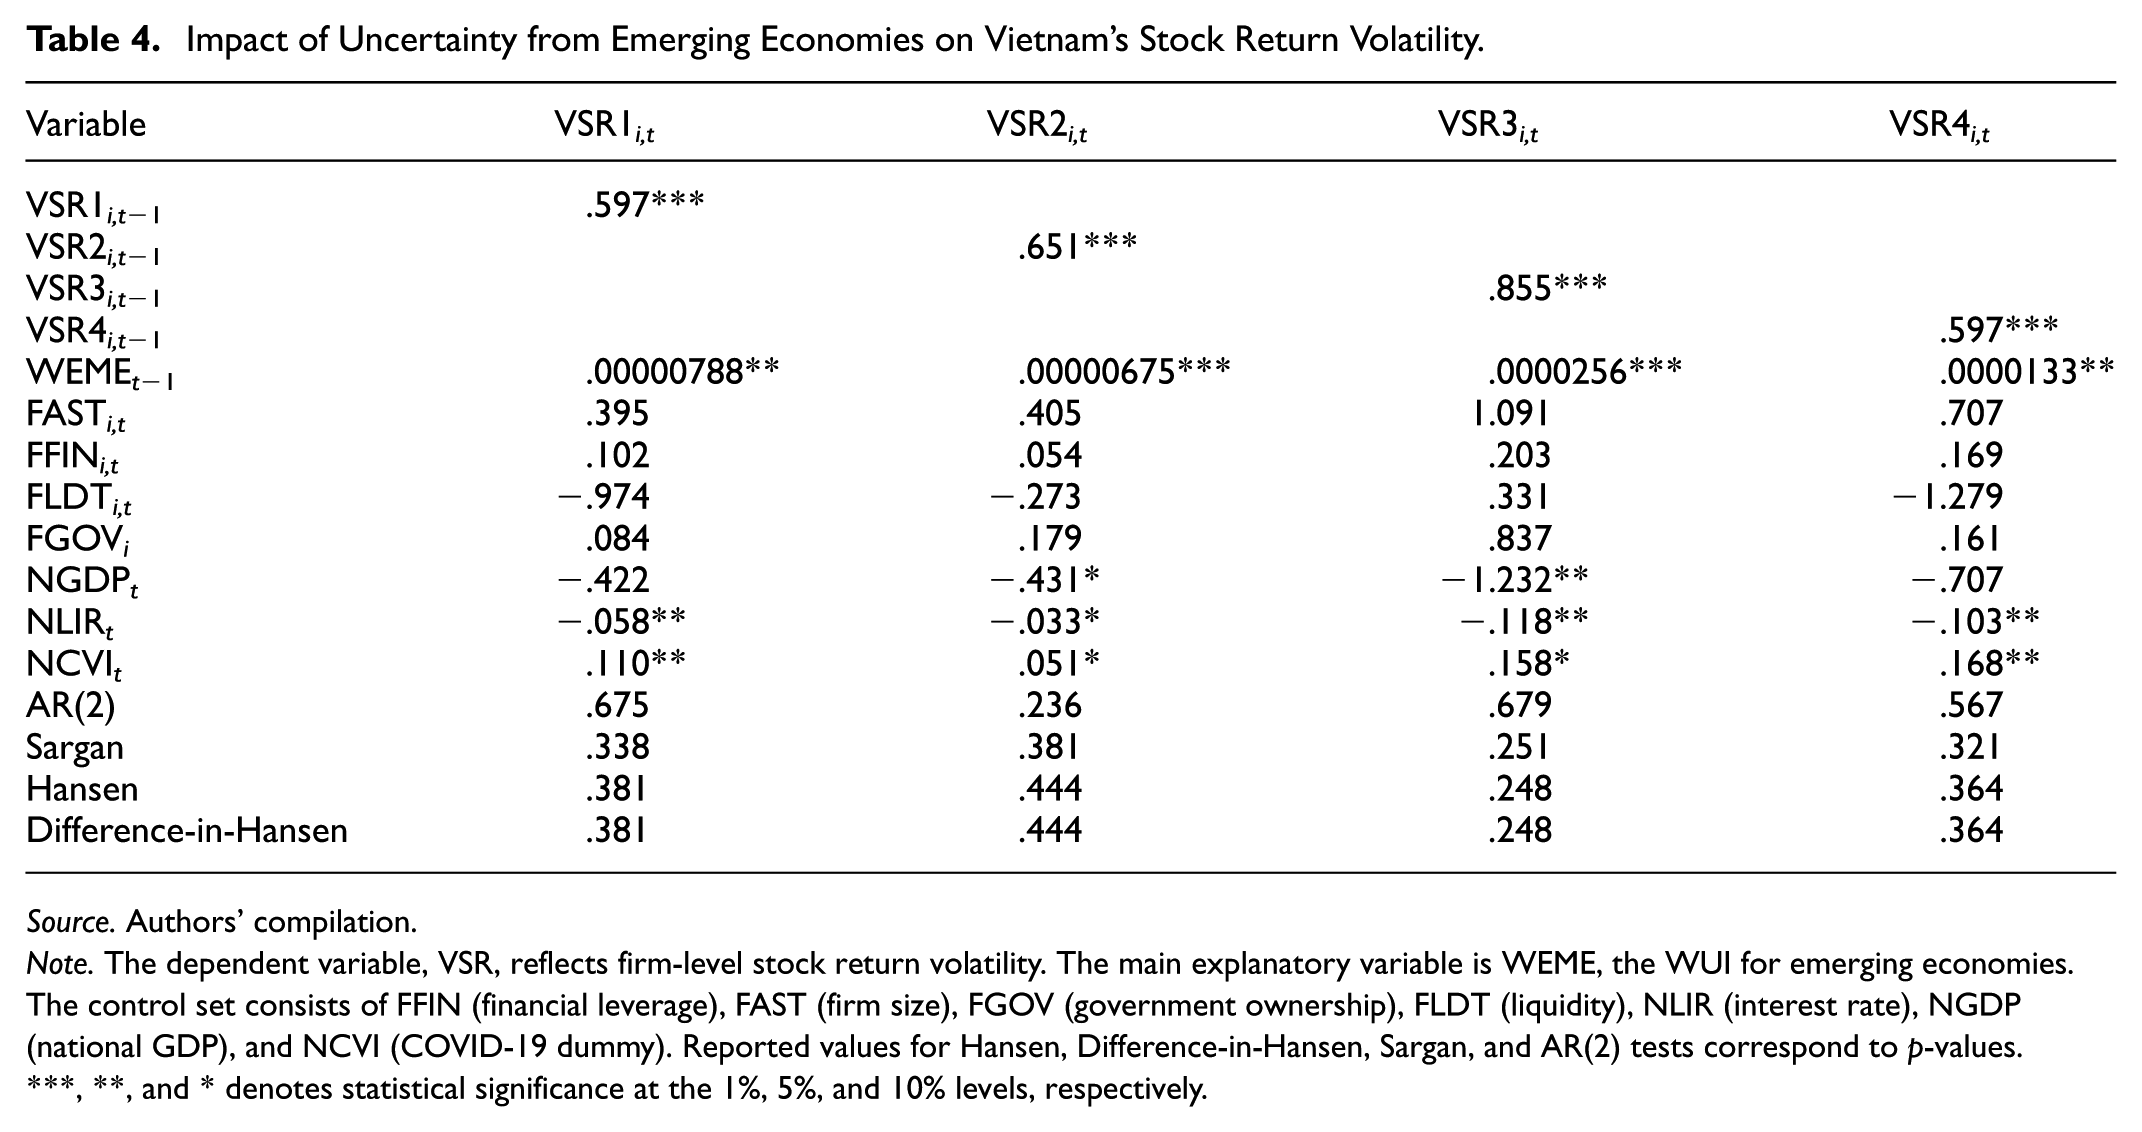
In Table 4, WEME shows positive effects on all indicators of VSR. Hence, heightened uncertainty in emerging markets is associated with elevated fluctuations in Vietnam’s corporate stock returns. Within all empirical models for analysis, the associated diagnostics-related tests suggest that the models were free from estimation biases and that there was no issue with the instruments we used. Hence, the findings are reliable under Sys-GMM estimation. Subsequently, Table 5 presents the analysis of spillovers originating from low-income economies.
Impact of Uncertainty from Emerging Economies on Vietnam’s Stock Return Volatility.
Source. Authors’ compilation.
Note. The dependent variable, VSR, reflects firm-level stock return volatility. The main explanatory variable is WEME, the WUI for emerging economies. The control set consists of FFIN (financial leverage), FAST (firm size), FGOV (government ownership), FLDT (liquidity), NLIR (interest rate), NGDP (national GDP), and NCVI (COVID-19 dummy). Reported values for Hansen, Difference-in-Hansen, Sargan, and AR(2) tests correspond to p-values.
, **, and * denotes statistical significance at the 1%, 5%, and 10% levels, respectively.
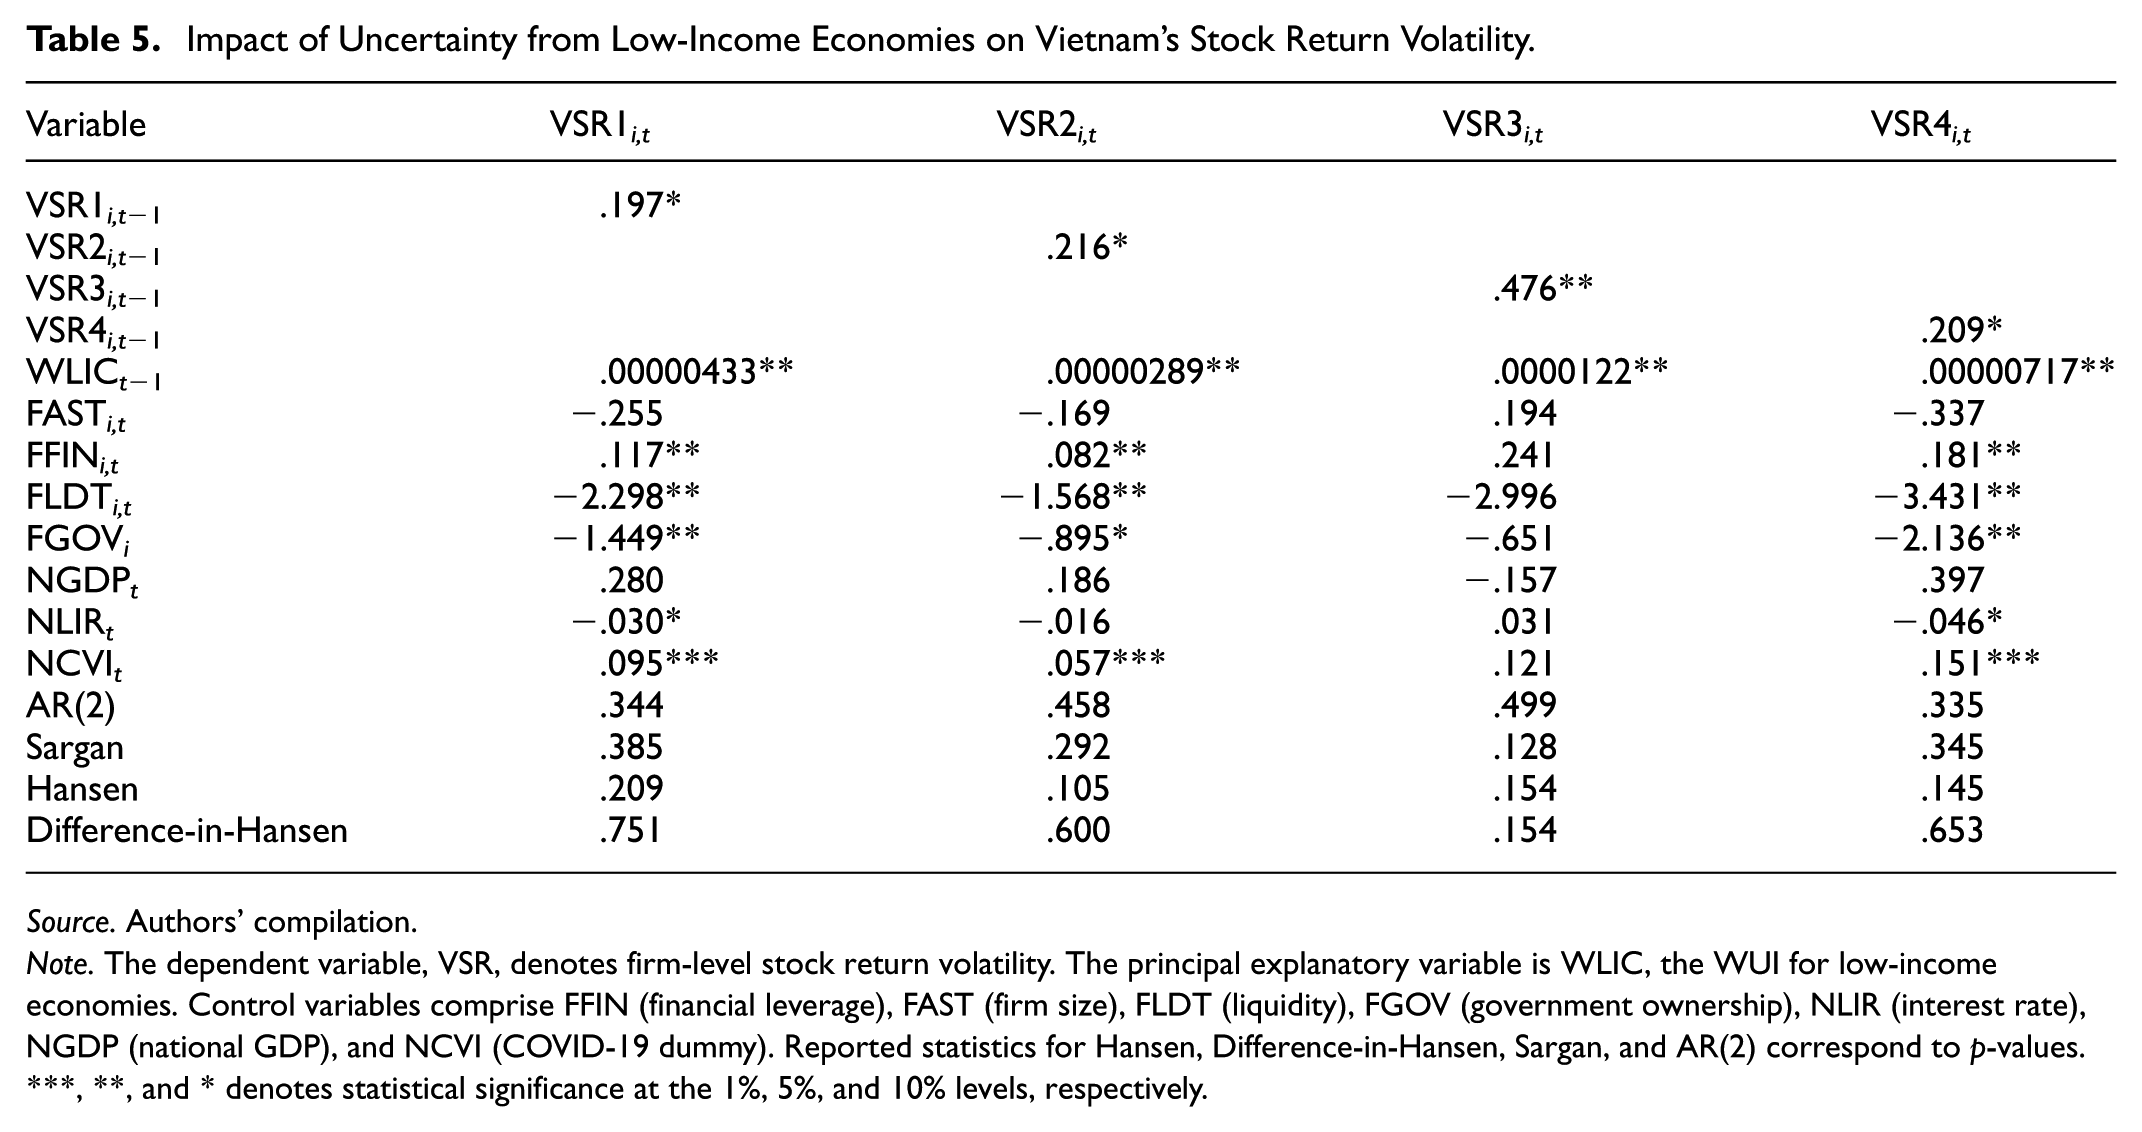
Impact of Uncertainty from Low-Income Economies on Vietnam’s Stock Return Volatility.
Source. Authors’ compilation.
Note. The dependent variable, VSR, denotes firm-level stock return volatility. The principal explanatory variable is WLIC, the WUI for low-income economies. Control variables comprise FFIN (financial leverage), FAST (firm size), FLDT (liquidity), FGOV (government ownership), NLIR (interest rate), NGDP (national GDP), and NCVI (COVID-19 dummy). Reported statistics for Hansen, Difference-in-Hansen, Sargan, and AR(2) correspond to p-values.
, **, and * denotes statistical significance at the 1%, 5%, and 10% levels, respectively.
The coefficients of WLIC are positive across all proxies of VSR at 5% significance level, which suggests that enhanced uncertainty in low-income economies have a destabilizing effect on VSR. For the controls, no consistently significant results were found. The p-values of the diagnostic tests reaffirm the reliability of all the findings. Following the economy-based approach, we further examine the spillovers effects from a region-based perspective.
The coefficients found for WAFR in Table 6 suggest that the spillovers of uncertainty from Africa are positively associated with VSR, which indicates that volatility in equity returns is higher as turbulence in Africa is heightened. The diagnostic tests indicate that the empirical results were estimated using appropriate and suitable instruments. Subsequently, we further proceed with the spillovers from the other regions.
Effects of Uncertainty from Africa on Vietnam’s Stock Return Volatility.
Source. Authors’ compilation.
Note. The dependent variable, VSR, captures firm-level stock return volatility. The principal explanatory variable is WAFR, the WUI for Africa. Control variables comprise FFIN (financial leverage), FAST (firm size), FGOV (government ownership), FLDT (liquidity), NLIR (interest rate), NGDP (national GDP), and NCVI (COVID-19 dummy). Reported values for Hansen, Difference-in-Hansen, Sargan, and AR(2) correspond to p-values.
, **, and * denotes statistical significance at the 1%, 5%, and 10% levels, respectively.
Turbulence in the Asia-Pacific (WASP) demonstrates a robust positive association with VSR as in Table 7, which indicates the amplifying effects of WASP on VSR. In essence, WASP causes disruptive influences on Vietnamese stock market by enhancing volatility of returns at corporate level as measured by VSR. The reliability of the findings is confirmed through the diagnostics.
Effects of Uncertainty from Asia-Pacific on Vietnam’s Stock Return Volatility.

Source. Authors’ compilation.
Note. The dependent variable, VSR, denotes firm-level stock return volatility. The principal explanatory factor is WASP, the WUI for Asia-Pacific economies. Control variables include FFIN (financial leverage), FAST (firm size), FGOV (government ownership), FLDT (liquidity), NLIR (interest rate), NGDP (national GDP), and NCVI (COVID-19 dummy). Reported values for Hansen, Difference-in-Hansen, Sargan, and AR(2) tests correspond to p-values.
, **, and * denotes statistical significance at the 1%, 5%, and 10% levels, respectively.
The target explanatory variable (i.e., WMEA) demonstrates strongly and significantly positive effects on all proxies used for VSR as in Table 8. Hence, uncertainty in Central of Asia and Middle East increases the fluctuations of equity returns in Vietnam. Furthermore, the reliability of the models is affirmed through the diagnostics.
Effects of Uncertainty from Middle East and Central Asia on Vietnam’s Stock Return Volatility.

Source. Authors’ compilation.
Note. The dependent variable, VSR, captures firm-level stock return volatility. The principal explanatory variable is WMEA, the WUI for the Middle East and Central Asia. The set of control variables comprises FFIN (financial leverage), FAST (firm size), FGOV (government ownership), FLDT (liquidity), NLIR (interest rate), NGDP (national GDP), and NCVI (COVID-19 dummy). Reported statistics for Hansen, Difference-in-Hansen, Sargan, and AR(2) tests correspond to p-values.
, ** denote significance at the 1%, 5% levels, respectively.
In Table 9, the target independent variable (i.e., WERP) show positive and statistically significant effects, suggesting that an increase in uncertainty in Europe enhances volatility in returns of Vietnamese stocks. The diagnostics reassure the trustworthiness of the models (Table 9).
Effects of Uncertainty from Europe on Vietnam’s Stock Return Volatility.

Source. Authors’ compilation.
Note. The dependent variable, VSR, denotes firm-level stock return volatility. The principal explanatory variable is WERP, the WUI for Europe. The control variables consist of FFIN (financial leverage), FAST (firm size), FLDT (liquidity), FGOV (government ownership), NLIR (interest rate), NGDP (national GDP), and NCVI (COVID-19 dummy). Reported values for Hansen, Difference-in-Hansen, Sargan, and AR(2) tests correspond to p-values.
, **, and * denotes statistical significance at the 1%, 5%, and 10% levels, respectively.
Table 10 shows that the causal relationship of WWHM on VSR is positive. In other words, increased turbulence in West Hemisphere is associated with heightened volatility in Vietnamese stock returns. As for the reliability of the findings, it is confirmed through the diagnostics.
Effects of Uncertainty from West Hemisphere on Vietnam’s Stock Return Volatility.

Source. Authors’ compilation.
Note. The dependent variable, VSR, reflects firm-level stock return volatility. The principal explanatory variable is WWHM, the WUI for the Western Hemisphere. The control set comprises FFIN (financial leverage), FAST (firm size), FGOV (government ownership), FLDT (liquidity), NLIR (interest rate), NGDP (national GDP), and NCVI (COVID-19 dummy). Reported values for Hansen, Difference-in-Hansen, Sargan, and AR(2) tests correspond to p-values.
, **, and * denotes levels of significance at 1%, 5%, and 10%, respectively.
Beyond this, the study explores how FLDT and FGOV function as moderators in the spillover effects. Specifically, we found the moderating roles of FLDT in the relationship between VSR and WLIC as well as between VSR and WAFR. Results further demonstrate that the nexus between VSR and WASP is conditioned by the moderating effect of FGOV.
The role of firm liquidity (FLDT) in moderating the effects from economies with low income (WLIC) is examined in Table 11.
The Role of Corporate Liquidity in Effects from Low-Income Economies.

Source. Authors’ compilation.
Note. The dependent variable, VSR, captures firm-level stock return volatility. The principal explanatory variable is WLIC, the World Uncertainty Index for low-income economies. Control variables comprise FFIN (financial leverage), FAST (firm size), FGOV (government ownership), FLDT (liquidity), NLIR (interest rate), NGDP (national GDP), and NCVI (COVID-19 dummy). Reported values for Hansen, Difference-in-Hansen, Sargan, and AR(2) correspond to p-values.
, **, and * denotes statistical significance at the 1%, 5%, and 10% levels, respectively.
Further, the empirical findings on the role of corporate liquidity in moderating the uncertainty spillovers from Africa is provided in Table 12.
The Role of Corporate Liquidity in Effects from Africa.

Source. Authors’ compilation.
Note. The dependent variable, VSR, captures firm-level stock return volatility. The primary explanatory variable is WAFR, the World Uncertainty Index for Africa. Control variables comprise FFIN (financial leverage), FAST (firm size), FGOV (government ownership), FLDT (liquidity), NLIR (interest rate), NGDP (national GDP), and NCVI (COVID-19 dummy). Reported statistics for Hansen, Difference-in-Hansen, Sargan, and AR(2) tests are presented as p-values.
, ** denote significance at the 1%, 5% levels, respectively.
The role of FLDT in the dynamics between WAFR and VSR can be observed through the negative coefficients of
In Table 13,
The Role of Government Ownership in Effects from Asia-Pacific.
Source. Authors’ compilation.
Note. The dependent variable, VSR, denotes firm-level stock return volatility. The primary explanatory variable is WASP, the WUI for the Asia-Pacific region. Control variables comprise FFIN (financial leverage), FAST (firm size), FGOV (government ownership), FLDT (liquidity), NLIR (interest rate), NGDP (national GDP), and NCVI (COVID-19 dummy). The values reported for Hansen, Difference-in-Hansen, Sargan, and AR(2) tests correspond to p-values.
, **, and * denotes levels of significance at 1%, 5%, and 10%, respectively.
Additionally, we conducted robustness checks by re-estimating all empirical models using the Fixed Effects (FE) technique, with results reported in Appendix A. While FE estimation offers a useful benchmark, it is not well suited for dynamic panel models with lagged dependent variables and potential endogeneity. In such cases, FE estimates can suffer from Nickell (1981) bias, especially in panels with a short time dimension, leading to biased coefficients. In contrast, the SGMM estimator is specifically designed to handle these issues by using internal instruments to correct for endogeneity and dynamic panel bias. In our context, potential endogeneity may arise from reverse causality between uncertainty and firm-level volatility, or from unobserved firm-specific characteristics that simultaneously affect both outcomes.
Accordingly, differences between SGMM and FE results, particularly regarding specific regions and income groups, are expected and should not be interpreted as contradictory. Notably, shocks originating from advanced and low-income economies remain significant under both estimation approaches, while effects from emerging markets are less stable. Similarly, region-based spillovers from Africa, Asia-Pacific, and Europe are consistent, whereas those from the other regions lose significance under FE, likely due to the limitations of the estimator. Importantly, all SGMM specifications passed key diagnostic tests. The Hansen and Difference-in-Hansen tests confirmed the reliability and validity of the instruments, the Sargan test did not reject the overidentifying restrictions, and the Arellano-Bond AR(2) test found no evidence of serial correlation. Additionally, the lagged dependent variables were consistently significant, reinforcing the dynamic nature of the model. Together, these diagnostics strengthen the credibility and robustness of our SGMM-based findings.
To further strengthen the results using dynamic panel estimators, we employ the Difference GMM (DGMM) estimator to check for robustness of the findings.
The DGMM results reported in Table 14 reaffirm the robustness and stability of the main findings under dynamic estimators. Across all model specifications, the main findings are consistent with those obtained from the SGMM estimator. Diagnostic tests also support the validity of the DGMM estimates: the Sargan, Hansen and Difference-in-Hansen tests indicate valid instruments, and the Arellano-Bond AR(2) test shows no serial correlation. This alignment supports the use of dynamic estimators over static estimators, as the former appropriately addresses dynamic panel bias and endogeneity.
Robustness Tests Using the DGMM Estimator.
Source. Authors’ compilation.
Note. The dependent variable, VSR, captures firm-level stock return volatility. The principal explanatory variables are the WUIs for Europe (WERP), Africa (WAFR), the Western Hemisphere (WWHM), the Middle East and Central Asia (WMEA), the Asia-Pacific (WASP), as well as advanced (WADV), emerging (WEME), and low-income (WLIC) economies, together with their interaction terms in the moderating specifications. The control variables include FFIN (financial leverage), FAST (firm size), FGOV (government ownership), FLDT (liquidity), NLIR (interest rate), NGDP (national GDP), and NCVI (COVID-19 dummy). The reported values of Hansen, Difference-in-Hansen, Sargan, and AR(2) tests correspond to p-values.
, **, and * denotes significance at the 1%, 5%, and 10% thresholds, respectively.
Discussion
Broadly speaking, the findings demonstrate that uncertainty originating from all three groups of economies has destabilizing effects on stock returns volatility in the country. This result underscores the vulnerability of Vietnam’s financial market to global uncertainty, regardless of the income classification of the external source. The significant spillover from advanced economies supports the findings of Karanasos et al. (2022) and can be attributed to the dominant influence these economies exert through trade, finance, and investor sentiment channels (Dornbusch et al., 2000). Notably, spillovers from emerging and low-income countries also impose significant effects. This challenges the traditional assumption that only major economies such as the US or China are key sources of turbulence. Instead, it suggests that Vietnam’s growing integration with a broader set of economies has made its financial market more sensitive to external uncertainty. These findings reinforce the perspective of Ghirelli et al. (2021), who showed that even low-income countries can be influential sources of uncertainty that should not be left unnoticed.
The region-based findings reveal that uncertainty spillovers from all major world regions have destabilizing effects on Vietnam’s stock return volatility. For instance, spillovers from the Asia-Pacific region could be likely due to Vietnam’s deep trade and investment linkages with partners such as China, Japan, and South Korea. These results support prior literature on the influential role of China in regional financial contagion (Shi & Wang, 2023; Yang et al., 2021). Further, spillovers from Africa are also found to increase volatility, despite Vietnam’s relatively limited economic linkage with the region. This suggests that spillovers may occur through indirect channels, such as fluctuations in investor sentiment as discussed by Dornbusch et al. (2000). These findings support the arguments of Elsayed and Helmi (2021) by extending the discussion of African turbulence spillovers beyond intra-regional boundaries to a transition economy like Vietnam.
Spillovers from Europe also show a destabilizing impact on Vietnamese equity markets. This result is particularly relevant given the growing economic relationship between Vietnam and the European Union as reflected through the EU-Vietnam Free Trade Agreement (EVFTA), which may have created the channels for uncertainty spillovers. The findings extend the observations of Clausen et al. (2019), who found strong intra-European uncertainty spillovers. Furthermore, uncertainty originating from the Middle East, Central Asia, and the Western Hemisphere is found to increase volatility in Vietnam’s stock market. While these regions may not be Vietnam’s primary economic partners, the evidence suggests that financial globalization and investor behavior contagion can facilitate cross-regional uncertainty spillover even in the absence of strong bilateral trade. This challenges the assumption that only geographically or economically close regions can impose volatility risks and supports a more nuanced view of global spillover mechanisms.
These empirical patterns are broadly consistent with theoretical perspectives on uncertainty spillovers and financial contagion. The evidence of widespread transmission across diverse regions and country types reinforces the view of Dornbusch et al. (2000) where trade linkages, financial interdependence, and investor behavior can facilitate global spillovers. The volatility observed also aligns with the real options theory (Dixit & Pindyck, 1994), which suggests that heightened uncertainty discourages investment, increases earnings volatility and thus stock return fluctuations. Moreover, the presence of destabilizing effects aligns with the arguments of Forbes and Rigobon’s (2002) on increased comovement during turbulent times.
In addition to the spillover effects, our analysis highlights heterogeneity in how firms respond to external uncertainty, aligning with the perspective of Bloom (2009). Specifically, corporate liquidity is found to play a moderating role in reducing the destabilizing impacts of spillovers from low-income economies and Africa. Firms with higher liquidity levels appear to be more resilient, possibly due to their greater financial flexibility. This coincides with prior arguments by Benmelech et al. (2017), and Tascón et al. (2024) on the importance of liquidity as a buffer during crises. Furthermore, government ownership emerges as a significant moderator in the context of spillovers from the Asia-Pacific region. SOEs could experience reduced sensitivity to uncertainty spillovers due to their strategic position, preferential access to resources, or government backing. These findings align with the literature suggesting the stabilizing role of SOEs during crises (Beuselinck et al., 2017; Qi et al., 2025) and reinforce the importance of ownership structure in moderating how firms respond to global uncertainty. However, the moderating effects of liquidity and government ownership are not observed in relation to uncertainty spillovers from other regions or economy groups. One plausible explanation is that the channels through which uncertainty from those regions affects Vietnamese firms may operate more indirectly or through channels that firm-level characteristics cannot play a stronger moderating role.
Conclusion
This work analyzes the transmission of uncertainty from various economies and regions on corporate equity returns in Vietnam. Based on system GMM estimations, the findings reveal that uncertainty from all examined economy groups as well as from all major regions exerts destabilizing impacts on Vietnam’s stock return volatility. These results highlight the broad vulnerability of a transition economy like Vietnam to global uncertainty. In addition, the study also investigates firm-level heterogeneity. Corporate liquidity is found to mitigate the destabilizing impacts of spillovers originating from low-income economies and Africa. Meanwhile, government ownership exerts a moderating role in the context of spillovers from the Asia-Pacific region. However, no significant moderating effects were observed for other regions or economy groups, indicating that firm-level buffers may be less effective in specific contexts. These findings offer valuable insights for investors, corporate managers, and policymakers seeking to manage financial risk in an increasingly interconnected world.
The study contributes to the literature by extending established theoretical perspectives on uncertainty transmission and firm-level behavior in emerging markets. By confirming that global uncertainty regardless of its geographic or economic origin can significantly destabilize stock return volatility in Vietnam, the findings offer empirical support to the contagion and comovement arguments discussed existing literature (Dornbusch et al., 2000; Forbes & Rigobon, 2002). Besides, the evidence on firm-level heterogeneity reinforces Bloom’s (2009) view that the effects of uncertainty are context-dependent, and it adds to the growing body of research emphasizing the role of corporate liquidity and state ownership.
These findings highlight several key considerations relevant to investors, firm managers, and policymakers.
For investors, understanding the global sources of uncertainty and their effects on domestic equity markets is crucial for effective portfolio management. Investors should closely monitor global political and economic developments, not just from dominant economies like the US or China. Additionally, greater attention should be paid to firm-level characteristics such as liquidity and government ownership. Firms with strong liquidity buffers and partial state ownership appear less sensitive to spillovers in certain cases, which can serve as important screening criteria in risk-averse investment strategies.
For corporate managers, the findings reinforce the value of maintaining financial flexibility, particularly in uncertain international environments. Since liquidity has been shown to reduce the destabilizing impact in certain cases, firms should consider building more resilient balance sheets through prudent liquidity management, maintaining access to credit lines, and retaining earnings. In companies exposed to Asia-Pacific dynamics, securing government ownership may also offer stability. Moreover, improving transparency and investor communication during uncertain periods can help mitigate negative sentiment and stabilize stock performance.
For policymakers, the study highlights the urgent need to strengthen Vietnam’s financial market resilience against global uncertainty where policy responses should not be narrowly focused. Instead, a mix of macroprudential measures such as dynamic provisioning, sectoral capital buffers, and countercyclical regulatory tools should be considered to cushion market volatility. In parallel, enhancing financial transparency, ensuring timely information dissemination, and supporting firm-level liquidity access (especially for SMEs) can reduce firm vulnerability during global uncertain periods. Additionally, efforts to diversify Vietnam’s trade and investment partnerships beyond a heavy reliance on a few major economies may help reduce exposure to region-specific or economy-specific uncertainty spillovers. Lastly, the role of state participation in strategically important or highly exposed sectors should be revisited, as government ownership has been shown to stabilize firm-level stock performance in certain contexts.
While offering valuable contributions, the study also entails certain limitations. First, while the World Uncertainty Index captures both political and economic uncertainty by design, the study does not disentangle these two dimensions in the empirical analysis. This distinction is theoretically meaningful because political shocks (regime change, conflict, policy instability) may propagate through different channels than economic shocks (growth slowdown, inflation, trade disruption). Future research should attempt to construct or utilize disaggregated indices such as separate measures of political and economic uncertainty through topic modeling or supervised machine learning applied to country reports. Second, the current analysis examines spillovers from grouped regions and economy types, which is helpful for macro-level generalization but may overlook country-specific effects. Future studies could adopt a country-level perspective to isolate bilateral linkages and better understand the channels of transmission. Third, while the study identifies moderating roles of firm liquidity and government ownership, future work may consider other factors that might protect firms during uncertain times to provide more nuanced understandings.
Footnotes
Appendix A: Robustness Analysis Employing the Fixed Effects (FE) Estimator
Robustness Analysis Employing the Fixed Effects (FE) Estimator.

| Variable | VSR1i,t | VSR2i,t | VSR3i,t | VSR4i,t |
|---|---|---|---|---|
| Advanced economies | ||||
| WADVt−1 | .000000579** | .000000433** | .00000156*** | .000000964** |
| FAST i,t | −.0007 | −.002 | −.004 | −.001 |
| FFIN i,t | .002 | .002 | .006* | .004 |
| FLDT i,t | −.075*** | −.056*** | −.101*** | −.125*** |
| FGOV i | dropped | dropped | dropped | dropped |
| NGDP t | .040 | .027 | .080* | .066 |
| NLIR t | −.054*** | −.035*** | −.092*** | −.090*** |
| NCVI t | .099*** | .062*** | .145*** | .166*** |
| Emerging economies | ||||
| WEMEt−1 | .000000868 | .000000662 | .00000662** | .00000144 |
| FAST i,t | −.0008 | −.002 | −.004 | −.001 |
| FFIN i,t | .003 | .002 | .006* | .005 |
| FLDT i,t | −.076*** | −.057*** | −.103*** | −.127*** |
| FGOV i | dropped | dropped | dropped | dropped |
| NGDP t | .026 | .016 | .042 | .044 |
| NLIR t | −.061*** | −.041*** | −.113*** | −.103*** |
| NCVI t | .112*** | .072*** | .179*** | .187*** |
| Low-income economies | ||||
| WLICt−1 | .00000212*** | .00000148*** | .00000443*** | .00000353*** |
| FAST i,t | −.002 | −.003 | −.007 | −.003 |
| FFIN i,t | .002 | .002 | .006* | .004 |
| FLDT i,t | −.081*** | −.061*** | −.115*** | −.136*** |
| FGOV i | dropped | dropped | dropped | dropped |
| NGDP t | .053** | .036* | .104** | .088** |
| NLIR t | −.048*** | −.031*** | −.082*** | −.080*** |
| NCVI t | .098*** | .062*** | .148*** | .163*** |
| The role of corporate liquidity in effects from low-income economies | ||||
| WLICt−1 | .00000388*** | .00000292*** | .00000699*** | .00000646*** |
| WLICt−1 * FLDT i,t | −.00000305** | −.00000249** | −.00000443* | −.00000507** |
| FAST i,t | −.002 | −.003 | −.008 | −.003 |
| FFIN i,t | .002 | .002 | .006* | .004 |
| FLDT i,t | −.006 | −.00008 | −.007 | −.011 |
| FGOV i | dropped | dropped | dropped | dropped |
| NGDP t | .053** | .036* | .105** | .089** |
| NLIR t | −.048*** | −.031*** | −.082*** | −.081*** |
| NCVI t | .098*** | .062*** | .148*** | .163*** |
| Africa | ||||
| WAFRt−1 | .000000889*** | .000000585*** | .00000168*** | .00000148*** |
| FAST i,t | −.0006 | −.002 | −.004 | −.001 |
| FFIN i,t | .002 | .001 | .005 | .004 |
| FLDT i,t | −.075*** | −.057*** | −.104*** | −.126*** |
| FGOV i | dropped | dropped | dropped | dropped |
| NGDP t | .012 | .008 | .024 | .021 |
| NLIR t | −.043*** | −.028*** | −.075*** | −.072*** |
| NCVI t | .114*** | .073*** | .181*** | .190*** |
| Asia-Pacific | ||||
| WASPt−1 | .0000026*** | .0000021*** | .00000857*** | .00000433*** |
| FAST i,t | −.001 | −.002 | −.006 | −.002 |
| FFIN i,t | .002 | .002 | .005* | .004 |
| FLDT i,t | −.076*** | −.057*** | −.102*** | −.127*** |
| FGOV i | dropped | dropped | dropped | dropped |
| NGDP t | .096*** | .072*** | .268*** | .160*** |
| NLIR t | −.075*** | −.052*** | −.161*** | −.126*** |
| NCVI t | .078*** | .044*** | .067*** | .130*** |
| Middle east and central Asia | ||||
| WMEAt−1 | .0000024 | −.0000000323 | .00000604 | .00000399 |
| FAST i,t | −.001 | −.002 | −.005 | −.001 |
| FFIN i,t | .003 | .002 | .006* | .005 |
| FLDT i,t | −.077*** | −.058*** | −.107*** | −.129*** |
| FGOV i | dropped | dropped | dropped | dropped |
| NGDP t | −.005 | .023 | −.035 | −.009 |
| NLIR t | −.054*** | −.038*** | −.094*** | −.091*** |
| NCVI t | .119*** | .071*** | .196*** | .198*** |
| Europe | ||||
| WERPt−1 | .000000653** | .000000498** | .00000144*** | .00000109** |
| FAST i,t | −.0006 | −.002 | −.004 | −.001 |
| FFIN i,t | .002 | .002 | .006* | .004 |
| FLDT i,t | −.075*** | −.056*** | −.102*** | −.125*** |
| FGOV i | dropped | dropped | dropped | dropped |
| NGDP t | .035 | .023 | .068 | .059 |
| NLIR t | −.053*** | −.034*** | −.093*** | −.089*** |
| NCVI t | .101*** | .064*** | .154*** | .169*** |
| Western hemisphere | ||||
| WWHMt−1 | .000000235 | .000000167 | .000000752** | .000000391 |
| FAST i,t | −.0008 | −.002 | −.004 | −.001 |
| FFIN i,t | .003 | .002 | .006* | .005 |
| FLDT i,t | −.076*** | −.057*** | −.103*** | −.127*** |
| FGOV i | dropped | dropped | dropped | dropped |
| NGDP t | .032 | .021 | .057 | .053 |
| NLIR t | −.056*** | −.037*** | −.098*** | −.094*** |
| NCVI t | .108*** | .069*** | .166*** | .180*** |
| The role of corporate liquidity in effects from Africa | ||||
| WAFRt−1 | .00000199*** | .00000131*** | .00000327*** | .00000331*** |
| WAFRt−1 * FLDT i,t | −.00000189*** | −.00000125*** | −.00000275** | −.00000315*** |
| FAST i,t | −.001 | −.002 | −.006 | −.002 |
| FFIN i,t | .002 | .001 | .005 | .004 |
| FLDT i,t | .001 | −.006 | .008 | .002 |
| FGOV i | dropped | dropped | dropped | dropped |
| NGDP t | .013 | .009 | .026 | .022 |
| NLIR t | −.043*** | −.028*** | −.075*** | −.072*** |
| NCVI t | .114*** | .073*** | .181*** | .190*** |
| The role of government ownership in effects from Asia-Pacific | ||||
| WASPt−1 | .00000295*** | .00000234*** | .00000916*** | .00000492*** |
| WASPt−1 * FGOV i,t | −.00000247*** | −.00000171** | −.00000412*** | −.00000411*** |
| FAST i,t | −.002 | −.003 | −.009 | −.004 |
| FFIN i,t | .002 | .002 | .005* | .004 |
| FLDT i,t | −.074*** | −.056*** | −.100*** | −.124*** |
| FGOV i | dropped | dropped | dropped | dropped |
| NGDP t | .097*** | .073*** | .271*** | .162*** |
| NLIR t | −.076*** | −.052*** | −.161*** | −.126*** |
| NCVI t | .078*** | .044*** | .067*** | .130*** |
Source. Authors’ compilation.
Note. The dependent variable, VSR, captures firm-level stock return volatility. The principal explanatory variables are the WUIs for Europe (WERP), Africa (WAFR), the Western Hemisphere (WWHM), the Middle East and Central Asia (WMEA), the Asia-Pacific (WASP), as well as advanced (WADV), emerging (WEME), and low-income (WLIC) economies, together with their interaction terms in the moderating specifications. The control variables include FFIN (financial leverage), FAST (firm size), FGOV (government ownership), FLDT (liquidity), NLIR (interest rate), NGDP (national GDP), and NCVI (COVID-19 dummy).
, **, and * denotes significance at the 1%, 5%, and 10% thresholds, respectively.
Appendix B: Summary Statistics
Summary Statistics.
| Variable | Average | Median value | SD | Lowest | Highest |
|---|---|---|---|---|---|
| VSR1 | .392 | .339 | .226 | .090 | 1.297 |
| VSR2 | .385 | .326 | .229 | .085 | 1.294 |
| VSR3 | .235 | .203 | .136 | .054 | .779 |
| VSR4 | .144 | .116 | .094 | .044 | .608 |
| WAFR | 39,011.1 | 35,782.5 | 13,704.32 | 19,694.75 | 59,208.25 |
| WASP | 16,933.25 | 14,694.38 | 5,716.439 | 10,210.25 | 26,903 |
| WMEA | 18,316.9 | 18,331.13 | 1,909.362 | 15,045.75 | 21,329 |
| WERP | 31,875.17 | 29,903.25 | 9,048.417 | 21,235.75 | 50,973 |
| WWHM | 27,919.75 | 26,153.38 | 9,893.944 | 14592 | 50676 |
| WADV | 26,127.35 | 23,576.38 | 9,068.01 | 15,908.75 | 47,373.50 |
| WEME | 24,656.53 | 23,120.63 | 4,763.92 | 17,425.00 | 33,622.00 |
| WLIC | 23,507.95 | 23,036.13 | 5,746.72 | 15,617.25 | 34,524.75 |
| FAST | 14.3367 | 14.3511 | 2.9622 | 0 | 20.2624 |
| FFIN | 1.8783 | .9998 | 2.8621 | .0249 | 16.7356 |
| FLDT | .5742 | .6166 | .2588 | .0281 | .9874 |
| NGDP | 22.6877 | 22.7179 | .2454 | 22.32 | 23.0897 |
| NLIR | 7.7684 | 7.6775 | 0.7091 | 6.96 | 9.323 |
| FGOV | .1395 | 0 | 0.3465 | 0 | 1 |
| NCVI | .4 | 0 | 0.49 | 0 | 1 |
Source. Authors’ calculations and compilation.
Note. The table presents descriptive statistics for all variables. The dependent variable is VSR, representing returns volatility. The set of WUI variables includes WEME (emerging economies), WADV (advanced economies), WLIC (low-income economies), WMEA (Central Asia and Middle East), WAFR (Africa), WERP (Europe), WASP (Asia-Pacific), and WWHM (Western Hemisphere). Control factors comprise FFIN (financial leverage), FAST (firm size), FLDT (liquidity), FGOV (government ownership), NLIR (interest rate), NGDP (national GDP), and NCVI (COVID-19 dummy).
Funding
The authors disclosed receipt of the following financial support for the research, authorship, and/or publication of this article: This work was supported by the Ho Chi Minh City University of Law.
Declaration of Conflicting Interests
The authors declared no potential conflicts of interest with respect to the research, authorship, and/or publication of this article.
Data Availability Statement
Data is available in public repository. The authors confirm that all data underlying the findings are fully available without restriction.