
Abstract
This study examines the intersectoral stock return linkages of the Indonesian sharia-compliant capital market under pre-pandemic and pandemic times. The closing prices on a daily basis, which were retrieved from Bloomberg Terminal, were estimated through the use of the Time Varying Parameter Vector Autoregressive (TVP-VAR) model in tandem with the Diebold and Yilmaz (2014) connectedness approach, with computation being done through RStudio. Results indicate a dramatic rise in sectoral return correlations during the pandemic, along with large spillover effects. The Consumer Cyclicals sector was the largest risk transmitter, and the Property and Real Estate sector was the largest risk receiver. These results highlight the significance of sectoral interdependencies, with important implications for investors in managing cross-sector risk and policymakers in crafting effective financial regulations.
Introduction
Interconnectedness of markets is caused by the interaction of several variables such as globalization, technological innovation, and economic policy responses (Naeem et al., 2023; Umar et al., 2023). Globalization increases the movement of capital, goods, and services across borders, thus connecting markets worldwide (Ullah et al., 2025). Advances in transportation and communication technologies enhance the exchange of information and reduce the cost of transactions, thus enhancing the efficiency of connectedness between markets. Also, trade agreements, regulatory frameworks, and economic policies enhance cross-border investment and encourage cooperation (Gurianova et al., 2023; Prakash et al., 2023). The connectivity of markets is also enabled by financial institutions and networks connecting multiple markets, enabling the rapid transmission of economic shocks and opportunities (Nguyen & Le, 2025; Wang & Huang, 2023). This interdependence allows for diversification of investments, risk management, and economic growth promotion; however, it also poses contagion and systemic risk challenges.
The return connectedness research in Islamic equities investigates interdependencies and influence of returns of Sharia law-compliant Islamic financial assets (Bahloul & Khemakhem, 2021; Trabelsi, 2019). The notion is of utmost importance to comprehend the forces driving Islamic financial markets and assist with well-informed investment decision-making (Ali et al., 2024). Appreciation of these interlinkages assists investors and policymakers in crafting improved risk management and investment policies, capturing the distinct features and performance dynamics of Islamic finance. Additionally, this field investigates aspects of behavioral finance, thereby broadening our understanding of market behavior against the backdrop of Islamic economic concepts (Adekoya et al., 2022). In recent years, the Islamic capital market encountered some significant risk determinants, particularly the COVID-19 pandemic, which caused disruptions in the global market mechanisms (Hasan et al., 2022; Smolo et al., 2023).
Return connectedness of Islamic shares in Indonesia is how closely the returns of Islamic shares tend to move together in the long run (Qizam et al., 2020; Shaikh et al., 2024). Return connectedness may be due to a variety of factors, such as economic conditions, market sentiment, and industry news. Under normal economic times, returns on Islamic shares exhibit a high degree of connectedness that demonstrates the common driving factors to the markets (Chowdhury et al., 2021; Nofrianto et al., 2024). In times of crises, however, like in the COVID-19 crisis, the connectedness would differ as various sectors differently react to crises (Tabak et al., 2022; Zhang et al., 2023). It is crucial to understand the return connectedness for investors to effectively manage risks in portfolios and determine areas for diversification in the Islamic capital market.
The presence of such an index helps investors have a useful benchmark when investing in Indonesia's sharia capital market. Jakarta Islamic Index 70 (JII70) is a benchmark representing the most traded 70 sharia stocks actively traded in Indonesia's Stock Exchange (IDX). According to a report by the Financial Services Authority (OJK), the index is an important benchmark for investors looking for sharia investment alternatives. By taking liquidity into consideration, the JII70 identifies stocks with high volumes, thus offering an outlook of the performance and solidity of Indonesia’s sharia capital market. The structured product makes it easier for investors to make informed decisions while ensuring adherence to Islamic financial principles. As of the period 2022, the market capitalization of Islamic shares monitored by the JII70 grew 5.08% from IDR 2,539.12 trillion in 2021 to IDR 2,668.04 trillion in 2022. The rising trend shows the bright future of Islamic shares in Indonesia, particularly if supported by coordination among market stakeholders. Thus, the JII70 serves as a valuable benchmark for investors who would like to construct well-planned investment strategies.
Prior research indicates that during crises, return correlations between industrial sectors and across international capital markets tend to intensify, often influenced by investor decisions based on stock returns. However, studies specifically examining stock return relationships among industry sectors within Indonesia's Islamic capital market remain unexplored. This research aims to address this gap by analyzing the period from 2019 to 2023, covering conditions before, during, and after the COVID-19 pandemic. This approach enables an examination of return relationships under both normal and recessionary conditions within Indonesia’s Islamic capital market. A deeper understanding of these inter-sectoral return relationships can assist investors in making informed decisions and mitigating cross-sector risks.
Literature Review
To conduct empirical research on market connectedness in Islamic stocks, integrating multiple theoretical perspectives is crucial. In this regard, Efficient Market Hypothesis (EMH) postulates that asset pricing reflects all information, and one can analyze how Islamic stocks, following ethical screening, embed market-wide information (Akbar et al., 2024; Al-Khazali et al., 2014; Sakınç et al., 2024). Modern Portfolio Theory (MPT) is concerned with optimizing return in relation to risk, and an analysis is initiated regarding how Shariah-compliant restrictions impact Islamic portfolio diversification and risk-adjusted return (El Kharrim, 2024; Lim et al., 2023). In addition, behavioral finance extends information regarding psychological factors and moral values in Islamic finance regarding behavior and market dynamics of investors (Dharma et al., 2024; Ramadhani et al., 2024).
Network Theory identifies the interlinks and relations between Islamic stocks (Abdelsalam et al., 2024; Khalfaoui et al., 2023), whereas Information Asymmetry theory identifies the role of transparency and disclosure behavior in Shariah-compliant companies in shaping market connectivity (Acheampong & Elshandidy, 2024). International Finance Theory looks at financial relations between nations, in terms of an analysis of how integration at a regional level and cross-border free trading regimes impact the connectivity of Islamic stocks in various markets (Naeem et al., 2024).
This research employs Network Theory in studying the connectedness of Islamic stocks because of its complementary strengths. With Network Theory, one can map and analyze the sophisticated network of connectivity between Islamic stocks, revealing information and shock transmissions through such networks. It is specifically applicable to comprehend the specific dynamics in cases of Shariah-compliant markets.
Network Theory thus provides a sound platform for interpreting the complex nature of the structure of interconnectedness between financial assets. This helps researchers understand how information, risks, and shocks are propagated across markets (Glasserman & Young, 2015; Ramadiah et al., 2019). This seminal work of Newman (2003) introduced centrality, clustering, and modularity as network metrics that have then been widely applied to financial market analyses (see: Newman, 2003; Touli et al., 2024). In the context of Islamic finance, network analysis has been employed to investigate the interconnectedness of Shariah-compliant stocks, sukuk markets, and Islamic indices, among others (Billah et al., 2025; Rabbani et al., 2023).
Market Connectedness in Islamic Stocks
Islamic finance has grown to be an important part of international financial markets, which relies on the concept of ethical investment, sharing of risks, and strict adherence to the laws of Shariah. What gives Islamic stocks their distinct identity is their adherence to high ethical and financial standards that render them different in structure and behavior from their conventional counterparts (Akhtar et al., 2023; Begam et al., 2024). Islamic stocks are driven by different dynamics because of the sectoral weighting in healthcare, energy, and technology industries, plus disallowed excessive use of leverage and speculation. Spillover indices have thus been used in various studies to estimate market connectedness, allowing for an understanding of how a shock in one market segment spills into others (Greenwood-Nimmo et al., 2024; Kang & Lee, 2019; Klößner & Wagner, 2014). It has also been indicated that Islamic stocks are representatives of the Shariah compliant markets that are less integrated with the world market but are linked across markets owing to their common ethics and rule of operation (Boulanouar et al., 2024; Cheong, 2021).
In the context of the Indonesian stock market, this integrated approach is particularly valuable given the dual challenges of ensuring Shariah compliance and navigating the complexities of an emerging market (Usman et al., 2024). The network structures can reveal insights into the resilience and efficiency of Islamic stocks (Bahloul & Khemakhem, 2021; Ben Rejeb & Arfaoui, 2019). For example, it has been evidenced that those markets that present good disclosure practices are more integrated in terms of network structure and, hence, in a better position to absorb exogenous shocks (Al Barrak et al., 2023; Naseer et al., 2024; Sun et al., 2025).
Islamic Ethical Principles and Their Impact on Connectedness
Islamic ethical principles, such as the prohibition of riba, gharar, and maysir, are highly important in shaping the behavior of Islamic stocks. Khalfi and Saâdaoui (2023) and Rakhmanov et al. (2024) who explain how these principles shape both network structures and information asymmetry. In Indonesia, these ethical principles form part of the regulatory framework that underpins Islamic finance. However, variations in implementation across firms and sectors can make for disparities in market behavior (Bashir & Babiker, 2023; Sakinç, 2021).
Although existing literature provides some insights into the issues of market interconnectedness, Network Theory has the potential to address a number of gaps: limited empirical studies have been undertaken in the context of the Indonesian Islamic stock market regarding the determination of market connectedness; interaction between stocks is an area that needs further consideration in order for the so-called wheel within to be exposed.
Many scholars have conducted investigations into the linkage between Islamic stock returns in Indonesia. To exemplify, different scholars have conducted examinations to determine how different economic conditions might result in differences between returns and risks from Islamic stocks (Akhtar, 2021; Fianto et al., 2023; Nofrianto et al., 2024). According to the outcome, it is discovered that during periods of crisis or a pandemic, Islamic stocks of Indonesia bear greater risk compared with that found during stable situations. However, the impact is less severe on Islamic stocks compared to the general Asian market. This therefore indicates that Islamic stocks might provide some resilience during turmoil and hence could be an attractive avenue for risk-averse investors.
Similarly, several researchers have conducted studies on the factors of profitability, liquidity, solvency, and firm size that influence Islamic stock returns in Indonesia. The study revealed that profitability significantly influences return positively, whereas liquidity, solvency, and the size of the firm do not (Ho & Mohd-Raff, 2019; Jihadi et al., 2021). It means that, in investing in Islamic stocks, investors should orient towards profitability. It is likely that investors prefer the companies that have good profit margins and growing earnings since these areas are more likely to produce high returns.
Other notable research investigated the spillover effects between conventional and Islamic stock markets in Indonesia. Bossman et al. (2022), Elsayed et al. (2023), and Naeem et al. (2024) revealed significant spillover effects from the conventional stock market to the Islamic stock market, which could show that shocks in the broader market will appreciably spill over to Islamic stocks. This finding underscores the importance of considering conventional market developments when making investment decisions in Islamic stocks.
Besides, the researchers study macroeconomic variable effect on Indonesia Islamic stock return (Danila, 2023; Hermuningsih et al., 2024; Naeem et al., 2024). The result of the study revealed that a shift in the macroeconomic condition significantly influences the Islamic stock returns, and higher inflation and interest rates reduce the returns. It will indicate that an investor should consider the macroeconomic trend in assessing the possible performance of the Islamic stocks.
These findings have big implications for investors in the way returns connect between Islamic stocks, which allows them to facilitate portfolio diversification and effective risk management. For example, a situation where certain stocks are highly correlated could make investors look at diversification to reduce market volatility. Besides, such knowledge obtained from different studies will contribute to investors’ choice of a suitable investment opportunity and thus to the development of effective trading strategies. Investors will have better opportunities to make the right decisions on their investment activities with higher profitability by being aware of the effects of general economic conditions on stock returns.
Also, spillover effect analysis between conventional and Islamic stock markets is an overall investment analysis. Investors have to consider not only the level of performance of firms but also follow developments in the general market and macroeconomic environment. By taking a holistic approach, investors can envision various possibilities of risks and opportunities that will emerge so that their investment in securities will be more rewarding.
Literature review forms the basis upon which determination of the connectedness between returns in Islamic stocks is significant for a number of reasons. First, this will provide valuable information on how the stocks behave during different market conditions; for example, stable economies, economic crises, and even global pandemics. Second, it helps investors perceive the best decision to make through identifying patterns and correlations between stocks. Thirdly, it develops robust financial models and strategies for risk management that are important for investors and policy makers.
Hypotheses Development
The increasing volatility and sectoral interdependence observed in global and domestic equity markets, particularly during episodes such as the COVID-19 pandemic, underscore the critical importance of understanding return correlations and spillover dynamics. Within the context of Islamic capital markets, these phenomena are especially relevant due to the distinct characteristics of sharia-compliant instruments, which emphasize risk-sharing, ethical screening, and asset-backed structures that differentiate them from conventional financial systems (Abdelsalam & El-Komi, 2024; Balli et al., 2019).
Theoretically, this study is grounded in Modern Portfolio Theory (Markowitz, 1952), which emphasizes the importance of diversification to reduce unsystematic risk by combining assets with low return correlations. It also incorporates insights from the Efficient Market Hypothesis (Fama, 1970), which suggests that all available information is rapidly reflected in asset prices. In addition, it draws from the Contagion Effect Theory, which posits that during financial crises, asset and sectoral co-movements tend to increase due to behavioral factors such as herding, as well as shared economic fundamentals (Forbes & Rigobon, 2002).
These theoretical propositions are supported by empirical evidence. Diebold and Yilmaz (2014) found that during periods of heightened uncertainty, financial systems exhibit stronger spillover effects, altering the transmission of risk across entities. In the case of China, Shen et al. (2022) documented a significant rise in sectoral connectedness during the COVID-19 pandemic. Comparable findings were reported by Ahmad et al. (2023) in Malaysia and by Bui et al. (2024) in Vietnam, where multiple sectors displayed elevated return correlations and dynamic volatility spillovers throughout their respective crisis periods.
Guided by these theoretical and empirical insights, and in response to the research questions of this study, the following testable hypotheses are formulated:
Materials and Methods
This study employs secondary data comprising the daily stock returns of nine industrial sectors within Indonesia’s Islamic capital market, covering the period from June 2019 to August 2023. Sectoral returns were constructed from daily closing price data obtained through Bloomberg Terminal. A total of 1,034 observations per sector were collected, yielding 9,306 observations in total. The nine sectors were selected based on their consistent representation in the Jakarta Islamic Index 70 (JII70) throughout the observation period. The list of constituent issuers was compiled using official records from the Indonesia Stock Exchange (IDX) and the Indonesia Capital Market Institute (TICMI).
To ensure transparency and data reliability, the construction of sectoral returns and data treatment procedures are described as follows. Daily closing prices for all constituent stocks of each sectoral index were obtained from Bloomberg (PX_LAST series) and adjusted for corporate actions such as dividends and stock splits. Sectoral returns were computed using the log-difference of the sectoral price indices as follows:

where Ps,t denotes the market-capitalization-weighted index level of sector s at time t. The sectoral index was constructed by aggregating the individual stock prices within each sector using their daily free-float market capitalizations as weights. When a firm’s market capitalization data were missing for a specific day, the most recent available value (up to five trading days prior) was carried forward. If a stock’s price data were unavailable due to trading suspension or data gaps, it was temporarily excluded from that day’s computation, and the remaining firms’ weights were re-normalized to sum to one.
To ensure data reliability, trading days in which fewer than 70% of a sector’s constituents had valid return observations were excluded from the analysis. All return series were further winsorized at the 1st and 99th percentiles to reduce the influence of extreme observations, such as abrupt single-day price spikes or illiquidity-driven outliers. Robustness checks using alternative trimming thresholds (e.g., 5th–95th percentiles and median absolute deviation capping) confirmed that the main results were not sensitive to the treatment of extreme values.
To evaluate sectoral correlations and spillover effects across different economic conditions, the observation period was segmented into two main phases. The pre-pandemic phase is defined as June 2019 to December 2019, capturing the last semester of market behavior prior to the formal onset of the COVID-19 outbreak. Although the pre-pandemic period is relatively short, it was selected based on data availability and the fact that these months represent a stable and undisturbed market state. This limited window has also been utilized in prior studies employing event-driven approaches where comparability of volatility regimes outweighs the requirement for extended timelines (e.g., Shen et al., 2022). The pandemic phase covers January 2020 to December 2022, aligning with the World Health Organization's global pandemic declaration in March 2020 and encompassing the entirety of Indonesia’s public health and economic policy responses. The final months, from January to August 2023, are retained for robustness analysis and continuity of the time-varying model but are excluded from the main contrast between the pre-pandemic and pandemic periods.
The empirical model adopted is the Time-Varying Parameter Vector Autoregression (TVP-VAR) framework proposed by Koop and Korobilis (2014), combined with the Generalized Forecast Error Variance Decomposition (GFEVD) approach introduced by Diebold and Yılmaz (2014). This methodology is preferred over more traditional static models such as Generalized Method of Moments (GMM) or fixed-parameter VAR due to its ability to capture time-varying dynamics, structural breaks, and asymmetric transmission patterns across sectors. TVP-VAR is especially relevant when analyzing evolving interlinkages during periods of high uncertainty, such as a pandemic, where financial relationships exhibit nonlinear and state-dependent behavior (Antonakakis & Gabauer, 2017).
The data were analyzed using R statistical software with the Connectedness Approach package, which enables the estimation of Total Connectedness Index (TCI), Total Directional Connectedness (TO and FROM others), and Net Connectedness metrics. RStudio served as the integrated development environment, facilitating package integration and graphical output generation.
TVP VAR Analysis
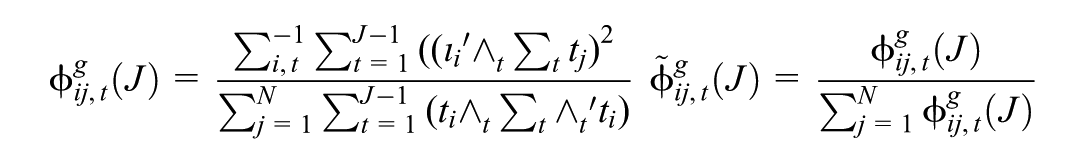
This paper applies the TVP-VAR methodology combined with the model developed by Koop and Korobilis (2014) to measure the connectedness. The connectedness of changes in price return index is represented by the TVP-VAR model supported by the Bayesian Information Criterion.


Where
Then, applying the Wold representation theorem,
The (unscaled) GFEVD,
With

The idea of connectedness explains how shocks to one variable can spill over into other variables. The intensity of a condition where a variable spills its shock to all other variables, denoted as j, is called total directional connectedness to others.

Let total directional connectedness from others represent the calculation of directional connectedness of variable i received from variable j is as follows:

In the final step of decomposition, for each variable, the net total directional connectedness is computed by subtracting the total directional connectedness others from the total directional connectedness received from others. It therefore provides in this respect an interpretation for the extent to which variable i leads or lags the dynamics under scrutiny.

If the net total directional connectedness of variable i is positive, it means that variable i exerts a larger influence on the network than it receives. On the other hand, in the case of a negative given net total directional connectedness, variable i is influenced by the network more than it influences it, which would imply its dependence on external factors.
Results and Discussion
Estimates of Average Connectedness
The dynamics of the sectors of the Islamic capital market industry indicate a dynamic relationship that changes with time, depending on the economy of the country. These dynamics could also imply that the sectors are rather sensitive to the changes or occurrences. A shock from an occurrence can easily be reflected in changes in TCI. This clearly appears in Figure 2, representing an important inflection point since the year 2020, at precisely the same period when COVID-19 began its devastation in Indonesia.
Consistent with the study's findings, similar significant shifts in correlations in response to shocks have been observed in other countries. For instance, Diebold and Yılmaz (2014) documented such changes in Malaysia, notably during the global financial crisis of 2008 to 2009 and the COVID-19 pandemic in 2020. Similarly, Ahmad et al. (2023) reported comparable dynamics in the United States during the onset of the COVID-19 pandemic in March 2020 and the Russia-Ukraine war in February 2022. Figure 1 illustrates the stock return dynamics across nine sectors of the Islamic capital market industry, as represented by the JII70 index in Indonesia. The figure highlights that most sectors experienced notable fluctuations during the COVID-19 pandemic in 2020, marked by significant fat tails observed across the majority of sectors within the Islamic capital market industry.

Logarithmic return of Islamic capital market sector.
Table 1 presents summary statistics for the nine industrial sectors corresponding to the JII70 index. It reveals that eight sectors exhibit negative average returns, while the Energy sector shows a positive average return. Notably, the Financials sector has the highest standard deviation, indicating the greatest price volatility among the sectors.
Summary Statistics.
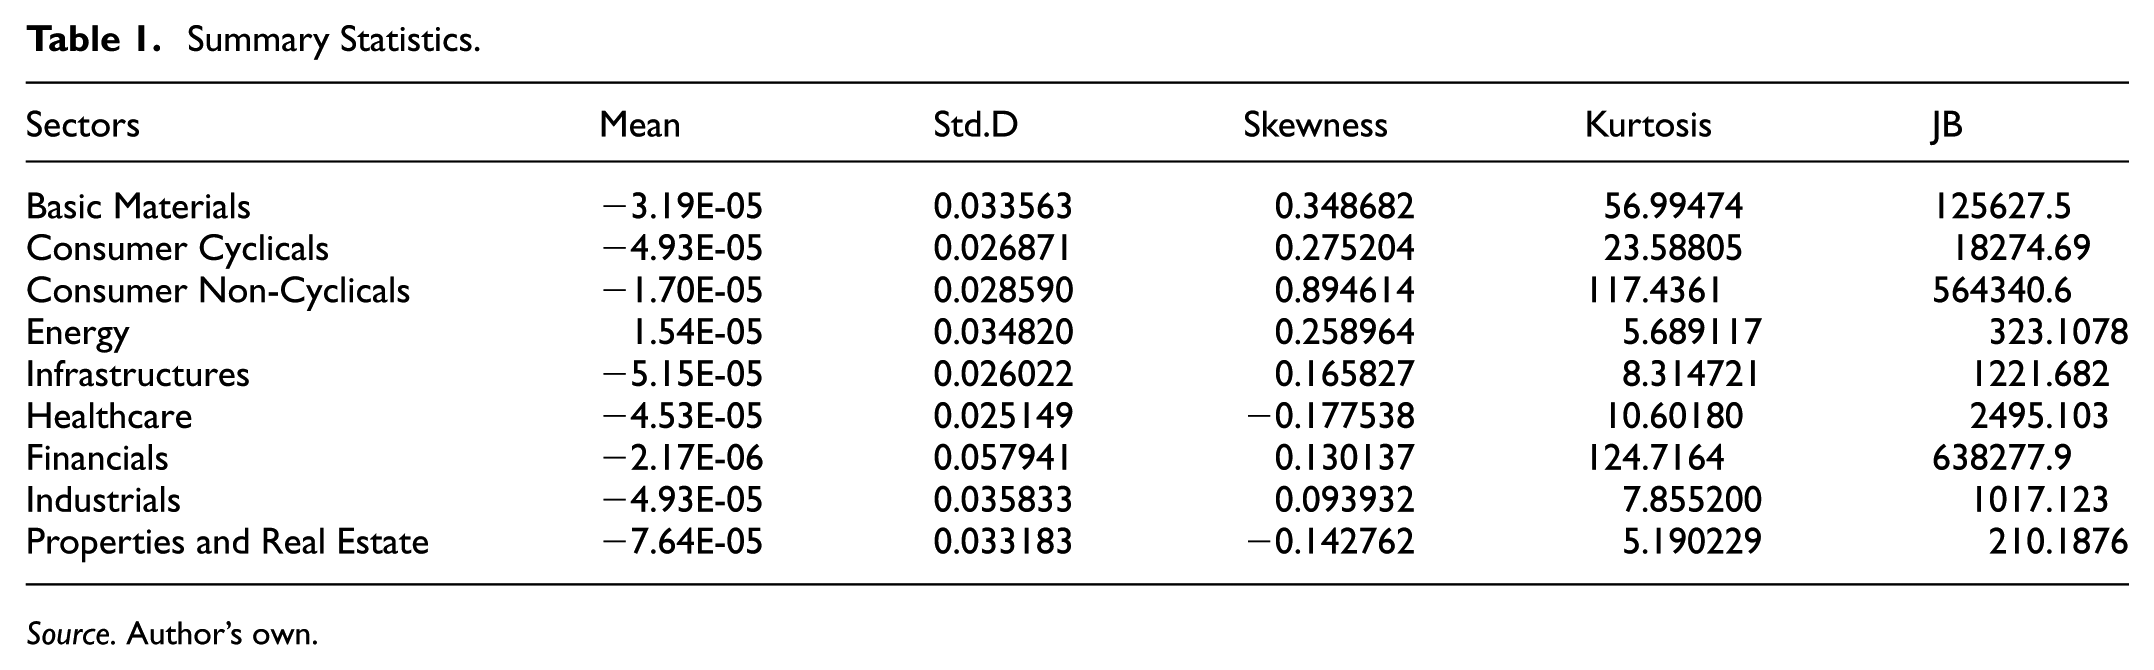
Source. Author’s own.
Total Connectedness Index
The results of the Total Connectedness Index (TCI) test in the 2019 to 2023 observation period show that there is an increase in the correlation between Islamic stock sector returns entering the COVID-19 pandemic period. This is supported by similar studies including by (Polat, 2024) related to the correlation between the Australian Securities Exchange sectors and Choi et al. (2021) who observed the conditions of the Polish capital market which stated that the correlation between sectors varied depending on time. In addition, there is a stronger correlation during the crisis caused by the outbreak of COVID-19 compared to the previous period. The COVID-19 period shows a considerable influence on the connection between Islamic capital market sectors in various countries. This is related to the contagion effect, one of which is common shocks where large-scale shocks have the potential to trigger changes in market conditions in an international context (Chirilă, 2022). It is known that the first appearance of COVID-19 was in China, which required the establishment of various social restriction policies that affected most of the country's economic activities. Its massive development has spread to various countries and can certainly affect economic conditions as a result of the implementation of lockdown policies that limit all activities both at home and abroad.
The estimation results of the dynamic linkage, measured through the TVP-VAR approach for each sector, are presented in Table 2. This table provides detailed insights into the distribution of shocks across various industrial sectors. Notably, the infrastructure sector exhibits the highest shock distribution value, reaching 62.67%. Further analysis of the shock distribution to other sectors reveals that the infrastructure sector contributes 9.45% of the shock to the Basic Materials sector and 9.35% to the Healthcare sector. This interconnectedness is an essential element in understanding the dynamics of the industrial sectors. The results from the Total Connectedness Index, which describes significant variation over the period in analysis, are shown in Figure 2. Connectedness index varies significantly and thus responsive to big economic shocks. The highest value of TVP-VAR reached the end of 2019 and then surged upwards in 2020. The pattern of our findings is supportive of the evidence from Bui et al. (2024), who estimated that the connectedness of the capital market sectors in Vietnam surged and reached its peak at 90% during the COVID-19 pandemic. This indicates that during periods of economic turmoil, the interdependencies among sectors are on the rise, and dynamic linkage measures are important in assessing sectoral vulnerabilities.
Total Connectedness Index.
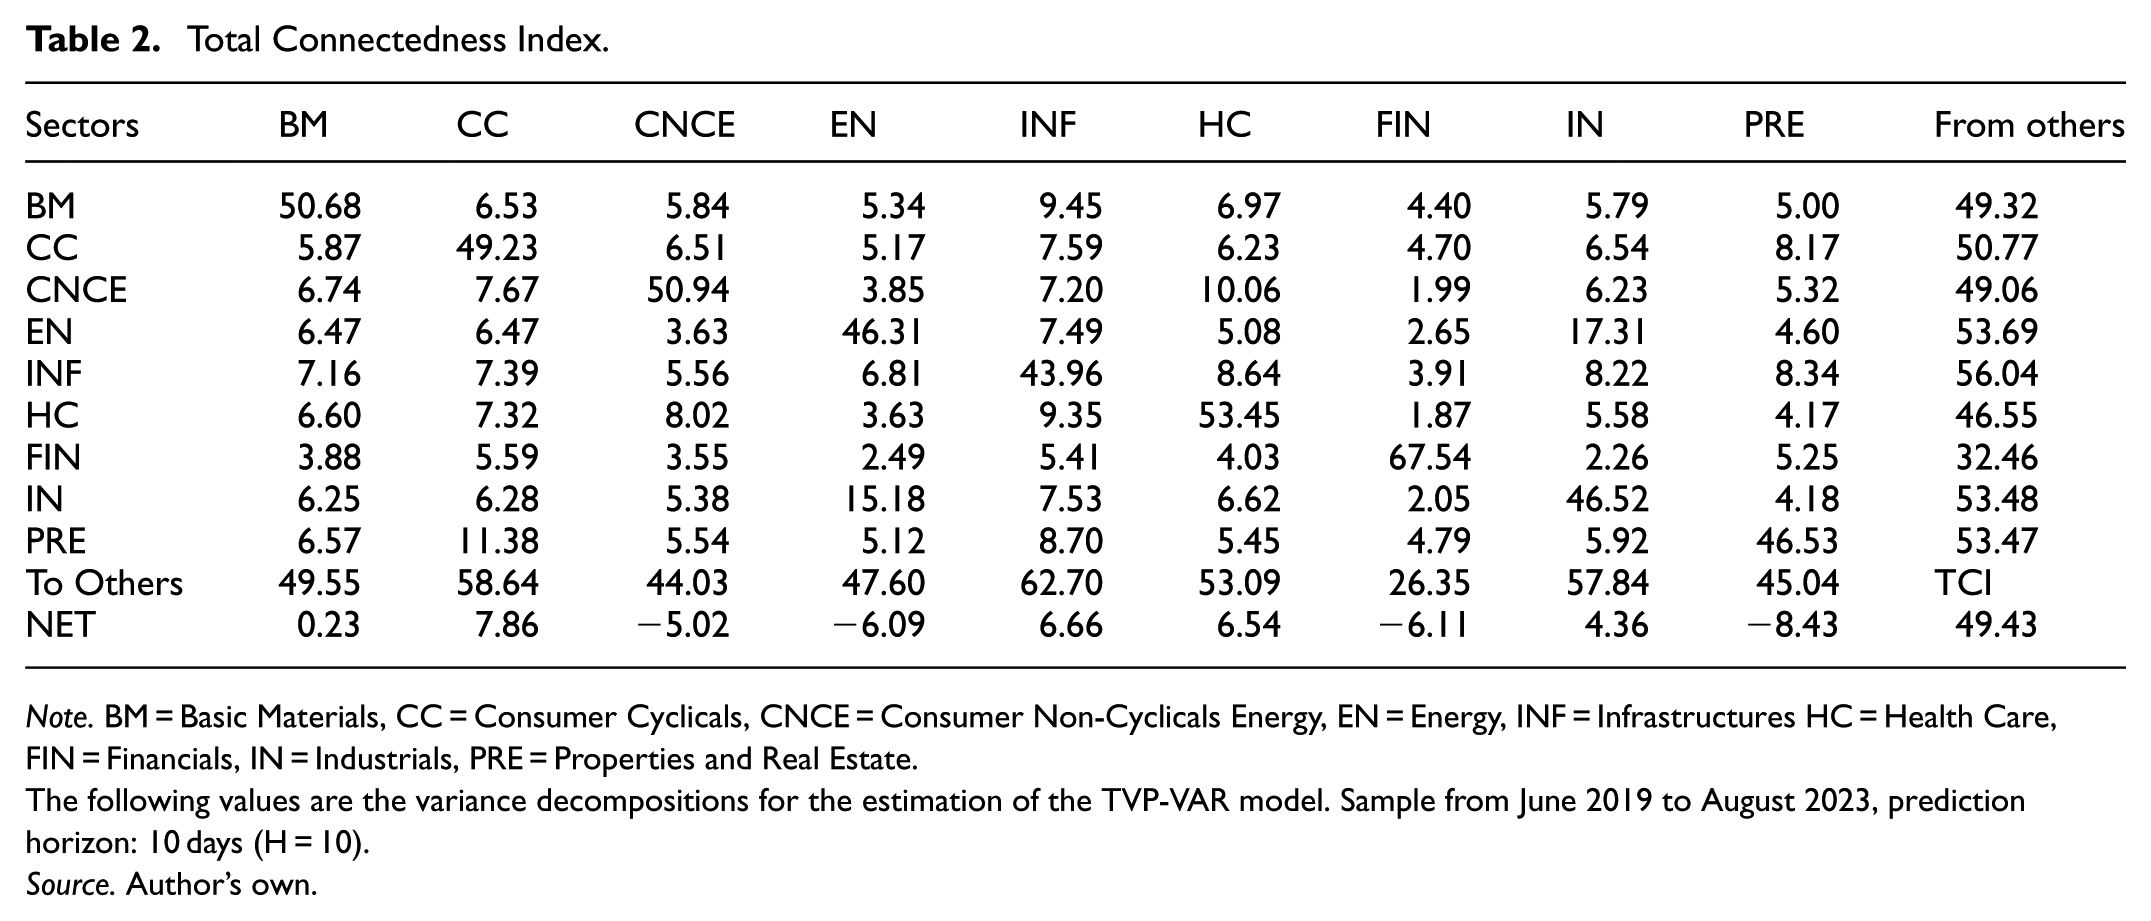
Note. BM = Basic Materials, CC = Consumer Cyclicals, CNCE = Consumer Non-Cyclicals Energy, EN = Energy, INF = Infrastructures HC = Health Care, FIN = Financials, IN = Industrials, PRE = Properties and Real Estate.
The following values are the variance decompositions for the estimation of the TVP-VAR model. Sample from June 2019 to August 2023, prediction horizon: 10 days (H = 10).
Source. Author’s own.

Total connectedness index (TCI).
Spillover effects between the industry sectors of the capital market can be estimated by using the results of the Total Connectedness Index test—TCI (Shen et al., 2022). According to the results, the value of TCI reached 80% at the beginning of the pandemic. From after the pandemic until now, TCI had oscillations around 26% and was trending towards stabilization. This therefore, implies that the COVID-19 pandemic has brought about significant spillover effects of the stock returns between the industrial sectors in the Indonesia Islamic capital market. In addition, Connectedness TO Others is higher in value compared to Connectedness FROM Others. This implies that no sector operates in isolation, and each sector contributes to risk spillover to other sectors (Shen et al., 2022).
Figure 3 illustrates the distribution of sectoral shocks within the Islamic capital market industry, highlighting significant variation in spillover effects across sectors. The data reveal a dynamic response in inter-sectoral connectedness over time, with particularly heightened values observed during the onset of the COVID-19 pandemic at the end of 2019. This period marked a sharp increase in the connectedness index across nearly all sectors, underscoring the intensified interdependencies that arose under economic stress. Notably, the energy sector displayed a remarkable rise in directional connectedness upon entering 2020, reaching levels as high as 75%, indicative of substantial shock transmission to other sectors within the market.
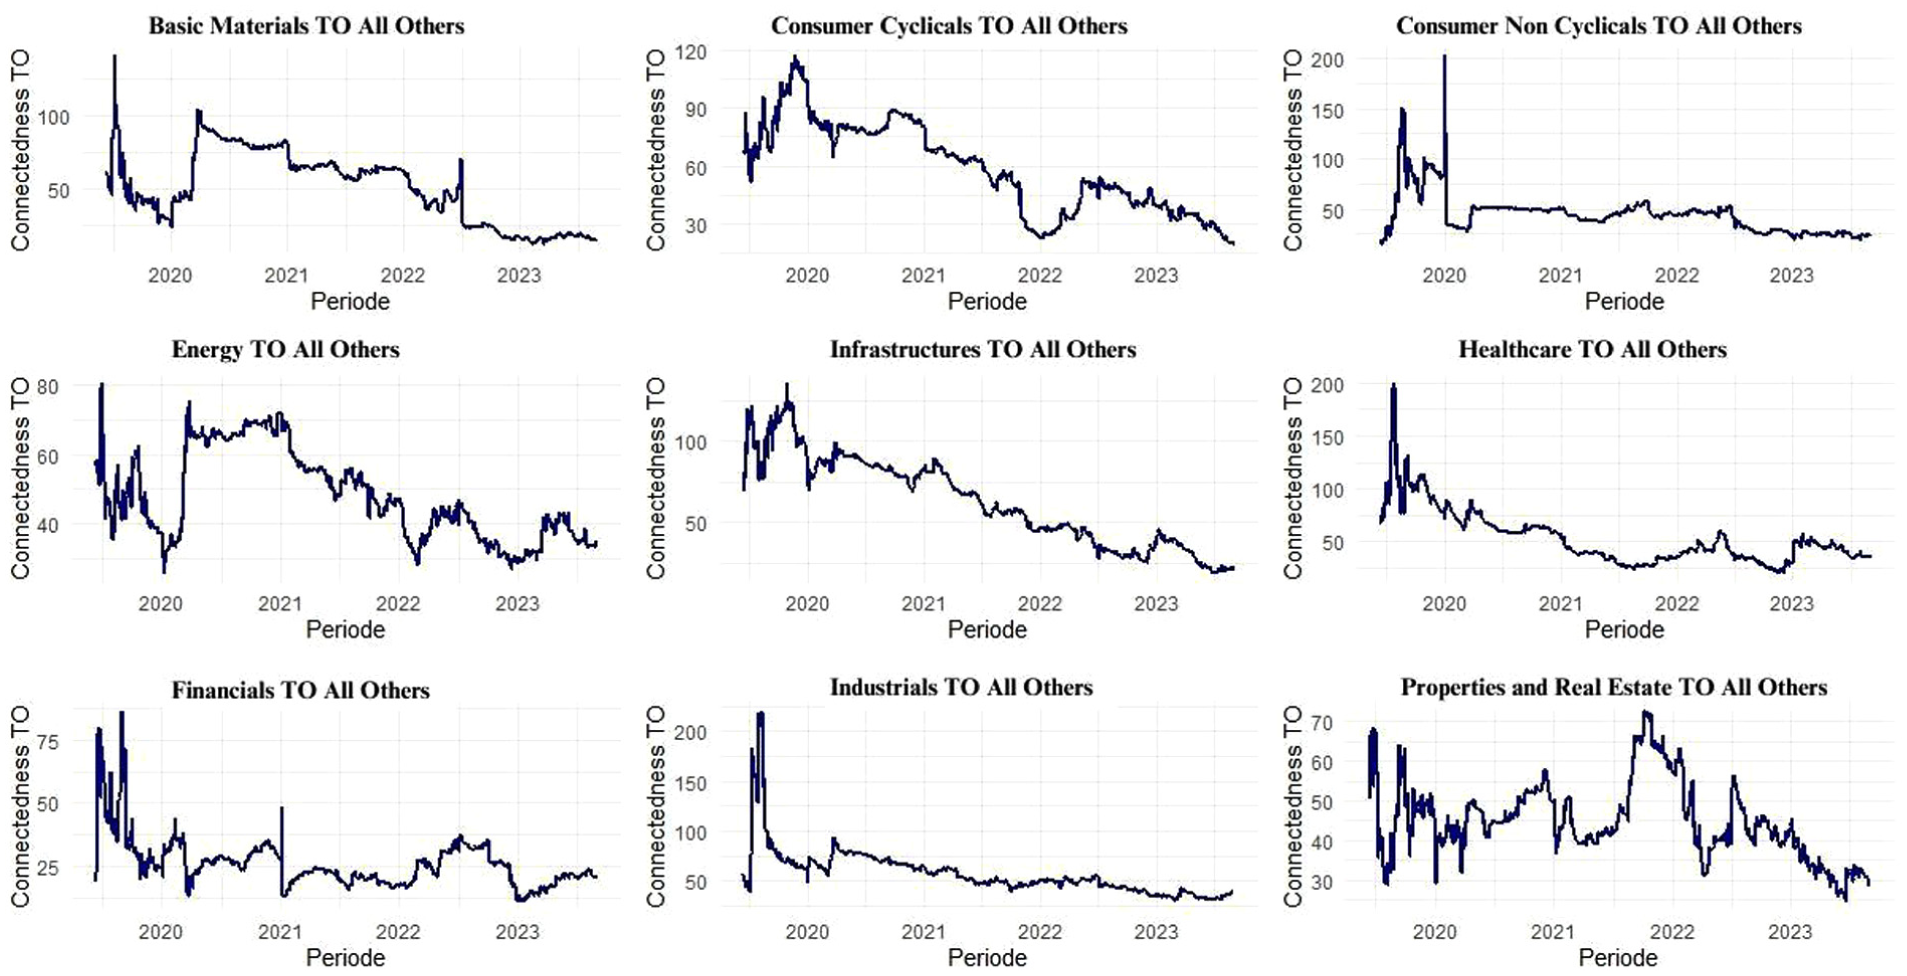
Total directional connectedness TO others.
Following the initial COVID-19 shock, a general trend of declining connectedness values emerged, though certain sectors—such as Consumer Non-Cyclicals, Healthcare, and Industrials—exhibited relatively stable or decreasing directional connectedness over time. These sectors demonstrated a muted propagation of shocks to others, suggesting resilience or sector-specific shock-absorption mechanisms. These observations underscore the non-uniform nature of stock return spillovers, which vary over time and respond distinctly across sectors during periods of economic turmoil, influenced by the unique response dynamics of each sector.
Figure 4 illustrates the total spillover effects received by each industry sector within the Islamic capital market, reflecting the evolving nature of sectoral interdependencies. The Total Directional Connectedness from others shows considerable variation over time, particularly with an upward shift during the COVID-19 pandemic, beginning in late 2019. This trend highlights the pandemic’s extensive impact across market segments, amplifying adverse spillovers experienced by all sectors.

Total directional connectedness FROM others.
For example, the Consumer Cyclicals sector entered the pandemic with connectedness values surpassing 70%, indicating heightened vulnerability to external shocks. As the pandemic subsided around early 2023, a notable decline in connectedness values was observed, with figures ranging between 20% and 30%, suggesting a gradual return to pre-pandemic interdependence levels and stabilization of market dynamics. These findings underscore the substantial impact of economic shocks like COVID-19, which significantly increase directional connectedness from other sectors, revealing the heightened vulnerability and interconnectedness of sectors during periods of crisis.
Net Total Directional Connectedness
The Net Total Directional Connectedness test results provide insight into the roles of sectors as either transmitters or receivers of risk. Table 2 indicates that the Consumer Cyclicals sector exhibits the highest positive value, identifying it as the primary transmitter of risk to other sectors within the capital market industry during the observation period. Conversely, Table 2 shows that the Properties and Real Estate sector holds the largest negative value, suggesting that it is the primary receiver of risk, experiencing the greatest impact relative to other sectors. Each sector’s role can be categorized based on its net directional connectedness value in Table 2. Key transmitter sectors, which act as sources of risk, include Basic Materials, Consumer Cyclicals, Infrastructure, Healthcare, and Industrials. In contrast, sectors such as Consumer Non-Cyclicals, Energy, Financials, and Properties and Real Estate are categorized as receivers, absorbing risk from other sectors. These findings would, therefore, suggest that investors could avoid those industries identified as receivers in an effort to reduce risk since such industries are more vulnerable to the shocks emanating from transmitter industries. This again brings into light the sensitivity of sectors to return dynamics driven by primary risk-transmitting sectors.
This section analyzes net directional dynamic connectedness across sectors. Figure 5 depicts the dynamic of the Net Total Directional Connectedness within the Islamic capital market industry. It gives evidence that, among sectors, the most adversely impacted usually are the Consumer Non-Cyclicals, Energy, Financials, and Properties and Real Estate sectors. These industries show remarkable vulnerability to external shocks and high connectedness level. On the other hand, the Consumer Cyclicals sector represents the highest positive value through the observation period, according to data shown in Table 2, and thus it is considered the leading risk transmitter of the network. Its potential in propagating the shock to the other sectors has highlighted the crucial role this sector plays in the shaping of market dynamics. The Properties and Real Estate sector stands out as the biggest recipient of risk with the highest negative net connectedness. Given the high proneness it has toward adverse impacts, it is a shock sink within the industry where large susceptibility to wider market fluctuations and general economic conditions has occurred.

Net total directional connectedness.
Robustness Test
To ensure the reliability of the results, a sensitivity analysis was performed by modifying key model parameters to examine their influence on the study’s outcomes. The connectedness framework utilized in this research is based on the generalized variance decompositions (GVD) derived from the VAR model, as established by (Diebold & Yılmaz, 2014). This framework incorporates three essential parameters: lag (P), prediction horizon (H), and rolling window size (W). During the robustness evaluation, the prediction horizon (H) and rolling window size (W) parameters were systematically adjusted, while the core model configuration remained fixed at P = 3, H = 10, and W = 200. During the robustness test, the lag remained fixed at 3, while the rolling window size was adjusted to 180, 200, and 220 days, and the prediction horizon was set at 5, 10, and 15 days. As shown in Figure 6, the total connectedness (TCI) curves across these configurations were nearly identical, suggesting that the findings are robust and not sensitive to variations in the W and H parameters. This consistency reinforces the reliability of the research conclusions across different parameter settings.

Robustness check.
First, the sensitivity analysis was done by altering some important parameters to test how such modification impacted the study results. The methodology of the connectedness approach adopted in this paper relies on generalized variance decompositions deduced from the VAR model developed by Diebold and Yılmaz (2014). In summary, there are three important parameters setting up this methodology: lag, order of P, length of forecasting H, and the dimension of the rolling window W. In the case of the robustness test, both parameters of the prediction horizon H and the rolling window size W were changed systematically, keeping the core model configuration fixed at P = 3, H = 10, and W =20. On the other hand, during the robustness test, the lag was fixed to 3, the rolling window size varied at 180, 200, and 220 days, while the prediction horizon varied at 5, 10, and 15 days. It was found that the total connectivity curves for these settings were practically indistinguishable, which means the results are robust and insensitive to the variations of W and H parameters. This reproducibility increases the reliability of the conclusions found under all parameter sets.
Sectoral Return Correlations in Indonesia’s Islamic Capital Market
The degree of co-movement among industrial sectors in Indonesia’s Islamic capital market is measured through the Total Connectedness Index (TCI), which reflects the aggregate spillover effects across sectors over time. During the observation period from June 2019 to August 2023, the TCI ranged from 26% to 82%, indicating that the intersectoral return correlation was both substantial and time-varying. These dynamics imply that shocks to one sector frequently translated into observable volatility in others, suggesting the presence of systemic integration within the sharia-compliant market structure.
The theoretical basis for this analysis draws primarily from Modern Portfolio Theory (Markowitz, 1952), which emphasizes the importance of minimizing unsystematic risk through diversification. However, the efficacy of such diversification diminishes as asset return correlations increase, particularly during periods of heightened uncertainty. The empirical fluctuations in TCI observed in this study reinforce this principle, highlighting periods where the benefits of intra-market diversification were significantly reduced—most notably during the COVID-19 pandemic. This result is consistent with findings by Zaremba et al. (2020), who demonstrated that during the early months of the pandemic, global equity markets exhibited historically high comovements, thereby limiting diversification gains.
Furthermore, the increase in TCI during early 2020 aligns with Contagion Effect Theory (Forbes & Rigobon, 2002), which posits that correlations between assets or sectors spike abnormally during systemic crises due to herding behavior, market panic, and common information flows. This reinforces the notion that the surge in connectedness during the pandemic was not merely a continuation of prior trends but a structural break in market behavior. As illustrated in Figure 2, TCI escalated rapidly with the onset of the pandemic in Indonesia, marking a critical inflection point in sectoral interactions.
In addition, this phenomenon supports the notion from Network Theory (Newman, 2003; Diebold & Yilmaz, 2014) that financial systems are best understood as interconnected networks in which each sector represents a node with varying degrees of centrality. A rise in connectedness implies not only tighter integration but also increased vulnerability to cascading shocks. The magnitude and dispersion of TCI across time therefore capture the evolving topology of risk transmission within the Islamic capital market ecosystem. This is particularly relevant for policymakers, as identifying central sectors in such a network helps anticipate points of systemic fragility.
Empirical robustness was assessed through sensitivity tests on key parameters used in the TVP-VAR framework. The resulting TCI estimates, as presented in Figure 6, exhibit highly consistent temporal patterns across parameter specifications, affirming the reliability of the model in capturing structural changes in sectoral correlations. This robustness enhances the credibility of subsequent directional and net connectedness analyses.
Another relevant theoretical lens is the Efficient Market Hypothesis (Fama, 1970), which asserts that all available information is rapidly incorporated into asset prices. The rapid escalation of TCI during the early months of the pandemic illustrates how the market assimilated health, policy, and macroeconomic information with extraordinary speed, causing synchronized adjustments across sectors. This confirms the tendency of even sharia-compliant markets to exhibit EMH-consistent behavior under crisis conditions, though often moderated by their structural and ethical constraints (Abdelsalam & El-Komi, 2024).
Comparable evidence has been documented in other emerging markets. Shen et al. (2022), in their study of Chinese equity sectors, observed a marked increase in sectoral connectedness during COVID-19. Similarly, Ahmad et al. (2023) reported heightened volatility transmission among Malaysian sharia-compliant sectors, particularly those related to consumer goods and infrastructure. These parallels suggest that the Indonesian experience is part of a broader regional pattern in Islamic financial markets, where sectoral interdependence intensifies during systemic shocks.
Sectoral Return Correlations in Indonesia’s Islamic Capital Market During the COVID-19 Pandemic
The onset of the COVID-19 pandemic in early 2020 marked a critical juncture in global financial markets, with sharp increases in asset correlations observed across sectors and regions. Within Indonesia’s Islamic capital market, the Total Connectedness Index (TCI) surged to approximately 80%, indicating a substantial intensification in return comovements among sharia-compliant industrial sectors. This finding is consistent with the proposition of Contagion Effect Theory (Forbes & Rigobon, 2002), which postulates that market shocks of systemic magnitude lead to abrupt increases in asset return correlations, primarily due to herding behavior, liquidity constraints, and macroeconomic interdependencies.
The structural break observed during the pandemic period reflects the role of common shocks—defined as exogenous, large-scale disturbances that affect multiple sectors simultaneously (Dornbusch et al., 2000). The COVID-19 crisis, which originated in China and rapidly spread globally, introduced synchronized policy responses such as lockdowns and fiscal interventions that disrupted supply chains, suppressed demand, and undermined investor confidence. These common shocks amplified the level of connectedness among sectors, as reflected in the significant upward shift in directional connectedness metrics.
Empirical studies in other economies corroborate these observations. Ahmad et al. (2023) found that sectoral correlations in Malaysia increased sharply during both the Global Financial Crisis (2008–2009) and the COVID-19 pandemic. Polat (2024) similarly documented heightened sectoral connectedness in the U.S. stock market during both the March 2020 outbreak and the 2022 Russia–Ukraine conflict, suggesting that crises of varying nature produce consistent patterns of contagion across markets. The increased TCI observed in this study thus reflects a broader phenomenon of risk synchronization in crisis conditions, particularly within markets that are highly sensitive to global financial and trade disruptions.
From a theoretical perspective, the increased correlation undermines the assumptions of Modern Portfolio Theory (Markowitz, 1952), which relies on the existence of low correlations among assets to optimize diversification. The convergence of sectoral returns reduces the effectiveness of portfolio diversification strategies, especially within a single market such as the JII70, where sectoral exposures are closely tied to domestic economic fundamentals.
Further insights emerge when viewed through the lens of Network Theory (Diebold & Yilmaz, 2014; Newman, 2003). The pandemic elevated the systemic centrality of certain sectors—such as Basic Materials, Infrastructure, and Consumer Cyclicals—which exhibited high “Connectedness to Others” values. These sectors acted as major transmitters of market volatility, suggesting that their macroeconomic sensitivity, exposure to global trade dynamics, and supply chain dependencies positioned them as key nodes within the network of shock propagation. Conversely, sectors like Property and Real Estate, Financials, and Health Care tended to absorb rather than transmit shocks, as evidenced by their higher “Connectedness from Others” values.
These findings also resonate with the Efficient Market Hypothesis (Fama, 1970), particularly in its semi-strong form, where all publicly available information—including health data, policy announcements, and macroeconomic forecasts—is rapidly priced into asset values. The high-speed transmission of shocks across sectors supports the notion of rapid information assimilation and collective investor response.
In summary, the COVID-19 pandemic significantly heightened return correlations across sharia-compliant sectors in Indonesia, transforming the risk dynamics of the market. This underscores the need for investors to recognize the limits of traditional diversification strategies during periods of systemic crisis and to explore alternative hedging mechanisms, including cross-market diversification and asset class reallocation. It also presents a call for policymakers to monitor sectoral interlinkages more closely, as the identification of central and vulnerable sectors may offer early warning signals for financial instability.
Spillover Effects Among Industrial Sectors in Indonesia’s Islamic Capital Market During the COVID-19 Pandemic
The COVID-19 pandemic served as a large-scale exogenous shock that triggered substantial shifts in the intersectoral dynamics of Indonesia’s Islamic capital market. This transformation is captured through the Total Connectedness Index (TCI), which peaked at approximately 80% by the end of 2019, reflecting intensified systemic risk and high return interdependence among sectors. Such a surge in spillover intensity supports the Contagion Effect Theory (Forbes & Rigobon, 2002), which posits that during periods of severe distress, co-movements and risk transmissions among financial assets increase disproportionately due to behavioral convergence and macroeconomic linkages.
The empirical findings are consistent with similar studies across global Islamic markets. For instance, Bui et al. (2024) documented heightened spillover effects in Vietnam’s stock market during COVID-19, while Shen et al. (2022) found that sectoral interactions in China intensified during the pandemic, emphasizing the global reach of systemic contagion. Notably, in this study, the Connectedness TO Others metrics were consistently higher than the Connectedness FROM Others, suggesting that most sectors acted as net contributors to systemic volatility, further emphasizing the interconnected nature of the market.
From the perspective of Network Theory (Diebold & Yilmaz, 2014), this evidence indicates that no sector operates in isolation. Each functions as a node within a financial network through which shocks are both transmitted and received, depending on the sector’s structural position, trade exposure, and investor sensitivity. The asymmetric net spillover dynamics thus help identify systemic transmitters and absorbers, aiding in targeted financial surveillance and investment strategy.
Sector-Level Spillover Dynamics
The sectoral spillover dynamics during the COVID-19 pandemic reveal nuanced patterns of risk transmission and absorption across Indonesia’s Islamic capital market. The Basic Materials sector functioned as a moderate transmitter, with a net positive spillover value of 0.23. It transmitted 49.55% of shocks while receiving 49.32%, indicating a nearly balanced flow that reflects its moderate systemic importance, likely due to its upstream position in industrial supply chains. In contrast, Consumer Cyclicals exhibited a markedly stronger transmitter profile, with a net spillover value of +7.86, having transmitted 58.64% of shocks while absorbing 50.77%. This suggests that sectors sensitive to consumer demand played a critical role in amplifying pandemic-induced volatility across the market.
On the other hand, Consumer Staples acted as a net receiver, with a net spillover value of −5.02, receiving 49.06% of shocks while transmitting only 44.03%. This behavior aligns with the defensive nature of staple goods sectors, which maintained relatively stable demand but remained vulnerable to supply chain disruptions. The Energy sector also operated as a receiver, with a net value of −6.09. This can be attributed to the global slump in oil prices and reduced energy consumption during lockdowns, making the sector particularly susceptible to external shocks from industrial and infrastructure-related activities.
The Infrastructure sector displayed a strong transmitter role, with a net value of +6.66, reflecting its centrality in national economic stimulus measures and its role in sustaining logistics and transport networks. Similarly, Healthcare, a crucial sector during the pandemic, acted as a transmitter with a net value of +6.64. This reflects its heightened market influence due to urgent policy prioritization, increased public and private investment, and a rapid surge in demand for medical goods and services.
In contrast, the Financials sector served as a shock absorber with a net spillover of −6.11. This role likely reflects its indirect exposure to distressed sectors through lending channels, combined with investor risk aversion. Although Islamic financial systems generally operate with lower leverage, contagion effects were still apparent during the crisis period. The Industrials sector demonstrated a dual function, with a slightly positive net spillover of +4.36, transmitting 57.84% of shocks while receiving 53.48%. This suggests that it held a central yet flexible position within the market’s risk network.
Finally, Property and Real Estate exhibited the most pronounced receiver profile, with a net negative value of −8.43. This sector absorbed 57.04% of shocks while transmitting only 45.04%, highlighting its heightened vulnerability to interest rate volatility, reduced investment flows, and declining consumer purchasing power during the pandemic. Collectively, these findings underscore the asymmetrical and dynamic nature of spillover effects among sectors in times of systemic economic distress.
Evolution of Spillovers and Implications
The dynamic net spillover analysis over time (Figure 5) reveals sector-specific shifts in response to pandemic waves. For example, Consumer Staples initially recorded a high net positive value (~150) but declined to negative levels as the pandemic prolonged, indicating an eventual saturation of shock absorption capacity. Likewise, Healthcare’s net role transitioned from +100 to −3, reflecting stabilization after the initial COVID-19 surge. These findings support Kang et al. (2019), who highlighted the significance of understanding intersectoral behavior in designing resilient portfolios during systemic shocks.
The systemic interlinkages revealed in this analysis challenge the assumption of safe havens within Islamic equity markets during crises. Even traditionally defensive sectors like Healthcare and Property transitioned from shock senders to receivers as the pandemic progressed. This suggests that diversification benefits within a single market may erode during periods of extreme stress, reinforcing the need for cross-market hedging and macro-aware asset allocation strategies.
Policy Relevance and Strategic Investment Insights
From a policy perspective, identifying key transmitters (e.g., Consumer Cyclicals, Infrastructure) and receivers (e.g., Property, Financials) is crucial for crafting targeted stimulus. The Indonesian government’s interventions—such as the acceleration of medical equipment licensing via the OSS system in March 2020—illustrate effective sector-focused responses that bolster economic resilience (Badan Koordinasi Penanaman Modal, 2020). For investors, sectors acting as persistent receivers may entail elevated risk during systemic crises. By contrast, understanding the characteristics of consistent transmitters can inform strategic allocation decisions. For example, investors may overweight infrastructure or healthcare during recovery phases, while underweighting property or finance amid early-crisis stages.
Conclusion
This study reveals a significant level of interconnectedness among sectoral stock returns in Indonesia’s Islamic capital market. The Total Connectedness Index (TCI) effectively captures the dynamic nature of these interdependencies, which intensified sharply during the onset of the COVID-19 pandemic, peaking at around 80%, before gradually stabilizing near 26% in the post-pandemic period. The findings indicate that large-scale economic shocks amplify sectoral linkages, while normalization in business activity reduces them over time. The analysis also shows that most sectors act as net transmitters of risk, with the Industry sector identified as the dominant source of spillovers and the Properties and Real Estate sector as the main receiver, underscoring the asymmetric structure of risk transmission within Indonesia’s Islamic market.
Understanding these dynamics is crucial for both investors and policymakers. Investors may adjust portfolio strategies by avoiding highly vulnerable risk-receiving sectors and diversifying toward more resilient industries. Policymakers, meanwhile, can use insights from sectoral spillovers to design targeted interventions, such as stimulating household consumption, supporting key manufacturing and service sectors, and strengthening healthcare and digital infrastructure to enhance market stability and economic recovery. Although the study focuses on nine JII70 sectors over the 2019 to 2023 period, future research could extend the coverage to all eleven Islamic market sectors and a longer time span to capture evolving long-run relationships and the broader resilience of Indonesia’s Islamic capital market.
Research Limitations and Future Directions
This study contributes to understanding intersectoral dynamics within Indonesia’s Islamic capital market but remains subject to several limitations. The analysis covers nine major sectors of the JII70 index, thereby excluding other sectors that could provide a more comprehensive view of market interdependencies. The research period spans June 2019 to August 2023, which may not fully capture long-term structural shifts. Moreover, the pre-pandemic window is relatively short, as the dataset begins only in mid-2019 before the COVID-19 outbreak, potentially reducing statistical power and increasing sensitivity to short-term fluctuations. These limitations were mitigated through robustness checks using alternative rolling windows and forecast horizons, yet pre- versus pandemic comparisons should be interpreted cautiously. Future studies could expand coverage to all eleven Islamic market sectors, extend the observation period to examine long-run patterns, and adopt advanced analytical tools such as machine learning or alternative econometric models. Comparative analyses across regions and the evaluation of policy interventions would further enhance the global relevance and practical value of this line of research.
Supplemental Material
sj-docx-1-sgo-10.1177_21582440251393367 – Supplemental material for Intersectoral Correlations and Spillover Effects in Indonesia’s Sharia-Compliant Capital Market: A TVP-VAR Analysis During Pre-Pandemic and Pandemic Phases
Supplemental material, sj-docx-1-sgo-10.1177_21582440251393367 for Intersectoral Correlations and Spillover Effects in Indonesia’s Sharia-Compliant Capital Market: A TVP-VAR Analysis During Pre-Pandemic and Pandemic Phases by Bayu Arie Fianto, Putri Junita Sari, Christopher Gan, Syed Alamdar Ali Shah, Hesti Eka Setianingsih and Zhahirah Adriana Rahmadany in SAGE Open
Footnotes
Author Contributions
Funding
The authors disclosed receipt of the following financial support for the research, authorship, and/or publication of this article: This study was supported by the International Research Collaboration Top #500 Grant 2023, funded by the Airlangga Research Fund, Universitas Airlangga, Indonesia (Grant No. 359/UN3.15/PT/2023).
Declaration of Conflicting Interests
The authors declared no potential conflicts of interest with respect to the research, authorship, and/or publication of this article.
Data Availability Statement
The data that support the findings of this study are available from the corresponding author upon reasonable request.
Supplemental Material
Supplemental material for this article is available online.
References
Supplementary Material
Please find the following supplemental material available below.
For Open Access articles published under a Creative Commons License, all supplemental material carries the same license as the article it is associated with.
For non-Open Access articles published, all supplemental material carries a non-exclusive license, and permission requests for re-use of supplemental material or any part of supplemental material shall be sent directly to the copyright owner as specified in the copyright notice associated with the article.