
Abstract
The aims of this study were to validate an instrument that measured statistics anxiety and to examine how attitudes toward statistics predict statistics anxiety using the Attitudes Toward Statistics (ATS) Scale for a sample of 323 undergraduate social science majors enrolled in colleges and universities in the United States. A confirmatory factor analysis suggested retaining a revised two-factor model of the Statistical Anxiety Scale (SAS) to measure statistics anxiety, namely, help and interpretation anxiety (
Keywords
As part of the academic training in postsecondary schools, students in the social sciences often are required to take at least one statistics course regardless of their background in statistics or mathematics (Pan & Tang, 2004). These courses are essential because they might be the only formal statistical training that students receive (Onwuegbuzie, 2000). Furthermore, these courses provide the statistical background needed to conduct quantitative research studies and to comprehend empirical research (Birenbaum & Eylath, 1994). For students in nonmathematical disciplines, statistics courses often are associated with negative experiences and high levels of anxiety (Chew & Dillon, 2014). Also, they are considered the most difficult courses in their programs (Chew & Dillon, 2014; Cruise et al., 1985; Onwuegbuzie et al., 2010). There are many aspects of a statistics course that might cause students to experience anxiety (Hanna et al., 2008). In particular, statistics anxiety has been found to cause students to display feelings of depression, frustration, anger, apprehension, nervousness, worry, panic, stress, and emotionality (Onwuegbuzie et al., 1997).
There are many definitions of statistics anxiety, and we adopt the one by Onwuegbuzie et al. (1997) who defined statistics anxiety as the apprehension that occurs when individuals encounter statistics in any form and at any level. Cruise et al. (1985) defined statistics anxiety as “feelings of anxiety encountered when taking a statistics course or doing statistical analysis; that is, gathering, processing and interpreting data” (p. 92). Zeidner (1991) further depicted statistics anxiety as a form of performance anxiety represented by disturbing thoughts of worry, tension, and mental disorganization that arise when people are exposed to statistics content, instructional situations, or evaluative contexts. In addition, statistics anxiety has been defined as being situation-specific because the symptoms may only appear in a particular setting and time (Baloğlu, 2003; Onwuegbuzie, 1999). Unfortunately, these definitions do not identify the relationship that statistics anxiety has with mathematics anxiety and attitudes toward statistics (Chew & Dillon, 2014). Attitudes toward statistics is defined as the “disposition to respond favourably or unfavourably to objects, situations, or people related to statistics learning” (Chiesi & Primi, 2010, p. 309).
Statistics involves more than the manipulation of numbers and solving problems; it encompasses collecting and using data as well as applying the results from the data analysis to inform decisions (Cruise et al., 1985). Baloğlu (2002) confirmed that statistics anxiety and mathematics anxiety were highly correlated (r = .67) but distinct constructs (only 45% shared variance). Statistics anxiety can be redefined as a negative emotional state stimulated from any form of interaction with statistics and exacerbated by negative attitudes toward it. This negative feeling is associated with, but separate from, mathematics anxiety (Chew & Dillon, 2014). When high levels of anxiety are accompanied by negative attitudes and low mathematical competency, students’ overall attitudes toward statistics tend to be low, which is associated with low performance in introductory statistics courses (Chiesi & Primi, 2010). Statistics anxiety is also associated with students’ feelings of anxiety during examinations, which has a small but significant influence on performance (Macher et al., 2013). Likewise, statistics anxiety has been associated with the anxiety experienced by graduate students when writing their research proposals (Onwuegbuzie, 1997). Moreover, statistics anxiety has been shown to hinder performance in statistics courses for approximately 80% of graduate students (Onwuegbuzie, 2004).
Many variables have been examined as predictors of statistics course success (e.g., spatial ability, mathematical ability, standardized test scores, age, gender, and grade point average), but one of the best predictors has been attitudes toward statistics (Kottke, 2000). Although attitudes and anxiety are related, they represent distinct constructs, with attitudes being cognitive and anxiety affective (Mji & Onwuegbuzie, 2004). Research has shown that students’ attitudes toward statistics are influenced by dispositional preexisting course-related and person-related events (Slootmaeckers et al., 2014). While many students react to statistics courses with anxiety and negative attitudes toward statistics, teaching framework can affect both anxiety and attitudes (Dalgleish & Herbert, 2003).
Despite a large body of research on the impact of statistics anxiety on student performance and interventions aimed at reducing statistics anxiety, except Statistical Anxiety Rating Scale (STARS) there is no other psychometrically valid assessment tool in English that exclusively assesses statistics anxiety of students. Validation studies of several of the assessments designed to measure statistics anxiety have failed to produce acceptable psychometric measures (Baloğlu, 2002; Hsiao, 2010; Papousek et al., 2012; Teman, 2013). Therefore, it is imperative to have an assessment tool that yields valid scores to assess statistics anxiety and the impact that it has on student performance, as well as to evaluate potential interventions to reduce levels of statistics anxiety (Hanna et al., 2008). Thus, the goals of the present study were the following: (a) to score-validate an instrument that measures statistics anxiety and can be used by instructors who teach statistics courses for undergraduate social science majors enrolled in social science programs, and (b) to examine the relationship between statistics attitude and anxiety. The scores generated from a score-validated instrument would help teachers better understand their students’ anxiety so they may implement instructional strategies to improve student performance in statistics. Understanding the relationship between statistics attitude and anxiety may be a key factor in addressing students’ fears of learning statistics. An array of negative academic outcomes has been associated with high levels of anxiety and negative attitudes toward statistics for psychology students (Bourne & Nesbit, 2018). Therefore, the present study also involved the use of structural equation modeling (SEM) techniques to understand the nature of the relationship between statistics attitudes and anxiety of students.
Review of the Related Literature
When a person encounters a feeling of anxiety, the specific cause of their overall emotions might be difficult to identify (Williams, 2013). Because of this difficulty, over the years, several measures of statistics anxiety have been developed. One of the most widely used measures of statistics anxiety is the STARS (Cruise & Wilkins, 1980). This 51-item assessment was developed by Cruise and Wilkins (1980) to measure statistics anxiety via the following six subscales: (a) computational self-concept, (b) fear of asking for help, (c) fear of statistics teachers, (d) interpretation anxiety, (e) test and class anxiety, and (f) worth of statistics (Cruise & Wilkins, 1980). According to the STARS developers, computational self-concept refers to the level of anxiety that a student feels when solving mathematical problems and their perceptions of their ability to understand statistics. Fear of asking for help is concerned with the amount of anxiety felt when requesting help pertaining to statistics from another student or a teacher. Fear of the statistics teacher involves the student’s perception of the statistics teacher. Interpretation anxiety is the anxiety that students encounter when they have to make a decision or to interpret statistics data. Test and class anxiety is the level of anxiety felt when students are involved in the statistics class or assessment. Finally, worth of statistics refers to the student’s perception of the usefulness of statistics (Cruise et al., 1985).
Many of the earlier researchers measured statistics anxiety as a multidimensional construct using all six subscales of the STARS (Chew & Dillon, 2014). Since the development of the STARS, several researchers have examined the factor structure of the instrument and recommended that the six-factor model be revised (Hsiao, 2010; Papousek et al., 2012; Teman, 2013). In particular, Baloğlu (2002) examined the construct-related validity of the six-factor model via a confirmatory factor analysis (CFA). The results of Baloğlu’s study revealed that the six-factor model did not fit the data well (goodness-of-fit index [GFI] = .85; comparative fit index [CFI] = .83; and root mean square error of approximation [RMSEA] = .23). Hsiao (2010) later compared a two-factor STARS model consisting of three subscales on each factor with the traditional one-factor STARS model with six subscales using CFA. The CFI, non-normed fit index (NNFI), and RMSEA all showed acceptable values for the two-factor model (CFI = .991, NNFI = .983, and RMSEA = .060), but not for the one-factor model, thereby suggesting that the bidimensional model is a better and more appropriate representation of the data compared with the one-factor model. Papousek et al. (2012) further tested the factor structure of STARS using a hierarchical model with two secondary factors representing subscales more closely related to anxiety (i.e., test and class, interpretation, asking for help) and negative attitudes (computational self-concept, worth of statistics, fear of statistics teachers). Based on the Akaike information criteria (AIC) and the Bayesian information criteria (BIC), they concluded that the hierarchical model with two correlated secondary factors performed as well as did the modified six-factor model. Although both models can be regarded as being acceptable, Papousek et al. (2012) recommended the use of the more parsimonious hierarchical model in which each student would receive two composite scores: a STARS-Anxiety score (average score from the test and class anxiety, interpretation anxiety, and fear of asking for help anxiety subscales) and a STARS-Attitude score (average score from the computation self-concept, worth of statistics, and fear of statistics teacher subscales).
Teman (2013) further examined the structure of the STARS using several measures of fit and concluded that the six-factor model fit the data well. In addition, Rasch modeling was used to examine whether the 51 items effectively measured various levels of the construct on each of the six dimensions of statistics anxiety (Teman, 2013). The results indicated that 20 items did not fit the Rasch model, which suggest that the 51-item STARS should be reduced to a 31-item instrument. Furthermore, a differential item functioning analysis indicated that items on each of the six subscales functioned differently for undergraduate and graduate students. This limits the ability to compare the results of the STARS across these two groups of students (Teman, 2013).
Succeeding the development of the STARS, other instruments have been developed to measure statistics anxiety. In 1991, Zeidner developed the Statistics Anxiety Inventory (SAI) to measure two dimensions of statistics anxiety: test anxiety and content anxiety. Although this instrument did produce acceptable psychometric measures, it was constructed under the assumption that mathematics and statistics anxiety are similar (Zeidner, 1991) and was modeled after the Mathematics Anxiety Rating Scale (MARS; Richardson & Woolfolk, 1980). Similarly, Pretorius and Norman (1992) developed a unidimensional instrument to measure statistics anxiety, namely, the SAS, which was adapted from the Mathematics Anxiety Scale (Betz, 1978). Since the development of the SAS and the SAI (Zeidner, 1991), researchers have found that mathematics anxiety and statistics anxiety are related, but distinct constructs (Baloğlu, 2002; Chew & Dillon, 2014). Earp (2007) later developed the Statistics Anxiety Measure, but like the STARS, the items in this instrument represented six domains, designed under the theories of statistics anxiety and attitude toward statistics.
In 2008, Vigil-Colet, Lorenzo-Seva, and Condon developed a three-dimensional instrument in Spanish exclusively focused on statistics anxiety, the Statistical Anxiety Scale (SAS). This alternative to the STARS contains three subscales of statistics anxiety (i.e., examination anxiety, asking for help anxiety, and interpretation anxiety), with each subscale containing eight items, specifically designed for students in the social sciences. Items on this instrument were developed by a sample of university faculty members who provided situations in which students encountered during a statistics course (Vigil-Colet et al., 2008). According to the developers of the SAS, a high score on examination anxiety would imply that the student has high anxiety when taking statistics examinations. On the contrary, a high score on asking for help anxiety suggests that the student experiences high levels of anxiety when asking a teacher, peer, or tutor questions pertaining to statistics. A high score in interpretation anxiety suggests that the student encounters statistics anxiety when they have to interpret data and to understand formulas used in statistics (Vigil-Colet et al., 2008).
Evidence of construct-related validity for the Spanish version of the SAS was reported by Vigil-Colet et al. (2008) via a factor analysis using 159 participants. The three factors were reported to be correlated, which implies that the three factors are related subscales of statistics anxiety. The reported factor structure, as measured by coefficient alpha, had high score reliability values for the total scale (α = .91), the examination anxiety subscale (α = .87), the asking for help anxiety subscale (α = .92), and the interpretation anxiety subscale (α = .82), which suggest a high internal consistency of the scores. Similarly, examination anxiety and statistics anxiety had omega coefficients of 0.92 and 0.93, respectively. In addition, the three factors explained 70.9% of the total common variance (Vigil-Colet et al., 2008).
Chiesi et al. (2011) further confirmed the factor structure of the Italian version of the SAS. Like past results, the coefficient alpha pertaining to scores yielded by the SAS using an Italian sample was .90, suggesting high internal consistency (Chiesi et al., 2011). In addition, Chiesi et al. (2011) conducted a cross-country validation using multigroup CFA. The results confirmed that there were no statistically significant differences in the factor structure across the versions. Although the factor structure of the Italian and Spanish versions of the SAS have been score-validated, the English version of the SAS has yet to be score-validated (Chiesi et al., 2011). For researchers to identify students with high levels of statistics anxiety or to evaluate the effectiveness of interventions developed to reduce statistics anxiety, a reliable and valid measure of statistics anxiety is imperative (Chew & Dillon, 2014).
Purpose of the Study
The purpose of this study was to determine the psychometric properties of the English version of the SAS scores and their relationship with scores from the Attitudes Toward Statistics (ATS) Scale using a CFA and using the same type of design employed in previous validation studies (Chiesi et al., 2011; Vigil-Colet et al., 2008). The following questions were answered:
What is the factor structure of the English version of the SAS?
What is the relationship between scores on items designed to measure statistics anxiety and those designed to measure attitudes toward statistics among undergraduate social science majors?
To what extent do attitudes toward statistics predict statistics anxiety among undergraduate social science majors?
Method
Participants
The sample consisted of 323 students majoring in a social science field (e.g., psychology, sociology) enrolled in an undergraduate statistics for the social sciences course in the fall semester of 2016 at a college or university in the United States. The majority of the participants were women (74.4%), college freshman (38.4%), and psychology majors (33.1%); participant ages ranged from 18 to 63 (M = 20.5, SD = 5.24, median = 19) years. The largest ethnic representation of participants was non-Hispanic White (57.6%), followed by Black or African American (28.2%). The majority of the participants attended face-to-face, on-campus sessions (76.9%), whereas the remaining participants were enrolled in online courses (16.5%) or a hybrid of face-to-face and online sessions (6.6%).
Sampling Procedure
Based on the type of analysis conducted for this study, it was imperative to have a sample size of at least 300 students. A two-stage sampling procedure was conducted in this study. First, simple random sampling without replacement was used to randomly select institutions with social science programs to participate in the study. Second, network sampling was used to ask instructors of statistics for social science courses to pass along the research opportunity to their students. Previous validation studies administered SAS to undergraduate social science majors (Chiesi et al., 2011; Vigil-Colet et al., 2008). Therefore, participants of similar backgrounds were recruited in an effort to validate the English version of the SAS using a sample of students similar to previous studies.
To identify instructors of statistics for social science courses, a list of colleges and universities in the United States that offer social science programs (e.g., sociology, psychology) as a field of study was obtained from the U.S. College and University Directory (2016). As of August 11, 2016, there were 1,545 institutions in the United States that offered a social science program. Of the 1,545 institutions on the list, 300 institutions were randomly selected to compensate for institutions that might not offer a statistics course for social science at the time of the study and for instructors who might not pass along the research opportunity to their students. The RANDBETWEEN function in Microsoft Excel was used to select 300 numbers from a list ranging from 1 to 1,545. The 300 numbers selected represented the institutions’ positions on the list of institutions with social science programs in the United States (i.e., index number). If a number was selected more than once, the institution was listed only one time. A list of 284 colleges and universities was obtained from this process.
An online search of the 2016 fall class schedule for each of the 284 schools was conducted to identify the colleges offering a statistics course for the social sciences. When an instructor’s name was listed for a course, the institution’s employee directory was searched to locate the instructor’s e-mail address. From this process, a list of 378 instructors from 189 randomly selected colleges and universities that offered a statistics course for the social sciences in the fall were contacted via e-mail regarding the study, along with details regarding voluntary participation, the Institutional Review Board (IRB)–approved informed consent notice, and the link to the online survey. The 378 instructors were asked to pass along the research opportunity to their students.
Students were given an 8-week window to participate in the online survey. Due to the anonymous nature of the survey link, the time of participation or length of time in the statistics course prior to participation is unknown. The 24-item SAS, 29-item ATS, and seven demographic items were uploaded into Qualtrics for students to answer. Students who completed the survey were given the opportunity to enter to win a US$50 Visa e-gift card for their participation. For a student to be entered in the raffle for the e-gift card, they were asked to provide their contact information (i.e., name and e-mail) at the end of the survey, which was used only to contact the winner. Participant contact information was not used in the study and was destroyed after the winner had been contacted.
Sample Size
Several sample size recommendations have been made for studies involving CFA. Based on the statistical theory of CFA, Kahn (2006) suggested the use of a large sample size, well over 100 participants. Likewise, Russell (2002) found that CFA conducted on sample sizes less than 100 cases tend to have inflated chi-square statistics. Therefore, minimum sample size values should be estimated by the number of parameters in the model, similar to the N: k ratio in regression analysis (Russell, 2002). Another common suggestion is that the sample size be determined as a function of the number of variables being analyzed (Stevens, 2009). For example, Bryant and Yarnold (1995) recommended a sample size of at least 10 participants for each item and a participant-to-variable ratio of at least five. Conversely, Wolf et al.’s (2013) Monte Carlo simulation study showed that the minimum sample size-to-item and the participant-to-variable ratio are inaccurate methods for determining sample size of CFA when determining minimum sample size values for CFA; Wolf et al. (2013) suggested that one take into consideration potential measurement error, effects of parameter bias, weak effects, and missing data. Based on the MacCallum et al. (1996) framework, to achieve power of .80, the present study would have needed a minimum sample size of 178 participants. The actual sample size used in this study consisted of 323 participants, which was larger than this recommended sample size (MacCallum et al., 1996). Furthermore, we fitted Samejima’s (1969) graded response model to each of the SAS scales.
Instruments
Participants were asked to complete background information items, the English version of the SAS, and the ATS. The background information instrument consisted of demographic items pertaining to the students’ gender, race, age, college major, classification in college (e.g., freshman, sophomore), and the method of course delivery (i.e., online or on-campus).
SAS
For this study, the English version of the SAS was administered to participants. The English version of the SAS was translated from Spanish by Vigil-Colet et al. (2008) using the back-translation procedure. Details on the back-translation procedure used to translate the survey to English were not provided by Vigil-Colet et al. (2008). This instrument consists of 24 items on a 5-point rating scale (1 = no anxiety and 5 = significant anxiety). Participants were given the option to skip items or select not applicable, both cases were treated as missing data. Half of the items in the instrument were adapted from STARS and the other half were created by Vigil-Colet et al. (2008). All items on the SAS are worded positively and designed to describe common situations experienced by students enrolled in a statistics course. In addition, the SAS was intended to measure three distinct dimensions of statistics anxiety (examination anxiety, asking for help anxiety, and interpretation anxiety) using eight items per dimension. The items of the SAS were administered in the order provided by Vigil-Colet et al. (2008). Subscales were created for each of the three dimensions of statistics anxiety by summing the item totals for each dimension.
Attitude Toward Statistics Scale
The ATS is a 29-item instrument designed to measure the attitudes held by college students toward statistics (Wise, 1985). Student attitudes toward statistics are evaluated on two scales: (a) attitude toward field, which measures their attitudes toward the field of statistics via 20 items; and (b) attitude toward course, which measures their attitudes toward the course via nine items. Each item represents a 5-point Likert-type scale anchored by strongly agree and strongly disagree. The attitude toward field subscale contains 14 positively worded items and six reverse-coded items. All nine items on the attitude toward course subscale are reverse-coded. To score the ATS, after reverse-coding, the item scores from each of the subscales are added to obtain a subscale score and all the items are added to attain a total score. Wise (1985) reported internal consistencies of the subscales of .92 and .90 for attitude toward field and attitude toward course, respectively. Furthermore, Wise (1985) documented 2-week test–retest reliabilities for attitude toward field and attitude toward course subscales of .82 and.91, respectively. In addition, a factor analysis revealed that the subscales accounted for 49% of the total variance (Wise, 1985).
Pilot Test
A pilot test was conducted using a convenience sample of 12 graduate students. The purpose of the pilot test was to determine the clarity of the items in the English version of the SAS translated by Vigil-Colet et al. (2008) and to ensure that the items had the same meanings in U.S. culture. Given that the details on the back-translation process used by Vigil-Colet et al. (2008) were not provided, the pilot test served as an opportunity to examine the content validity of the items. Based on the feedback from the students, 10 items were revised for clarification. Details of these revisions are presented in Table 1. Of the 10 items revised, two of the revised items were adapted from the STARS and the other eight items were created by Vigil-Colet et al. (2008). Many of the revisions were as small as changing one word; for instance, in Item 9, the word doing was changed to completing. Some of the revisions included adding words to the original item for detail. For example, in Item 5, the word tutor was added because a private teacher is referred to as a tutor in the United States. Likewise, the words statistical software (i.e., SAS, SPSS, STATA, R) were added to Item 17 to explain the type of printout.
Revision of Items of the SAS.

Note. SAS = Statistical Anxiety Scale; SPSS = Statistical Package for the Social Sciences; STARS = Statistical Anxiety Rating Scale.
Items adapted from STARS.
Analysis
In this study, there were 60 cases with incomplete data. This represents 18.6% of the sample, which would be a large proportion of data to dismiss. Thus, multiple imputation (MI) estimation was used to adjust for the missing data using Statistical Package for the Social Sciences (SPSS) under the assumption that the data were missing at random. Ten iterations were undertaken. MI involves an iterative process of creating several imputed data sets, each containing different estimates of the missing data that are analyzed, and averaging the parameter estimates to produce one result (Peugh & Enders, 2004). This estimation method was selected because it allows the use of all the data in a data set, and it considers the variability of the data set even if some of the cases are incomplete (Peugh & Enders, 2004).
The internal consistency score reliability for the SAS and ATS was calculated using coefficient alpha. The internal consistency of each dimension of the SAS and the ATS was computed. LISREL 9.1 was used to conduct a CFA to examine the structural validity of the SAS instrument. Diagonally weighted least squares (DWLS) method was used to estimate the model parameters. DWLS is specifically designed for ordinal data (Li, 2016). When conducting a DWLS estimation using LISREL, data can be inputted for estimation by way of the asymptotic variance or the full weight matrix (DiStefano & Morgan, 2014). To allow for the most unrestricted information (Jöreskog & Sörbom, 1996), the full weight matrix was used to estimate the parameters in this study. The goodness of overall model fit was determined by the Satorra–Bentler chi-square (
In addition to examining the structural validity, discriminant validity of the SAS was assessed. This was undertaken to ensure that scores on items from the same factor were highly correlated with each other and that scores on items from different factors were not highly correlated with each other, respectively (Onwuegbuzie et al., 2009). This type of validity was examined to ensure that the items on the SAS measure subscales exclusively related to statistics anxiety as designed (Vigil-Colet et al., 2008). Item parameters from the graded response model also were examined.
Results
Table 2 displays the internal consistencies of the ATS and SAS by way of Cronbach’s coefficient alpha. The recommended benchmark value for coefficient alpha is .70 or higher for research in its early stages of development, .80 or higher for experimental treatments, and .90 as a minimum for clinical research (Nunnally, 1978; Nunnally & Bernstein, 1994). Based on the results shown in Table 2, it was concluded that scores from all the scales and subscales had high internal consistency.
Internal Consistency (Cronbach’s α and 95% Confidence Intervals) for ATS and SAS.
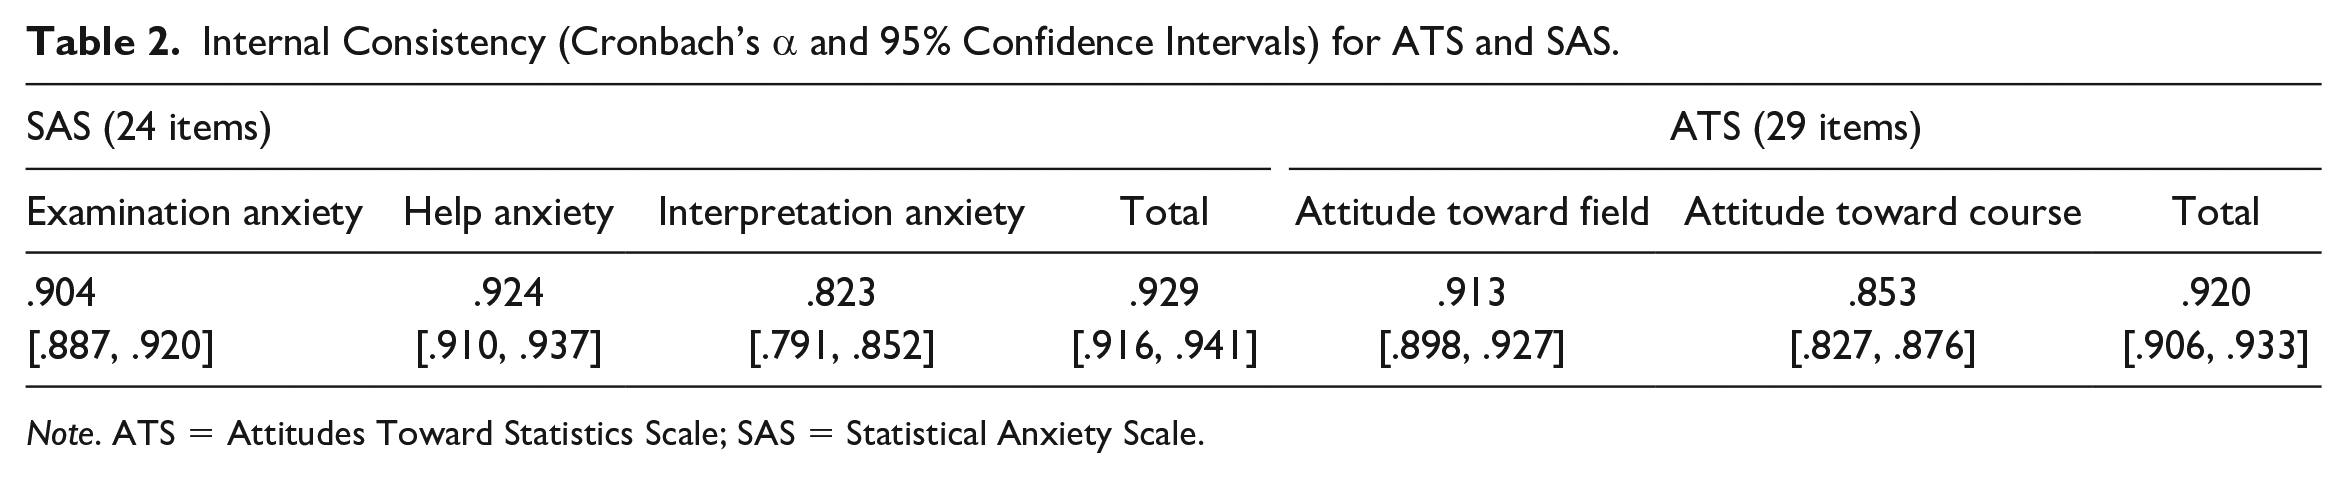
Note. ATS = Attitudes Toward Statistics Scale; SAS = Statistical Anxiety Scale.
Structural Validity
The goodness-of-fit indices for the 24-item SAS and the null model, a single-group CFA, are summarized in Table 3. The one-factor model served as a baseline for model-fit comparison with the three-factor model proposed by Vigil-Colet et al. (2008). As anticipated, the one-factor model had a poor fit to the data; this was indicated by a statistically significant
Fit Statistics of the SAS.

Note. SAS = Statistical Anxiety Scale;
The three-factor model proposed by Vigil-Colet et al. (2008) had substantially better fit than did the one-factor model, but still had a poor fit to the data. The statistically significant
In addition to the correlation residuals, the modification indexes were examined to identify potential adjustments to improve the fit of the two-factor model. The largest modification indexes for the two-factor model were among Items 1, 4, 13, and 20. Based on the similarity in the concept of the four items, the errors among these items were allowed to correlate. The two-factor model had an acceptable fit (
The standardized estimates of the two-factor model are presented in Table 4 and Figure 1. The standardized factor pattern coefficients for all the items ranged from .665 to .874. The correlation between the two factors (examination anxiety and asking for help anxiety) was .588. On ATS, items such as being enrolled in a statistics course making someone nervous, statistics being a mystery, being an unpleasant experience, not wanting to continue more advanced courses, avoiding taking the course, being upset with enrolling in another statistics course, intimidated by formulae, uneasiness dealing with numbers, and the perception that statistics is too complicated belonged to the factor called attitudes toward the course. The rest of the items belonged to the factor called attitudes toward the field. These included usefulness of the subject, belief that a good researcher must be trained in statistics, the course benefiting people, perceiving that statistics did not relate to or be relevant the participant’s field of study, usefulness in applications or generating new knowledge or daily life or professional life or effective citizenship, being worthwhile, being too math-oriented, being an effective consumer of research through knowledge of statistics, and statistics being required early in training.
Standardized Factor Pattern and Structure Coefficients (rs) for the Two-Factor Model.

Note. All factor pattern coefficients were statistically significant at p < .05.

Standardized estimates of the two-factor model of the Statistical Anxiety Scale.
Discriminant Validity
To examine discriminant validity of the SAS, Pearson’s product-moment correlation of the scores of the SAS subscales and the scores of the ATS subscales were evaluated. The correlations are shown in Table 5. The two subscales of the SAS and the two subscales of the ATS had moderate positive correlations (r = .586 and r = .590, respectively). As expected, examination anxiety had a moderately negative correlation with attitude toward course (r = −.575). Therefore, evidence of discriminant validity is supported by the moderate correlations between the variables that were expected to have a low relationship (i.e., examination anxiety with asking for help anxiety, examination anxiety with attitude toward course, attitude toward course with attitude toward field).
Correlations Between the SAS and ATS Subscales.

Note. SAS = Statistical Anxiety Scale; ATS = Attitudes Toward Statistics Scale.
p < .05.
Furthermore, the average variance extracted (AVE) from each factor was compared with the shared variance of the factors. Farrell (2010) described discriminant validity as the extent to which factors measuring the same construct account for more shared variance than do factors not theoretically associated with the construct. Thus, if the AVE of two factors is greater than the shared variance between the same two factors, discriminant validity is supported.
The shared variance and AVE of the factors shown in Table 6 indicate some evidence of discriminant validity between examination anxiety and attitude toward field as well as between asking for help anxiety and attitude toward field. Likewise, the correlations between the SAS factors and the ATS factors support discriminant validity (see Table 5). Shaffer et al. (2016) described discriminant validity as evidence that theoretically distinct factors are not highly correlated.
Shared Variance and Average Variance Extracted From the Factors.

Note. SAS = Statistical Anxiety Scale; ATS = Attitudes Toward Statistics Scale; AVE = average variance extracted.
Attitude as a Predictor of Anxiety
SEM was used to analyze the structural regression model shown in Figure 2 to determine whether attitude toward course and attitude toward the field were predictors of examination anxiety and asking for help anxiety. The SEM estimates are shown in Table 7. Attitude toward field and attitude toward course together explained 28.5% of the variation in students’ examination anxiety scores. Attitude toward field and attitude toward course together explained 11.6% of the variation in students’ asking for help anxiety scores. An evaluation of the structure coefficients and regression beta weights showed that attitude toward course attributed to the largest amount of variation in examination anxiety. Attitude toward course also had the largest contribution to predicting the variation in asking for help anxiety.

Structural part of the structural equation model for predicting statistics anxiety.
SEM Parameter Estimates.

Note. SEM = structural equation modeling.
Item parameters for SAS items are given in Table 8. The constrained model, that is, the model with the discrimination parameter fixed to be the same across all items, fitted the examination anxiety subscale better than did the unconstrained model where the discrimination parameter was allowed to vary across all items. The unconstrained model fit the asking for help anxiety subscale better. The values of the discrimination parameters (all > 2) indicate that the items have desirable discrimination parameter values.
Threshold and Discrimination Parameters for SAS Items.

Note. SAS = Statistical Anxiety Scale.
Discussion
The purpose of this study was to test the psychometric properties of the English version of the SAS (Vigil-Colet et al., 2008), a 24-item instrument designed exclusively to measure statistics anxiety and to understand the relationship between statistics anxiety and attitudes. The overall instrument and subscale levels had high internal consistencies (α = .823–.929), consistent with those reported in previous validation studies (Chiesi et al., 2011; Vigil-Colet et al., 2008). Although the internal consistency of the three-factor model was high, the structure of this model lacked an acceptable model fit for the current sample. After an examination of the correlations between the residuals and the content of the items, a revised two-factor model was proposed and tested. The structure of the two-factor model had an acceptable fit for the current sample. In addition, all items loaded statistically significantly onto their theorized factor, and there was a moderate correlation between the two factors (r = .588).
The two-factor model was developed by removing one item from the asking for help anxiety subscale and one item from the examination anxiety subscale because their residuals were correlated with the residuals of one or more items on the same subscale above the suggested threshold of .10, and the wording of the items were similar, which indicated possible content redundancy. The authors concurred that removing these similarly worded items did not take away from the content of the subscales while also helping reduce the burden of response time on the respondents involved in future research. Removal of these items did not reduce a reliability coefficient of the subscales either. The interpretation anxiety subscale was removed from the model due to seven of the eight items having high residual correlations (i.e., correlation residuals above the suggested .10 threshold) with items from the other two subscales. Likewise, the content of the seven items on the interpretation scale was not related to the subject matter of the other two subscales. One potential reason that the items on the interpretation scale contributed to the unacceptable model fit might be the methods used in the development of the SAS. During the development of instrument, Vigil-Colet et al. (2008) adapted five of the eight items on the interpretation scale from the STARS. During a Rasch item analysis of the STARS, Teman (2013) suggested the removal of two of the items that Vigil-Colet et al. (2008) used on the interpretation subscale due to item misfit. Although not all the items on the interpretation scale examined by Teman (2013) were identical to all the items on the interpretation scale of the SAS, the results of this study still indicate potential validity issues with two of the items selected by Vigil-Colet et al. (2008) to measure the construct.
Discriminant validity of the two-factor SAS was examined to ensure that the factors of the SAS measured only the intended construct—statistics anxiety. This was undertaken to ensure that scores on items from theoretically distinct constructs are not highly correlated (Onwuegbuzie et al., 2009; Shaffer et al., 2016). As expected, the correlations between the two factors of the SAS and the two factors of the ATS provided evidence of discriminant validity. The moderately negative correlation between examination anxiety and attitude toward course (r = −.575) was consistent with previous studies that considered the relationship between statistics anxiety and attitudes toward statistics (Chiesi & Primi, 2010; Mji & Onwuegbuzie, 2004). Furthermore, this negative correlation supports Chew and Dillon’s (2014) definition of statistics anxiety—a negative emotional state stimulated from any form of interaction with statistics and exacerbated by negative attitudes toward it.
In addition to examining the structural validity of the SAS and its relationship to attitude toward statistics, a structural regression model was used to examine the extent to which attitude toward the statistics course and attitude toward the field of statistics predict examination anxiety and asking for help anxiety. Both subscales of attitude explained 28.5% of the variation in examination anxiety, with attitude toward the course having the largest contribution toward examination anxiety (rs = −.87). In addition, the two subscales of attitude toward statistics together explained 11.6% of the variation in asking for help anxiety scores, with attitude toward course being the only statistically significant predictor of asking for help anxiety. This suggests that attitude toward course and attitude toward the field moderately predicted examination anxiety, with attitude toward the course having a stronger influence. Likewise, attitude toward course moderately predicted asking for help anxiety.
The results of this study contribute to the field of statistics education by providing an instrument exclusively designed to measure statistics anxiety. Currently, there is limited research that distinguishes statistics anxiety from related variables such as attitude toward statistics (Chew & Dillon, 2014). Moreover, the two terms are often used interchangeably in research (Nasser, 2004). This might be due to the use of the STARS as a multidimensional measure of statistics anxiety in many of the previous studies on statistics anxiety. Since the development of the STARS, several researchers have examined the factor structure of the instrument and recommended that the six-factor model be revised (Hsiao, 2010; Papousek et al., 2012; Teman, 2013). Furthermore, the STARS was found to measure two constructs, statistics anxiety and attitude toward statistics (Hsiao, 2010; Papousek et al., 2012)—furthering the need to analyze the results of STARS as two composite scores: an STARS-Anxiety score and an STARS-Attitude score (Papousek et al., 2012). Earlier research used all six subscales of the STARS as a measure of statistics anxiety—and therefore examined both statistics anxiety and attitude toward statistics as if they were one construct (Chew & Dillon, 2014). However, the present study shows otherwise.
As researchers continue to evaluate interventions aimed at reducing statistics anxiety and the impact that statistics anxiety has on students learning, it is important to have an instrument that yields valid scores to assess the extent to which students are experiencing statistics anxiety (Hanna et al., 2008). It is suggested that researchers separate statistics anxiety and attitudes toward statistics to prevent multicollinearity (Chew & Dillon, 2014). In sum, this validation of the revised two-factor SAS (see the appendix) provides researchers with an instrument designed solely to measure statistics anxiety. It is recommended that future researchers continue to score-validate the revised two-factor SAS using various samples (e.g., graduate students).
Limitations
As with every study, in the current research study, there were limitations that might have influenced the findings. In particular, although random sampling was used to identify participants, the sample was limited to professors who passed along the research opportunity to their students and students who chose to respond. In addition, the backgrounds of the students (i.e., previous enrollment in statistics courses, reasons for enrolling in course) and students with majors in the pure sciences (e.g., chemistry, biology, mathematics) were not considered in the study. The sample size used in the study was limited. Ideally, we would have liked to have split the sample and conducted exploratory and confirmatory analyses on the two split samples. However, that would have rendered the sample size inadequate for such analyses. Nonetheless, given that previous studies have conducted factor analysis on other versions and languages of the instrument, we believe that CFA along with model modifications were suitable for the present study. Another limitation springs from our sampling procedure, which was to recruit participants by recruiting teachers. It is possible that some teachers were more enthusiastic about encouraging their students to participate while others were not. This might have led to oversampling of students from one classroom. All our items were positively worded to indicate high anxiety. It is unclear whether mixing some negatively worded items would have been a better approach to a psychometrically more valid instrument because it might have avoided “straight-lining” responses. However, we chose not to do this because the construct under study is already negative (statistical anxiety), and negatively worded items might have been difficult to interpret with them becoming a double negative. It would be interesting to see whether a mix of positively and negatively worded items on both the instruments produced higher quality data than the current versions. The items were administered in fixed order. With the items being administered online, randomization of item order might have been used to reduce potential bias. This is an avenue for future research.
Directions for Future Research
Given the number of modifications to the instrument, it is recommended that future researchers conduct confirmatory analysis of the instrument to provide further evidence of reliability of the results. In addition, it is recommended that future researchers examine students from other academic fields enrolled in statistics courses designed for the social sciences. Future studies also should include other variables such as academic achievement and instructional style. It is studies like the present research, as well as other studies such as those that we have recommended, that will lead to score-valid assessment tools not only for assessing statistics anxiety and the impact that it has on student performance but also for evaluating potential interventions to reduce levels of statistics anxiety. Measurement invariance studies that examine difference in the factor structure across various subgroups, such as the one by Frey-Clark et al. (2019) that compared the performance of the instrument across traditional and online learning groups, can shed further light on the psychometric properties of the instrument. Future researchers might want to consider adding the attitudes items to the anxiety items as a single instrument.
Footnotes
Appendix
Declaration of Conflicting Interests
The author(s) declared no potential conflicts of interest with respect to the research, authorship, and/or publication of this article.
Funding
The author(s) received no financial support for the research, authorship, and/or publication of this article.
Ethical Approval
Institutional Review Board (IRB) approval was obtained from the University of North Texas.