
Abstract
This article assesses the differential reactions of firms’ investment to monetary policy shocks based on various financial heterogeneity measures, such as leverage and cash holdings. It applies U.S. public firms’ panel data from the sample period 1990Q1 to 2007Q4 and high-frequency event-study approach. Low-leverage and high cash holding firms react more to monetary policy shocks explaining the different investment activities. For the high-leverage and low cash holding firms, the two monetary policy shock variable interactions are statistically insignificant. However, they are statistically significant for the low-leverage and high cash holding firms. During a contractionary monetary policy period, higher cash holding firms improve investment efficiency. This article strengthens the literature of corporate investment behavior which can assist advance and optimize macrocontrol policies.
Introduction
To control the market, traditionally, the monetary policy is used as an effective weapon of government and regulators. It is one of the important instruments through which the government deals with the economic crisis (Fatás & Mihov, 2003; Yang et al., 2017). The interest rate is the most active tool that passively controls inflation, actively affects government reserve, and assists in fiscal policy (Davig & Leeper, 2011). However, monetary policy’s transmission mechanism is much more complicated than fiscal policy (Taylor, 1995). Recent observations of monetary policies have resurrected how monetary policies affect firms’ investment, particularly their various impacts across different industries and firms. Empirical evidence on how financial heterogeneity across firms affected the transmission of monetary and other macroeconomic shocks is much limited. Therefore, this study focuses on different financial positions across firms, which corporations are the most responsive to monetary policy shocks, and why? Besides, it also addresses the question of whether a firm’s condition affects investment efficiency.
As one of the most important economic growth elements, investment is considered traditional transition mechanisms of monetary policy transmission. Monetary policy affects business investment decisions through two essential channels. First, modification in the interest rate causes fluctuation in capital cost, which affects investment decisions. Second, firms might be affected differently by interest rate changes. In broad credit channels, when market interest rates augment, corporations with fewer collateral might perceive the requisites they face in the debt market worsen more than others. Researchers are keen on the impact of monetary policy on dynamic corporate investment through the diverse transmission channels. Grosse-Rueschkamp et al. (2019) propose that monetary policy affects corporate investment through the interest rate channel and credit channel, adjusting both financing constraints and cost of capital. Zulkhibri (2013) examined that monetary policy fundamentally influences firms’ entrance to external finance when interest rates are increasing. Management science studies recently emphasized micro-enterprises’ decision-making behavior, including macro policies (Fan et al., 2014; Rao & Jiang, 2011). Few studies focused on the impact of monetary policy shocks on investment responses with financial heterogeneity. Regarding these scenarios, it is significant for both policymakers and academic researchers to appraise monetary policy effects on investment behavior.
Financial heterogeneity is principally significant in the presence of demand linkages from monopolizing rivalry, in which corporations’ preferred investment relies on the gross output. This transmission spreads the impact of monetary policy shocks and investment constraints. Integrating financial heterogeneity across firms carries four rationales beyond its interaction with demand balancing. First, it facilitates cross-sectional inferences and connects them to experimental work. It also maintains investment size as a substitute for capital market access and entails asymmetric conduction across corporations. Second, heterogeneity in the entrance to financial markets produces discrepancies in cash holdings. Corporations having severe financing constraints belong to a superior cash/sales ratio. Third, heterogeneity integrates distributional impacts of investment and output. Mean-preserving financial frictions’ spreads harm investment spending and output generation as both are the concavity of corporations’ returns. Finally, heterogeneity eradicates monetary policy results from transitioning to a region in which financial frictions combine all corporations.
However, Cooley and Quadrini (2001) state that when monetary shocks hit the economy, small and large firms’ reaction varies, and small firms choose higher debt–equity ratios as they respond higher than big firms. They also find that small firms’ investment decisions are more responsive than large firms to monetary policy shocks. Gertler and Gilchrist (1994) examine the movement of inventories for firms based on asset size. They cite that younger and premature corporations compensate fewer dividends, retain more debt, and spend more money. Moreover, the amalgamation of monetary shocks and financial frictions can produce the immediate reliance on industry dynamics on size, they state. Some recent studies such as Yang et al. (2017) opine that monetary policy’s corporate investment is affected through both the interest rate channel and the degree of financing constraints. Subsequently, Silva (2019) inspects how heterogeneity of monetary frictions and dominant rivalry influences market parameters such as nominal interest rate, firm cash holdings, and expenditure. Financial restraints swell corporate sensitivity to monetary policy, she adds. Ottonello and Winberry (2018) also scrutinize how monetary policy’s capital transmission relies on corporate heterogeneity. They focus on the functionality of the business cycle and its association with monetary policy shocks.
Objective of the Study
Considering the above scenarios, this study assesses how nonfinancial firms’ financial heterogeneity helps to explain their investment activity using the high-frequency event-study approach with quarterly Compustat data. This study investigates whether an investment activity is more efficient based on firms’ operational conditions during the contractionary monetary policy. Therefore, the objective of this study was (a) to investigate the differential impact of monetary policy shocks on firm investment activity through a leverage position, (b) to examine the various implications of monetary policy shocks on firm investment activity through different cash holding positions, (c) to explore whether cash holdings or leverage positions play a significant role in explaining differential investment responses to monetary policy shocks, and (d) to inspect how monetary policy affects corporate investment efficiency.
The impact of the U.S. monetary shocks on various economies has been evaluated through different channels. The global banking system is adopting the dollar as a global currency that plays a very special role in international financial markets. The dollar is an important funding currency all over the world. Thus, the U.S. monetary policy has a significant cash flow effect, and it has the ability to leverage and change the net worth of economic factors worldwide. Rey (2016) documents that the U.S. monetary policy shocks are transmitted internationally and affect financial conditions in both advanced and emerging economies. Moreover, the U.S. monetary policy has also impact on global financial stability through credit and risk-taking channels. Therefore, we use U.S. data to analyze the impact of monetary policy shocks.
Scope of the Study
In this study, we consider the following sectors: agriculture, forestry, and fishing; mining; construction; manufacturing; transportation, communications, gas, and sanitary services; trade; and utilities. However, we exclude finance, insurance, and real estate or public administration sectors. Publicly traded corporations belong to approximately one third of entire U.S. employment, along with 41% of sales (Silva, 2019). However, the availability of high-frequency identified monetary policy shock begins in 1990Q1. To avoid exceptional circumstances during the great recession and the implications of zero lower bound after the crisis, this study focuses on the sample period 1990Q1 to 2007Q4.
Significance of the Study
Nevertheless, this research varies from earlier studies based on two grounds. First, this study focuses on two financial indicators to measure financial heterogeneity, which are leverage and cash holdings. The first choice of leverage as a financial heterogeneity was measured by Hennessy and Whited (2007) who cited that firms with more leverage would have high default risk and face a higher cost of debt. The next measure is the lagged cash holdings of the firm. A firm with higher cash holdings requires less external financing or faces a lower likelihood of default. Cash holding firms have different hedging and liquidity properties of cash and debt, making them distinct from their borrowing. Cash management also has implications for firms’ investment behavior, explaining heterogeneous spending behavior in response to aggregate shocks. An important concern is that monetary policy shocks are associated with other monetary conditions like gross domestic product (GDP) growth, the inflation rate, and the unemployment rate which may drive the differences across firms. However, the shock identification in this study designs to address this concern. Both leverage and cash holding have the standardized figure to signify that each measure’s units are standard deviations with respect to their mean value in the sample. Furthermore, the firms are grouped into high and low categories based on each financial indicator, such as high-leverage (cash holding) firms having a standardized leverage value, not below the 50% percentile or 5th decile of the standardized full sample leverage. Second, this study also concentrates on interquarter investment dynamics and firms’ investment efficiency through cash holding position during contractionary monetary shocks.
We use changes in the futures’ various interest rates around a policy announcement of the Federal Open Market Committee (FOMC) for constructing monetary policy shocks measured. The study finds that firms with low leverage and high cash holdings are more responsive to monetary policy shocks. When we control the relevance of leverage and cash holding, the causal impact of cash holding firm has a higher standard deviation on different firms’ investments relative to one-period leverage impact.
Connecting to the above findings, this study contributes to the literature that reviews how the impact of monetary policy varies across firms. This study adds some points to the existing literature by examining how different levels of leverage and cash holding firms are connected to investment efficiencies. Furthermore, this study contains some valuable and practical implications. First, investment managers are aware of the importance of leverage and cash holdings in explaining differential investment to monetary policy shocks. Second, policymakers should consider the differential impact of policy instruments on firm investment. They should receive an effective reaction ahead of time to guarantee that the dimension of corporate investment can augment. Third, it is necessary to anticipate the impact of various policy instruments on the company decision-makers’ investment activity.
However, the remaining parts of this study continue as follows. Section “Background” discusses the literature review and hypothesis development. Section “Empirical Design and Methodology” explains the empirical design and methodology. Section “Empirical Results and Discussion” presents the empirical results. Finally, Section “Conclusion” summarizes the study and concludes the findings.
Background
Empirical Literature
There is enormous experimental evidence that the impacts of monetary policy shocks fluctuate distinctly by firms and are persuaded by industries’ financial restrictions because these are unforeseen by market participants in the presence of informational frictions. Besides, central banks do not concern about either current or anticipated changes in economic conditions. Although many researchers nowadays think that monetary policy shocks have a small contribution to macroeconomic outcomes, there is enough literature to identify them. The reason is to estimate the causal effects of money on different variables by identifying unexpected monetary policy changes. There is also substantial growing literature on firm heterogeneity, financial frictions, and their relevance in the aggregate economies. The recent evidence including Grosse-Rueschkamp et al. (2019); Mahathanaseth and Tauer (2019); and Silva (2019) assesses heterogeneity in firms’ responses to monetary shocks. Particularly, Mahathanaseth and Tauer (2019) explored the monetary policy’s association with the extent of bank lending. They cited that smaller and younger banks have a higher degree of loan contraction than large counterparts. Moreover, monetary shocks persuade banks to restrain their loan availability with their demand for interbank borrowing, partly restored with new debt.
Investment is one of the key macroeconomic variables whose fluctuations cause a large fraction of output’s cyclical volatility. The differential reactions of firms to monetary policy have been analyzed by Gertler and Bernanke (1989) where firm heterogeneity is exogenous or does not assume a pivotal job. However, Cooley and Quadrini (2001) examined that the firm’s heterogeneity is endogenous and assumes an essential job in monetary policy shock transmission. However, they find that monetary shocks are not so large but cause greater volatility in financial markets. Later, Silva (2019) states the cash/sales ratio augments the degree of financial restraints and increases with the strength of competition for monetarily constrained industries. Financial restrains elevate corporations’ elasticity to monetary policy. The extent of mean-preserving economic frictions lessens investment spending and output generation, reinforces transference, and decreases finance’s exterior share.
Based on these backgrounds, this study fits into the literature about how the firms with different financial positions are affected by the monetary policy shocks. Crouzet and Mehrotra (2017) have shown that small firms’ higher volatility over the business cycle does not explain financial factors such as leverage and liquid asset holdings, making firm size a weak proxy for financial frictions. Cloyne et al. (2018) assess financial frictions’ role using microdata on firms’ demographics and balance sheet positions in the monetary transmission by looking at the response of capital expenditure to monetary policy surprises. They find that age is another predictor of capital expenditure responses besides leverage and size. Albulescu et al. (2018) examined that firms’ internal and external conditions affect firms’ investment. They find that the liquidity ratio has a positive impact, while leverage has a limited effect on investment dynamics.
After that, Jeenas (2018) studies the responsiveness of fixed capital investment to high-frequency monetary policy shocks conditional on various measures of their financial conditions. The author documents that balance sheet liquidity explains differential investment response to monetary policy shocks. Another related work by Ottonello and Winberry (2018) analyzes corporate investment’s responsiveness to a monetary policy shock by using three financial positions, namely leverage, distance to default, and credit rating. They find that firm’s investment with lower default risk is more responsive to policy shocks. They also identify that a firm with one standard deviation more leverage is less responsive than the average firm about one third after a monetary policy shock.
Furthermore, high-rated firms are also more responsive than other firms. However, the transmission of interest rate fluctuations to investment debt may not be a marginal financing source. In that case, a firm’s cash on hand plays a key role. Yang et al. (2017) use 13,766 firm-year observations of China to examine the effects of monetary policy on corporate investment. They grouped the firms based on regional characteristics such as financial constraints, state ownership, and economic development. They used the opposite value of the M2 growth rate for measuring monetary policy. Their key results show that tightening monetary policies decreases China’s corporate investment, especially for those financially constrained firms, non-state-owned enterprises (non-SOEs), and firms in less developed financial markets. This article focuses on different financial positions across firms, in which corporations are the most responsive to monetary policy shocks. Therefore, the firms are grouped into high and low categories based on each financial indicator (leverage and cash holdings). Besides, we determine whether leverage or cash holdings play more role in explaining differences among firms’ investment responses to shock through a joint regression.
However, Jeenas (2018) consider the heterogeneous responses of investment to high-frequency monetary policy shock across groups of low- and high-leverage firms. He employs the local projections method and extends a heterogeneous firm model to explain the heterogeneous sensitivity to monetary policy shocks. The study finds that low liquid holdings have slow fixed capital growth after monetary policy shocks. In addition, the most significant disparities among firms arise slowly, approximately four to 12 quarters after a shock, and tend to predict lower fixed capital, inventory, and sales growth. This study contributes to firms’ responsiveness to shocks by emphasizing the relevance of cash holding position and introducing extensive margin decisions. However, this article finds that the one-period lag leverage size varies greatly relative to the high-leverage firms’ category than the low-leverage firms’ type. The firms with low leverage respond more to monetary policy shocks relative to firms with high leverage levels. Moreover, our study also depicts that higher cash holding firms respond more, given tight monetary policy shocks close to firms with low cash holding levels in explaining the firms’ different investment levels and interquarter investment dynamics. This study also concentrates on interquarter investment dynamics and firms’ investment efficiency through cash holding position during contractionary monetary shocks.
In reference to this literature, this study contributes by using high-frequency identified monetary policy shocks in conjunction with quarterly firm panel data and by tracing out the full dynamic heterogeneity in firms’ responses conditional on leverage and cash holdings.
Hypothesis Development
Leverage is tightly linked to external finance costs both empirically and theoretically, which exhibits considerable within-firm variation. C. X. Hu (1999) contended that the monetary policy effects on firm investment behavior could be transmitted through leverage. Jeenas (2018) demonstrated that firms with higher leverage tend to experience lower fixed capital and inventory growth during monetary shock. A high leverage ratio indicates that a firm has little internal wealth and growth prospects. On the other side, low-leverage firms have high credit ratings, implying that they are financially healthy and are responsive to the monetary policy, Ottonello and Winberry (2018) explained. Firms with higher leverage face relatively weaker capital accumulation after an unexpected policy rate increases. These arguments lead to the first hypothesis:
Modigliani and Miller (1958) contended that cash possibly matters to a corporation when markets are not frictionless. However, in the presence of financing frictions, firms with a lack of sufficient funds to finance profitable investment would adversely affect corporate investment. Opler et al. (1999) documented that the company needs more cash holding to ensure a safe position against unwilling cash flow volatility for precautionary purposes. When a firm has raised debt in the past, it does not need additional financing. For such a firm, the effective determinants of investment are the current availability of internal funds and the expected returns on cash. During contractionary monetary policy, expanded interest would lessen firm’s profits and investment while a higher cash holding enhances the accessibility of internal finance and decreases external financing cost. These backgrounds lead to the second hypothesis:
Gomes (2001) argues that cash holding is an important determinant and has dominant predictive power of investment behavior irrespective of financial frictions and where a firm is facing external funds costs. The borrowing cost of a company increases more than the policy rates in response to monetary policy shocks. Higher leverage firms also tend to hold less liquid assets in the cross-section of firms. The high-leverage firms do not need additional financing, and it indicates little internal wealth. For such a firm, the current availability of cash holdings determines the investment. Therefore, focusing on only one financial measure separately might be suffering from omitted variable bias. Besides, it indicates that it might be another economic indicator that is behind explaining differential response; therefore, firms’ cash holding plays a key role in the transmission of interest rate fluctuations. These arguments lead to the third hypothesis:
Yang et al. (2017) opine that tightening monetary policy improvises the sensitivity of cash flow. The authors add that cash holding has a significant association with investment efficiency. In a tight monetary policy situation, cash holding improves the efficiency of investment. Again, Gertler and Gilchrist (1994) assert that contractionary monetary policy affects the cash and collateral asset value, which in turn affects the investment both directly and indirectly. Duchin et al. (2010) empirically evidence the association of high cash holding and monetary policy shock. The authors argue that more cash holding gives resilience to firms to absorb monetary policy shocks. Cash holding also has a significant relationship with efficient investment. A higher level of cash holding improves an asset’s collateral value and confirms the least cost internal financing source. This effect also reduces the cost of financing from external sources (Gertler & Bernanke, 1989; Yang et al., 2017). Chen et al. (2011) examined how government intervention affects investment behavior and whether it leads to investment efficiency. These backgrounds lead to the fourth hypothesis:
Empirical Design and Methodology
Data Description
The initial sample comes from the Compustat database in the quarter from 1990 to 2007. The availability of high-frequency identified monetary policy shock begins in 1990Q1. To avoid exceptional circumstances during the great recession and the implications of zero lower bound after the crisis, this study focuses on the sample period 1990Q1 to 2007Q4. After 2008, the Federal Reserve turned to untested monetary policies by cutting interest rates nearly zero to stimulate the economy. The reason for not adding the sample in 2007 is eliminating the zero lower bound on interest rates. However, the following sectors have been considered study samples: (a) agriculture, forestry, and fishing: (Standard Industrial Classification) SIC < 10; (b) mining: SIC∈(10, 14); (c) construction: SIC∈(15, 17); (d) manufacturing: SIC∈(20, 39); (e) transportation, communications, gas, and sanitary services: SIC∈(40, 49); (f) wholesale trade: SIC∈(50, 51); (g) retail trade: SIC∈(52, 59); and (h) services: SIC∈(70, 89) and excluding the financial, insurance, and real estate firms with SIC codes (60, 67) and utilities with SIC codes (40, 49) of the United States because they have a different capital structure. The reasons for applying diverse industry samples are that these corporations have a different capital structure that effectively establishes heterogeneous firms’ investment activities after a monetary policy shock.
Different macroeconomic variables change with the business cycle, and firms’ investment activity might respond to these changes. Therefore, we are using key macroeconomic variables such as GDP growth, inflation, unemployment rate, and lagged values commonly used in the literature. The data for GDP (quarterly) are obtained from the Federal Reserve Economic Data (FRED) database (http://research.stlouisfed.org/fred). The inflation rate and unemployment rate are gathered from the Bureau of Labor Statistics (http://www.bls.gov).
Concerning data preprocessing, the measurements of total assets (atqi,t), property, plant, and equipment (net) (ppentqi,t) having missing or not positive figures are excluded. To further filter the data, this study drops all observed firms for less than 40 quarters to capture a long time dimension unit that is necessary to mitigate endogeneity issues in the estimation.
Firm-Level Variables
We construct firm-level variables from Compustat quarterly data of the U.S. public firms. The panel of publicly listed U.S. firms drawing from quarterly Compustat has enough frequency to study monetary policy. It has a long panel and enormous balance-sheet data, allowing the construction of crucial interest variables. The central measure of firm investment is
Investment
The key dependent variable investment is
Following the previous literature of W. Hu et al. (2020), Escribá-Pérez et al. (2019), Ottonello and Winberry (2018), and Clementi and Palazzo (2016), among others, we also consider fixed assets that help in production as capital stock. From the inspiration of the study of Ottonello and Winberry (2018), we measure the initial value of the capital stock with the first available entry for PPEGT j,t (gross value of property, plant, and equipment) and then construct the capital stock value using PPENT j,t (net value of property, plant, and equipment) as below:

Leverage
The financial position is the firms’ debt-to-asset ratio, that is, leverage ratio. Here, debt is the aggregate short- and long-term debt, and the assets are the book value of assets. For this analysis, the one-period leverage is first standardized to mitigate the impact of higher and lower variances on the firms’ leverage due to the firm’s size. Then, the firms are grouped into high-leverage firms
Cash holding
It is estimated as the proportion between the total of cash, in addition to, short-term investment, and total assets at time t − 1. For this analysis, the one-period lag cash holdings are first standardized to mitigate the impact of higher and lower variances on the firm’s cash holdings due to the firm’s size. Then, the firms are grouped into high cash holdings firms
Tobin’s Q
It is estimated by the proportion of the market value of a firm’s assets to the replacement cost of the firm’s assets, that is, the book value. The market value is registered as the book value in addition to the market value of common stock subtracts the aggregate book value of common stock and deferred taxes.
Research Framework
Identification of monetary policy shocks
Earlier, Sims (1972) developed modern time series methods to investigate the impacts of monetary policy. Then shocks to monetary policy were estimated as shocks to Barro’s stock of money. Later, Sims (1980) and Litterman and Weiss (1985) found that incorporating the interest rates in vector autoregressive (VAR) fundamentally diminished the significance of shocks to the money stock for clarifying yield. Christiano et al. (1996) claimed that a contractionary shock is associated with a persevering decrease in yield by assessing a quarterly VAR with six factors. Romer and Romer (1989) cited that VAR identification schemes fail to control for foreseen monetary policy changes because of endogenous developments in policy instruments and deviations among desired and genuine differences. By using the FOMC’s minutes and making a series of the implied policy target rate, they build up a narrative approach that looks to overcome these issues. The approach uses additional information, for instance, policymakers’ announcements to endeavor money supply from money demand shocks and develops another technique that just considers deviation of the federal funds rate. Thereby, they removed any endogenous movements in the fed funds rate and handled omitted variable bias by removing systematic policy actions. However, it does not separate between the endogenous and exogenous parts of a policy change, which is vital for recognizing monetary policy impacts.
Earlier studies used lower frequency data such as monthly or quarterly. They relied on surveys from various sources such as Reuters and Bloomberg and computed the market’s expectation. Recent studies have been using the intraday data and a shorter event window, which permits increasingly exact command over the endogeneity issues. The high-frequency identification (HFI) approach pioneered by Kuttner (2001) assumed that no other shocks affect federal funds rate expectations around the FOMC announcement window. He measured the target rate surprise by a 1-day change in spot federal funds’ future rate known as MP1 in the literature. Recent literature has numerously used HFI methods to deal with possible impacts of monetary policy changes. Gürkaynak et al. (2004) analyze the U.S. monetary policy’s results using a high-frequency event-study analysis on asset prices. The authors decompose the effects of FOMC announcements on the federal funds rate into two factors: the target factor and the path factor. They measured the impact of these factors on stock prices and found that monetary policy and statements have differing asset prices. Gertler and Karadi (2015) utilized HFI techniques with structural vector autoregression (SVAR) strategies to examine the impact of monetary policy on factors estimating financial frictions and influencing market beliefs about the future path of interest rates.
Thus, a key challenge in measuring monetary policy changes is that the Fed’s endogenous reaction drives a large portion of the fed funds rate (ff) deviation to overall economic conditions. Federal funds futures are a standard financial instrument to isolate the unanticipated component in FOMC press releases. One could assume that measurements are uncorrelated with other structural shocks. The Federal Reserve reports any progressions to its federal funds rate in a planned FOMC public statement around 8 times each year. The information, times, and dates of the FOMC public statements are from Gorodnichenko and Weber (2016), and the Board of Governors of the Federal Reserve framework has been acquired. A current period monetary policy shock can be obtained in Equation 2 and then aggregate the identified shocks to get the quarterly measurement of monetary shock. The information on times and dates of the FOMC official statements and the implied measure of shocks have been acquired from Gorodnichenko and Weber (2016) for the time frame 1994 to 2008. The data on announcement times and measures of shocks for the sample period 1990 to 1994 are taken from Gürkaynak et al. (2004):

where t is the point of time at which the FOMC issues a declaration, fft+∆+ is the federal funds’ future rate after t, fft−∆− is the federal funds’ future rate just before t, D is the number of days in the month, and D / (D − t) changes the way that the federal funds futures settle on the average effective overnight federal funds rate. The window comprises ∆− = 30 min before the declaration and ∆+ = 1 hr after the declaration. Here, a fundamental assumption is that no other factors occurred within the window around the FOMC announcement, which causes a movement to the fed funds futures contracts. A positive εmt stands for a fed funds rate increase, which indicates a contractionary shock. There are two monetary period shocks employed in this analysis. They are the tight window

Federal funds policy shocks, (A) wide window and (B) tight window.
Analytical framework
Following Ottonello and Winberry (2018), panel regression is estimated to study how firms react differently to monetary policy shock based on their financial heterogeneity. We perform the Hausman test of endogeneity, while the test of heteroscedasticity and serial correlation by the Lagrange multiplier (LM) test. The test result does not observe the presence of endogeneity. However, to address the unobserved heteroscedasticity and serial correlation, we adopt generalized least squares (GLS) regression to run the model (Gujarati, 2009; Wooldridge, 2016). The baseline empirical specification is in Equation 3. The dynamics of the differential responses across firms by different leverage positions can be estimated in Equation 4. To study the relevance of firms’ holdings of cash at the time of a monetary policy shock, this study repeats the regression analysis in Equation 5. Then the dynamics of the differential responses across firms by cash holding can be estimated in Equation 6:


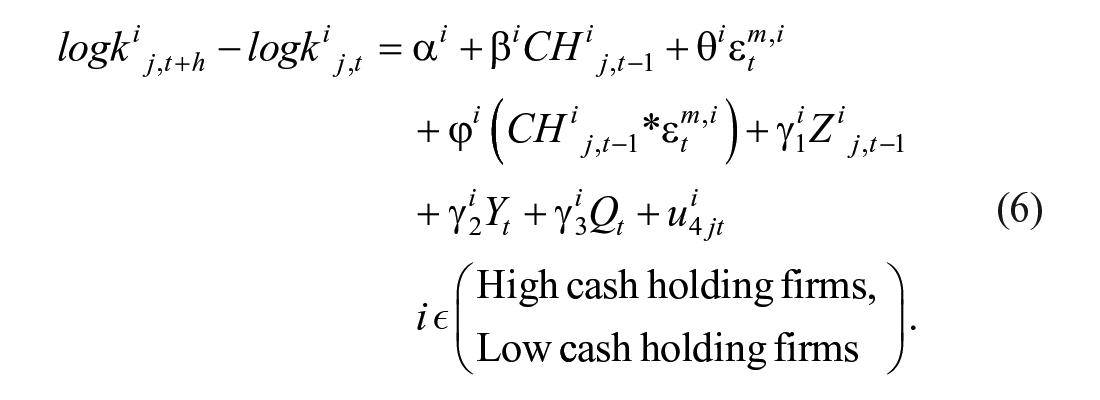
In Equations 3 to 6,
However, the above estimates focused on only one financial condition separately. This might be suffered from omitted variable bias, and it might be other financial indicators that are explaining the differences in responses. Therefore, Equation 7 includes both leverage and liquid asset holdings by estimating the following equation:

The coefficient
Following Chen et al. (2011), the regression for investigating how monetary policy affects corporate investment efficiency can be estimated in Equation 8 as below:
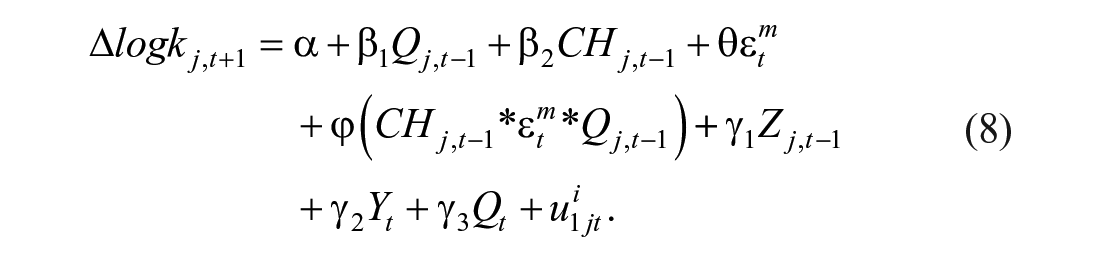
The coefficient term between
Empirical Results and Discussion
Descriptive Statistics and Correlation Matrix
The maximum and minimum level of the firms’ investment difference within the study samples is US$10,716.60 million and −US$420.22 million, respectively (see Table 1). The average value is US$5.06 million and a standard deviation of 123.18. This shows huge fluctuation within the experimented firms with respect to their levels of investment differences. Within the test samples, the tight window monetary policy shock is −53.3 and is 26.10, while the wide window monetary policy shock is −57.10 and 26.10. These two monetary policy shocks windows are greatly varied with their standard deviation values having 11.28 and 11.16, respectively. The differences between these two windows have a mean of 0.24 and a standard deviation of 1.86. The mean of the high- and low-leverage firms is 3.40 and 0.19, respectively, with standard deviations (coefficient of variation) of 31.95 (9.39) and 0.16 (0.84), respectively. This means that one-period lag leverage size varies greatly relative to the high-leverage firms’ category than the low-leverage firms’ category. Their maximum and minimum values are 1,150.06 and 0.56 for the high-leverage firms and 0.56 and 0.00 for the low-leverage firms. Considering the high-leverage firms’ different investment levels, the mean value and standard deviation are 23.68 and 274.51, respectively. For the low-leverage firms, it is 2.65 and 85.67 for mean and standard deviation, respectively. Then,
Descriptive Statistics and Model Summary.

Table 2 shows the pairwise correlation tests among experimented control variables. Based on the result in Table 2, there is a negative and significant relationship between one-period lag leverage of the firms and the period difference investment level, and their value is about 0.0198. This is also the case for one-period lag cash holding of about 0.0082, which is positive and statistically significant. Both one-period lagged values of leverage and the cash holding of the firms are negative, weak, and insignificantly correlated. The one-period lag cash holding is significantly correlated with the monetary policy shocks in the form of wide and tight shock windows. This is not the case for the one-period lag values of leverage. This suggests that a one-period lag cash holding level is responsive to monetary policy shocks relative to one-period lag leverage, which is stated in Hypothesis 3. Based on the correlation coefficient, higher leverage firms tend to hold fewer cash holdings. It needs to be careful in interpreting high cash holdings as an effective measure of liquidity. High cash holding firms might choose them as an alternative to credit lines or trade credit. Considering these issues, we control the firm size for determining the heterogeneity behavior of firms. Generally, a high, positive, and significant correlation exists between the two monetary policy shocks as expected. Tobin’s Q is weak and positively correlated with the monetary policy shocks but insignificant. The different investment level of the firms significantly correlates with the two monetary shock variables with their differences. This suggests that the monetary policy shock windows significantly associate with firms’ different investment levels within the experimented period. These correlations are also considerably positive but have weak influences.
Models’ Pairwise Correlation.

p < .1. **p < .05. ***p < .01.
Stationarity or Unit Root Test
As we are using a panel data set, the cointegration test is not required (Khan et al., 2005). The Im–Pesaran–Shin method is working for our data set. If there is stationarity among the variables, all variables do not possess unit root or time-specific bias. In Table 3, the unit root test panel data have been operated by following the Im–Pesaran–Shin method. In this method, both the null and alternative hypotheses are as follows:
So, from Table 3, it observes that all the variables such as investment dynamics, high- and low-leverage firms, high and low cash holding firms, Tobin’s Q, and monetary policy shocks have a p value near to 0. It means that the null hypothesis has been rejected by all the variables here. That means all the variables are stable and stationary in this data set.
Unit Root Test of Panel Data (Im–Pesaran–Shin Method).

Heterogeneity by Leverage: Hausman Specification Test
The Hausman panel data specification test result is shown in Table 4 for Model 1 (Equation 3). The test results inform better inference techniques to estimate a panel data model based on efficiency and consistency, comparing the random effect and fixed effect estimation results. Under the null hypothesis, the fixed effect estimates are consistent, while random effect estimates are efficient (Holly, 1982). Alternatively, random effect estimation results are inefficient. On the contrary, the fixed effect estimation result is consistent. Based on the test results in Table 4, the model of high-leverage firms is estimated with fixed effect techniques. The chi-square and p value are 280.18 and .000, respectively; therefore, the null hypothesis is rejected. Conversely, the low-leverage firms’ model result is estimated with a fixed effect, even though it is identified using random effect. The test values are 19.01 and .2467, respectively; consequently, this study fails to reject the null hypothesis.
Heterogeneity by Leverage Hausman Specification Test.

p < .1. **p < .05. ***p < .01.
Heterogeneity by Leverage
Table 5 illustrates the fixed effect regression results of Model 1 (Equation 3) using the panel data described in Table 1. Columns 1 to 4 show the regression result from the high-leverage firm subsample category, while Columns 5 to 8 demonstrate the fixed effect estimation results using the low-leverage firm subsample category. In Columns 1 and 5, a simple linear panel data fixed effect robust regression model between one-period lag leverage and the firms’ different investment sizes is fitted. In Columns 2 and 6, the monetary policy shocks in the form of tight and wide windows are estimated. In Columns 3 and 7, the interactions between one-period leverage lag and two monetary policy shocks are controlled. In contrast, other firm-level and macroeconomic level variables are controlled in Columns 4 and 8 for high- and low-leverage firm subsample categories, respectively.
Regression Result of Heterogeneity by Leverage.

Note. Robust standard errors are in parentheses.
p < .1. **p < .05. ***p < .01.
The causal impact conclusions, decisions, and inference are made using Columns 4 and 8 for the two subsample categories, which reveal the estimation results when firm and macroeconomic level characteristics are controlled. From these columns (Columns 4 and 8) in Table 5, the causal impact of leverage in the diversified investment size of the high-leverage firms is negative, about 0.231. For the low-leverage firm, it is also negative and is about 0.916. Moreover, this causal impact is significant for the high-leverage firms compared with the low-leverage firms where one-period lag leverage is statistically insignificant in the low-leverage firms. Furthermore, the monetary policy shock with a tight window is statistically significant and negative for the high-leverage firms but not significant for the low-leverage firms. However, the monetary policy shock, wide window is also statistically significant for high- and low-leverage firms’ categories.
Interestingly, the two monetary policy shock variables’ interactions are statistically insignificant for the high-leverage firms but are statistically significant for the low-leverage firms. These empirical findings confirm the first research hypothesis that the firms with low leverage respond more to monetary policy shocks relative to firms with high leverage levels in explaining the different investment sizes. The firm-level control variable is statistically significant for the high- and low-leverage firm category. The macroeconomic level control variables are statistically significant for the low-leverage firm category relative to the high-leverage firm category. This suggests that the investment level of firms with low leverage is significantly affected by macroeconomic policies.
In contrast, the firm-level characteristics affect the firms’ investment decisions with a high level of leverage. The quarter dummies are statistically significant for all quarters’ low-leverage firms, whereas only the first quarter is significant to the high-leverage firms. These entail other quarter-specific factors that could be unobserved that can explain the variations in the level of firms’ investment decisions.
Based on models’ summary statistics, all the independent covariates used in the estimation explains 86.6% and 76.8% of the variations in firms’ different investment sizes for high- and low-leverage category, respectively. These covariates are jointly significant for which the p value of the F statistic is .000.
Investment Dynamics by Leverage: Hausman Specification Test
Based on the results in Table 6, the model of low-leverage firms is estimated with fixed effect techniques, for which the test values are 138.42 and .000, respectively, and accordingly, the null hypothesis is rejected. Conversely, the high-leverage firms’ model result is also estimated with a fixed effect, even though it can be identified applying the random effect. The statistic values are 11.09 and .3507, respectively, for which this study fails to reject the null hypothesis.
Investment Dynamics by Leverage Hausman Specification Test.

p < .1. **p < .05. ***p < .01.
Investment Dynamics by Leverage
Table 7 shows the fixed effect regression results of Model 2 (Equation 4) using panel data described in Table 1 and Table 4. The causal impact of one-period lag leverage on the high-leverage firms’ investment dynamics is negative, and the figure is about 0.235. For the low-leverage firm, it is also negative and is about 1.567. This causal impact is statistically significant both for high- and low-leverage firms. Furthermore, the monetary policy shocks with tight and wide windows are insignificant for both the high- and low-leverage firms. The interactions of two monetary policy shock variables are significant for the high-leverage firms, but they are insignificant for the low-leverage firms. These empirical findings demonstrate that the firms with high leverage respond more, given monetary policy shocks, than firms with low leverage levels in explaining the firms’ interquarter investment dynamics. This also suggests that the quarter investment dynamics of firms with high leverage is significantly affected by macroeconomic policies. Then the firm-level characteristics affect the quarter investment dynamics of the firms with a low level of leverage. All independent covariates used in estimation explain 71.8% and 74.9% of the firms’ different investment levels for the high- and low-leverage category. These covariates are jointly significant for which the p value of the F statistic is .000.
Regression Result of Investment Dynamics by Leverage.

Note. Robust standard errors are in parentheses.
p < .1. **p < .05. ***p < .01.
Heterogeneity by Cash Holdings: Hausman Specification Test
Based on the results in Table 8, the model of low cash holding firms is estimated with fixed effect techniques for which test statistic and p value are 60.12 and .0467, respectively. Consequently, the null hypothesis is rejected. Then, the model of high cash holding firms is estimated with fixed effect techniques with test values 158.17 and .000, respectively, for which the null hypothesis is also rejected.
Heterogeneity by Cash Holdings Hausman Specification Test.

p < .1. **p < .05. ***p < .01.
Heterogeneity by Cash Holdings
Table 9 demonstrates the fixed effect regression results of Model 3 (Equation 5) using the panel data described in Table 5 and Table 1. The causal impact of cash holding on the diversified investment level of high cash holding firms is positive, which is about 3.598. For the low cash holding firm, it is also positive and is about 4.867. Moreover, this causal impact is statistically significant for high and the low cash holding firms. Furthermore, the monetary policy shock with a tight window is insignificant and positive for the high cash holding firms.
Regression Result of Heterogeneity by Cash Holdings.

Note. Robust standard errors are in parentheses.
p < .1. **p < .05. ***p < .01.
However, the monetary policy shock with a wide window is also significant for the high cash holding firms. However, these parameters are not significant for the lower cash holding firm category. The two monetary policy shock variables’ interactions are insignificant for the low cash holding firms but are substantial for the high cash holding firms. These empirical findings corroborate the second research hypothesis that the firms with high cash holding respond more, given monetary policy shocks relative to firms with low cash holding levels in explaining the firms’ different investment levels. The trained independent covariates explain 86.2% and 82.8% of the firms’ different investment levels for the high- and low-leverage category. These covariates are jointly significant, for which the p value of F statistic is .000.
Investment Dynamics by Cash Holdings: Hausman Specification Test
Based on the data in Table 10, the model of high cash holding firms is estimated with fixed effect techniques where the test values are 152.42 and .000, respectively; and the null hypothesis is rejected. Conversely, the low cash holding firms model result is estimated with fixed effect, even though it can be estimated using random effect because we fail to reject the null hypothesis, for which the values are 22.12 and .2734, respectively.
Investment Dynamics by Cash Holdings Hausman Specification Test.

p < .1. **p < .05. ***p < .01.
Investment Dynamics by Cash Holdings
Table 11 shows the fixed effect regression results of Model 4 (Equation 6) using the panel data described in Table 1 and Table 8. The causal impact conclusions, decisions, and inference are made using Columns 4 and 8 for the two subsample categories, which show the estimation result when firm and macroeconomic level characteristics are controlled. From these columns (Columns 4 and 8) in Table 11, the causal impact of one-period lag cash holding on high cash holding firms’ investment dynamics is positive and is about 0.303. In contrast, for low cash holding firm, it is also positive and is about 0.932. Moreover, this causal impact is statistically significant for both categories of firms.
Regression Result of Investment Dynamics by Cash Holdings.

Note. Robust standard errors are in parentheses.
p < .1. **p < .05. ***p < .01.
Furthermore, the monetary policy shocks with tight and wide windows are statistically insignificant on both of the firms’ types. The interactions of tight monetary policy shock variables are significant for high cash holding firms, but they are unimportant for low cash holding firms. These empirical findings explain that the firms with high cash holding respond more, given tight monetary policy shocks relative to firms with low cash holding levels explaining the firms’ interquarter investment dynamics.
Joint Model: Hausman Specification Test
The Hausman panel data specification test result is shown in Table 12 for Model 5. Under the null hypothesis, the fixed effect estimates are consistent, while random effect estimates are efficient. Alternatively, random effect estimation results are inefficient, but the fixed effect estimation result is consistent. Based on the test results of 293.74 (chi-square) and .0000 (p value), the joint model is estimated with fixed effect techniques for which the null hypothesis is rejected.
Joint Model Hausman Specification Test.

p < .1. **p < .05. ***p < .01.
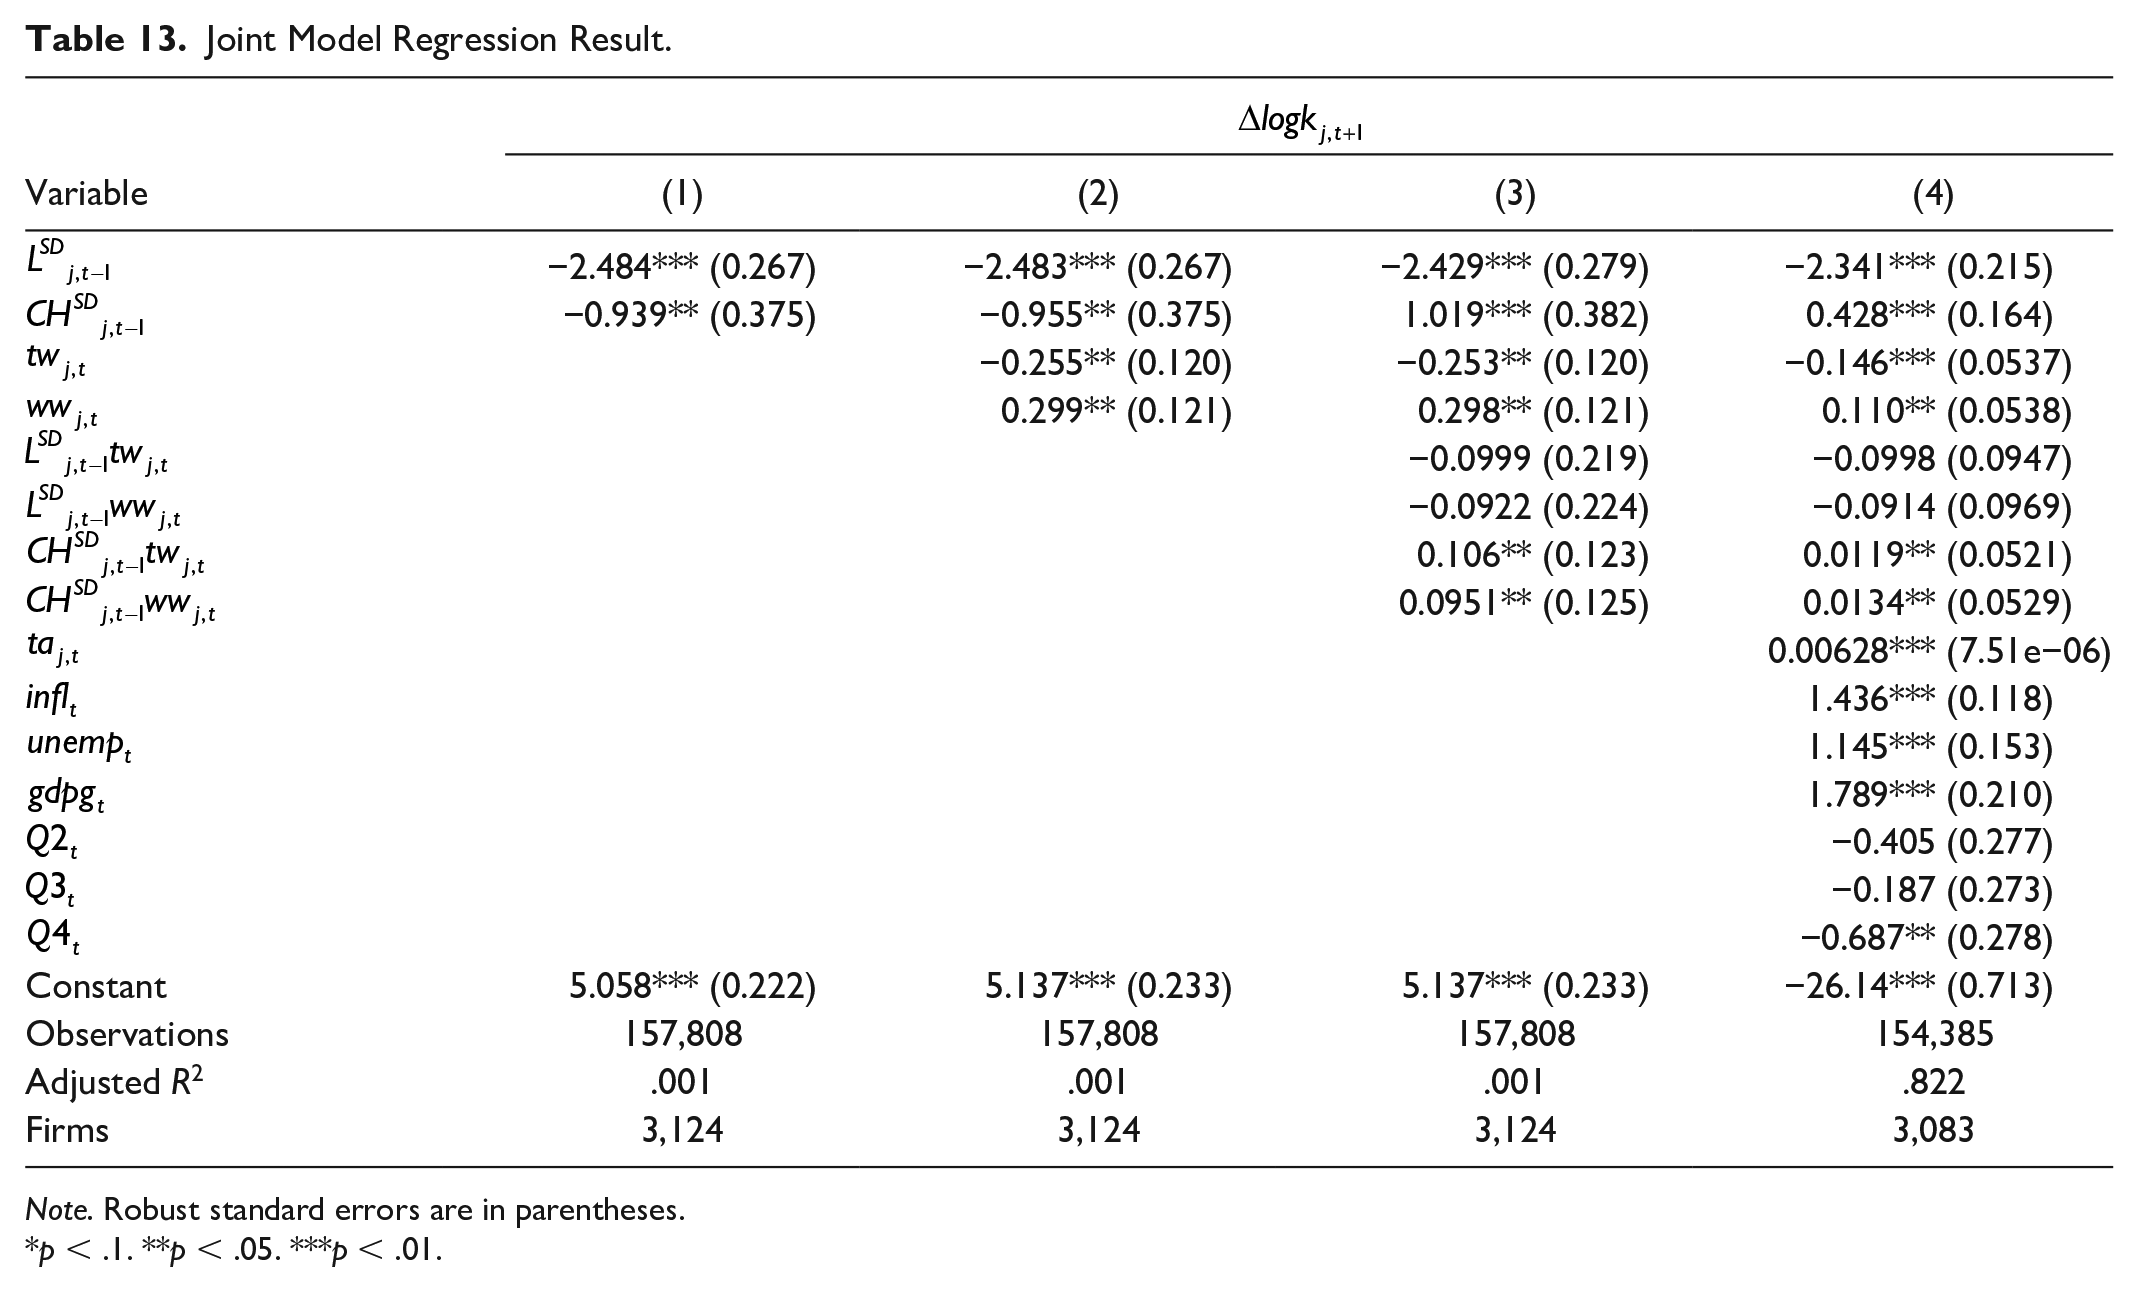
Joint Model Regression Result
Table 13 demonstrates the fixed effect regression results of Model 5 (Equation 7) using the panel data described in Table 8 and Table 1. From Column 4 in Table 13, the causal impact of cash holding has a higher standard deviation, and its effects on different firms’ investments are about 0.428 relative to one-period leverage impact. This shows that cash holding has a higher influence on firms’ investment size relative to one-period leverage lag which is about −2.341. It confirms the third hypothesis of the current experiment, which validates that the cash holdings play a more significant role in explaining differential firm’s investment response to monetary policy shocks than leverage. Moreover, this standardized causal impact is statistically significant in both variables. Furthermore, the monetary policy shocks with tight and wide windows are also significant in the model.
Joint Model Regression Result.
Note. Robust standard errors are in parentheses.
p < .1. **p < .05. ***p < .01.
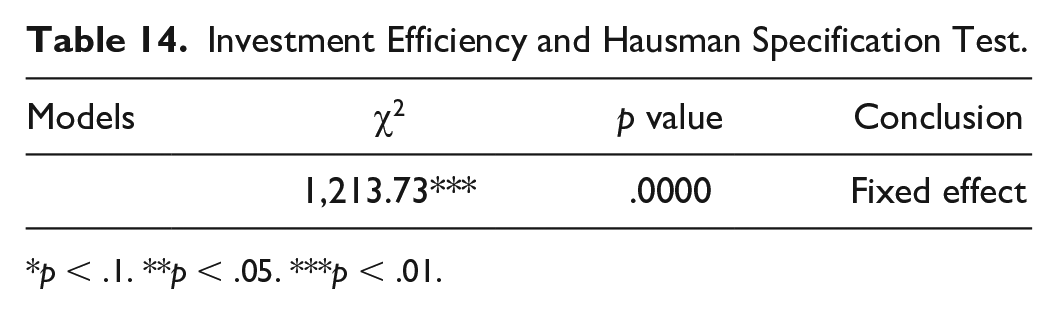
Investment Efficiency: Hausman Specification Test
The Hausman panel data specification test result is shown in Table 14 for Model 6 (Equation 8). Based on the test results, the efficiency model is estimated with fixed effect techniques with test statistics of 1,213.73 (chi-square) and .0000 (p value), respectively, for which the null hypothesis is rejected.
Investment Efficiency and Hausman Specification Test.
p < .1. **p < .05. ***p < .01.
Investment Efficiency and Model Regression Result
Principally, Model 6 is fitted only with the sample’s observation that satisfies positive monetary policy shocks. It also claims that tight shock windows and wide shock windows have statistically positive impacts, signifying contractionary monetary policies’ approval. Table 15 explains the fixed effect regression results of Model 6 using the panel data described in Table 1. Columns 1 to 4 illustrate the regression result from the efficiency model. The cash holding enhances the firm’s investment in the models, and it also increases the corporate investment efficiency level during the contractionary monetary policy. Based on the model’s summary statistics, trained independent covariates applied in the estimation explain 85.7% of the firms’ different investment levels. These covariates are jointly significant for which the p value of F statistic is .000.
Investment Efficiency and Model Regression Result.

Note. Robust standard errors are in parentheses.
p < .1. **p < .05. ***p < .01.
Robustness Analysis
Table 16 presents the estimation for joint regression specifications by employing measures of monetary policy shocks εmt constructed using the approach of Romer and Romer (2004). More specifically, the shock series constructed in this study by following the shock series of Ramey (2016). The monthly Romer-Romer (R&R) shock series has been aggregated quarterly, making summation within the quarter.
Robustness Test.

Note. Robust standard errors are in parentheses.
p < .1. **p < .05. ***p < .01.
In Table 16, Columns 1 to 4 show the regression results for leverage, and Columns 5 to 8 explain cash holdings. In Columns 1 and 5, the one-period lag cash holding and leverage, and the different investment levels of the firms are fitted, respectively. In Columns 2 and 6, R&R monetary policy shocks are controlled. In Column 3, the interactions between one-period lag leverage and R&R monetary policy shocks are estimated. After that, in Column 7, one-period cash holding lag and the R&R monetary policy shocks are also explained. The other firm-level and macroeconomic level variables are illustrated in Columns 4 and 8. From these illustrations (Columns 4 and 8), the causal impact of cash holdings has a higher standard deviation, affecting the firms’ different investments, which is about 4.635 relative to one-period leverage impact. This shows that cash holding has a higher influence on firms’ investment levels relative to one period of leverage lag, which is about −0.0485. Moreover, this standardized causal impact is statistically significant for both variables.
Furthermore, the monetary policy shocks are also significant based on the model’s summary statistics. Independent covariates used in estimation explain 82.2% of the variations in firms’ different investment levels. These covariates are jointly significant for which the p value of F statistic is .000.
Findings
The above experimentations and discussions about monetary policy shocks on dynamic corporate investment illustrate the following findings:
The one-period lag leverage size varies greatly relative to the high-leverage firms’ category than the low-leverage firms’ category.
The monetary policy shock windows significantly associate with firms’ different investment levels within the experimental period.
The firms with low leverage respond more to monetary policy shocks than firms with high leverage levels in explaining the different investment sizes.
The firms with high leverage respond more, given monetary policy shocks relative to firms with low leverage levels explaining the firms’ interquarter investment dynamics.
The firms with high cash holding respond more, given tight monetary policy shocks relative to firms with low cash holding levels explaining the firms’ different investment levels and interquarter investment dynamics.
The cash holdings play a more significant role in explaining differential firms’ investment response to monetary policy shocks than leverage. It also enhances the firm’s investment in the models and increases the corporate investment efficiency level during the contractionary monetary policy.
Conclusion
Corporate investment is affected by the macroeconomic policy environment. Monetary policy is one of the important macroeconomic variables which affect the investment decision of corporation. It is well known that investment is one of the key channels of monetary transmission in a range of standard macromodels. Despite this, there is still relatively little evidence on how firm investment is affected by monetary policy and which type of firms are likely to be the most responsive to monetary policy changes with different financial heterogeneities. In line with this background, in this article, we combine high-frequency instrument techniques with the U.S. nonfinancial public firm panel data to analyze the effect of structural monetary policy shocks on firm investment based on their financial conditions. It has been found that both firms with lower leverage and higher cash holdings at the time of a monetary shock tend to experience higher capital stock, that is, low-leverage firms and higher cash holding firms are more reactive to monetary policy shocks. The cash holdings play a more significant role in explaining differential firms’ investment response to monetary policy shocks than leverage. It also enhances a firm’s investment and increases the corporate investment efficiency level during the contractionary monetary policy. This fact motivates the necessity of studying firms’ asset and liquidity management besides their methods of financing. Another important finding is that cash holding has a higher impact on firms’ investment levels than one period of leverage lag.
The findings suggest that firms’ liquid assets are playing a pivotal role in their ability to finance investment and debt, which should not be considered the marginal source of financing at every moment. Therefore, the interest rate on debt becomes inconsistent with the opportunity cost of investment. Moreover, this study analyses the effects of public policy on corporate investment, which have implications on central banks who might reconsider the monetary policy to encourage corporations’ investment activity. High-leverage firms should have to pay more attention to monetary authorities. These results may be of independent interest to policymakers concerned about monetary policy’s distributional ramifications across firms. Policymakers need to make prejudgment about the impact of various policy instruments executed by fiscal experts on investment opportunities and corporate funds. Then, policymakers should also focus on improving corporate investment efficiency by considering the more significant leverage and cash-holding position. Company decision-makers should consider the impact of various policy instruments on corporate investment and take an active response in advance. From a theoretical point of view, this study’s findings assemble a bridge between the existing literature that accumulates monetary policy parameters to corporate investment dynamism and the background that focuses on macroeconomic aggregates as an interpreter of asset returns.
However, the study limitation is the sample period from 1990Q1 to 2007Q4. The monetary policy’s unavailability shocks measure from the federal funds’ future rate, to avoid exceptional circumstances around the Great Recession and eliminate the issue of zero lower bound. Furthermore, this study’s constraint is that to measure cash holdings, the firm’s cash-to-asset ratio is considered that may suffer from endogeneity. Besides, the measures of monetary policy shocks are more macroeconomic oriented. More microeconomic focused and firm-level data can be a better predictor of corporate investment decisions of firms. These issues remain as a future avenue for the next experimentations. Besides, adding quarterly data after 2007 and observing prefinancial and postfinancial crisis monetary policy shock over heterogeneous investment activities will be another line of research. This extension is planned to conduct in the future studies of this project.
Footnotes
Data Availability
Data are available from the public sources cited in the text.
Declaration of Conflicting Interests
The author(s) declared no potential conflicts of interest with respect to the research, authorship, and/or publication of this article.
Funding
The author(s) received no financial support for the research, authorship, and/or publication of this article.