
Abstract
The article investigates the relationship between demographic burden and insurance market by employing panel vector autoregression models with six groups of endogenous variables to a dynamic panel data set of 25 economies for the period 1980–2016. Demographic burden is represented by dependency ratios measured in respect to the population younger than the age of 15 (young-age dependency ratio), population above the age of 64 (old-age dependency ratio) as well as males and females above the age of 64 being examined separately. As indicators of insurance market development, life insurance density, non-life insurance density, and total insurance density are used. The robustness of the results is verified across 10 subsamples of the main observation period. The conducted analyses show a heterogeneous impact of demographic burden on the insurance market. The impulse responses reveal that negative effects prevail in the long term, which may result from the negative impact of an increasing demographic burden on the economy. In the short term, growth in female and male old-age dependency ratios drives up life and non-life insurance density.
Introduction
Insurance as a financial loss risk transfer mechanism serves a number of valuable economic functions bringing many benefits to policyholders and society as a whole. With their long-term cash flows, insurance companies make long-term investments thus boosting growth of financial markets. As a result, economic growth is fueled by insurance market progress. A number of studies prove the relationship between insurance demand and economic growth (Arena, 2008; Azman-Saini & Smith, 2011; P.-F. Chen et al., 2011; Haiss & Sümegi, 2008; Han et al., 2010; H. Lee et al., 2018; Nguyen et al., 2010; Pradhan et al., 2017).
Over the past years, insurance industry has remained resilient, maintaining overall profitability despite a slowing world economy. However, escalation of trade tensions, fears over recession and a Japan-like scenario of permanently low inflation and interest rates affect both global economic and insurance performances. Among other key challenges the insurance market faces, there are more sophisticated global risks that include climate change, natural catastrophes, cyberattacks, geopolitical shifts, changing customer behavior, and demography. Customers benefit from higher competition and wish to purchase products and services that reach beyond core insurance.
The demographic trends over the past decades illustrate that the engines of global economic growth are aging rapidly, and many countries experience dwindling shares of working-age population. According to the data obtained from the United Nations (2019), by 2050, one in six people in the world will be above age 65 (16%), up from one in 11 in 2019 (9%), while the number of those aged 80 years or above is forecast to triple, from 143 million in 2019 to 426 million in 2050. Globally, the working-age population will decrease by 10% by 2060 (Organisation for Economic Co-Operation and Development [OECD], 2019). Owing to changes in lifespan and a later age for childbearing, middle-aged adults have to take care of their young children and elderly parents at the same time (Wassel & Cutler, 2016); therefore, a higher ratio of young and old dependents is assumed to challenge existing models of social support, strain pension systems, and affect insurance markets. The aggravated demographic burden enhances the significance both of life insurance products, which offer protection against future financial hardships, and non-life insurance programs helping people to respond to damage and loss of their home, belongings, and livelihood in the face of adverse events. In the long run, the growing number of dependents coupled with less favorable economic conditions might depress opportunities for people to afford savings products, home, or travel insurance. Careful exploration of the links between demographic shifts and demand for insurance could give insurers an opportunity to develop and adjust their value-added solutions to the customers’ special requirements.
In this context, the aim of this study is to investigate the influence of demographic burden on insurance performance and reveal the impact of different demographic groups on the insurance market. The study differs from others in a sample of countries, time period, and set of variables.
The choice of countries is largely motivated by data availability. However, the compiled sample allows for a promising analysis from the comparative perspective, as it includes major American, European, and Asian economies for the period 1980–2016.
The age structure of the population is an important measure of demographic change (Bloom & Canning, 2004; Prskawetz et al., 2007). Theoretical considerations confirm that dependents play a vital role in the analysis of insurance consumption (Beck & Webb, 2003; Beenstock et al., 1986; Browne & Kim, 1993; Burnett & Palmer, 1984; Campbell, 1980; C. P. Chang & Berdiev, 2013; Dragos et al., 2019; Feyen et al., 2013; Hammond et al., 1967; Hussels et al., 2005; Kjosevski, 2012; Lewis, 1989; D. Li et al., 2007; G. Li et al., 2020; Outreville, 1996; Truett & Truett, 1990; Ward & Zurbruegg, 2002; Zietz, 2003). In this respect, I use age dependency ratios (ADRs) as the proxies of the demographic transition.
While most studies stated above discuss the interaction between demographic factors and life insurance demand, this article adds to those few (C. P. Chang & Berdiev, 2013; G. Li et al., 2020) that attempt at looking into the impact thereof both on life and non-life insurance markets. This study complements earlier literature by dividing the population over the age of 64 into male and female groups and investigating the impact on insurance development of each of them. The division is justified for two major reasons. First, women generally demonstrate greater risk aversion than men (Cohen & Einav, 2007; Halek & Eisenhauer, 2001), which may influence their insurance purchase decisions. Second, differences in insurance purchase preferences of men and women are driven by the gender difference in the labor force participation rate (Gandolfi & Miners, 1996).
As for the indicators exemplifying the status of insurance market, this article precisely confines its analysis to insurance market density activities as it allows comparing insurance consumption across countries without adjusting for income (Beck & Webb, 2003).
The findings suggest that an increase in the demographic burden has an opposite impact on the insurance density in the long- and short-term perspective. It is found that dependency ratios measured in respect to the population of males and females aged 65 and above have almost similar effect on the insurance market. The obtained results are consistent with those for 25-year subsamples, which are built for the purpose of robustness verification.
The article is organized as follows. The following section reviews the literature. The “Data” section presents data incorporated in the analysis. In the subsequent section, I detail the econometric model employed in the estimation. The results and extended specifications of the empirical research are given in the “Results and Discussion” section. The final section summarizes the major findings and gives suggestions for the future work.
Literature Review
The insurance market is shaped by a number of factors including certain domestic indicators such as gross domestic product (GDP) and inflation. The variables underlying the development of the economy as well as insurance markets may be aggregated by indices measuring governance (Kaufmann et al., 2011). As demonstrated by Dragos et al. (2019), governance effectiveness is one of the most significant drivers of the life insurance consumption.
The relationship between globalization and economic growth has been widely discussed in the literature (C.-H. Chang & Lee, 2010; Dreher, 2006; Dreher et al., 2008). The KOFGI globalization index introduced by Dreher (2006) measures the economic, social, and political aspects of country’s involvement in the global economic system. It was shown (Chien-Chiang Lee & Chang, 2012) that globalization has a significant impact on the development of international life insurance markets and on reducing the differences between the levels of life insurance penetration in several countries. An empirical study (S.-S. Chen et al., 2013) in a sample of eight Eastern Asian countries over the period of 1979–2008 proves that causality exists between globalization and insurance activity and shows the influence of total insurance activity, life insurance activity, and non-life insurance activity on globalization in South Korea.
Din et al. (2017) investigated the relationship between insurance and economic growth in 20 countries for the period 2006–2015 using three measures of insurance activity: net written premiums, penetration, and density. The results revealed that life insurance, when measured through net written premiums and density, has a significant impact on economic growth for developed countries, with the same trend for developing countries when insurance is measured through penetration. Non-life insurance is more vital in promoting economic growth for developing countries for all three measures while it plays a significant role for developed countries only when measured through density.
C.-H. Chang and Lee (2012) investigated the sample of 92 countries over the period 1996–2008 and pointed out that the relationship between economic development and life insurance development is non-linear and the effect is higher for high-income countries. On the basis of the sample of 90 countries in life and 88 countries in non-life insurance, Enz (2000) provided analysis of deviations from the S-curve and found that income elasticity of demand for insurance declines as GDP grows.
Factors affecting the insurance market have become subjects of many research papers. A positive relationship between income and insurance market services is illustrated in the studies by D. Li et al. (2007), Chien-Chiang Lee and Chiu (2012), and Nguyen et al. (2010). The paper by Shan et al. (2016) based on a sample of three ASEAN countries for the period 2009–2013 determines the industry internal factors which insurance growth opportunity depends on, namely, net premium earned, total assets, and total liabilities.
The recent demographic changes call for economic transformations, revision of social relations, and developing new market strategies. The results of the conducted research may vary. An and Jeon (2006) show the inverted U-shape relationship between economic growth and demographic changes in OECD countries. They demonstrate that an increase in the share of young people (aged 0–14) may have both the negative and positive effects on economic growth as on one hand, it means a smaller burden in family consumption for the working-age group, while on the other hand, reduction in the share of the young leads to a lower number of working people, which affects the growth rate. The authors conclude that as the old-age dependency ratio rises over a certain level proving that the population is aging, economic growth rate decreases.
The dependency ratio is one of the most influential determinants in insurance demand. The impact of the ratio was investigated in a number of studies. Hammond et al. (1967), Campbell (1980), Burnett and Palmer (1984), Lewis (1989), and Truett and Truett (1990) outlined that one of the main purposes of life insurance was to protect dependents against financial hardships in case of a premature death of a wage-earner. These findings are consistent with empirical evidence of Beenstock et al. (1986) which confirms a significant relationship between the number of dependents and life insurance demand.
Using both the dependency ratio—defined as the ratio of the total number of children younger than 15 to the total number of persons aged 15 to 64—and the total dependency ratio—defined as the ratio of the total number of children younger than 15 and adults aged 65 and above to the total number of persons aged 15 to 64—Browne and Kim (1993) found that the dependency ratio variable is statistically significant and positively correlated with life insurance premiums per capita and life insurance in force per capita.
Ward and Zurbruegg (2002) compare life insurance consumption in 37 Asian and OECD countries for the period 1987–1998 and find that the effects of young-age dependency ratios on insurance consumption are different between the two groups. In the sample of Asian countries, a negative relationship between young-age dependency ratio and life insurance density is revealed, which may be attributed to the upward trend population growth in most parts of Asia unlike more developed economies. As a result, a growing young adult population is less likely to purchase life insurance products.
In their paper, Beck and Webb (2002) identify factors and assess their impact on the volume of life insurance consumption. Among the determinants of life insurance consumption, demographic variables play a significant role. In a panel of 23 countries over the period 1960–1996, it is revealed that countries with a higher old-age dependency ratio tend to consume larger amounts of life insurance, while those with higher young-age dependency ratio have lower levels of life insurance penetration and density. In their later study, in a panel of 68 economies for 1961–2000, Beck and Webb (2003) find that the young-age dependency ratio has no strong association with life insurance consumption.
D. Li et al. (2007) examine the determinants of life insurance consumption in 30 OECD countries from 1993 through 2000. They identify eight socioeconomic characteristics and product market conditions that could affect the demand for life insurance. Most factors are connected with economic and financial growth, education, social security, and demographic issues represented by life expectancy and number of dependents. In particular, they show that demand for life insurance represented by life insurance sales per capita is fueled by the increasing number of dependents.
In contrast, pursuant to the analysis on a cross-section of 48 developing countries for the year 1986, Outreville (1996) does not find a significant impact of the ADR on the life insurance premiums per capita. These findings are consistent with the results of two later studies by Kjosevski (2012) and Dragos et al. (2019). The investigation of 14 European countries over the period 1998–2010 by Kjosevski (2012) demonstrates that the young- and old-age dependency ratios do not appear to have robust link to life insurance density. By employing GMM models in a dynamic panel data set of 31 countries for the period 2002–2012, Dragos et al. (2019) show that ADR does not significantly influence life insurance penetration and density.
On the basis of panel data on 90 developed and developing countries over the 2000–2008 period, Feyen et al. (2013) find that age dependency is an important driver of life insurance penetration when the young-age and old-age dependency ratios are considered separately, with the general ADR having insignificant effect on life insurance demand.
On the basis of a sample of 39 countries for the period 1984–2009, C. P. Chang and Berdiev (2013) study the influence of external factors, such as political risks and natural disasters, as well as young-age dependency ratio on the insurance market development. The obtained results in their study confirm that a higher dependency ratio causes a decline in life and non-life insurance penetration and density with having only insignificant impact on total insurance consumption.
Pursuant to the analysis of microdata across China, Cheng and Yu (2018) suggest that a higher young-age dependency ratio in China reduces the demand for investment and health insurance, while a higher old-age dependency ratio boosts purchases of investment insurance products and reduces interest in health-type products. The research results contradict with the study by G. Li et al. (2020) showing that in China, young-age dependency ratio significantly increases households’ demand for commercial insurance with the old-age dependency ratio having the reverse effect.
Data
The analysis is based upon data recorded annually over the period 1980–2016 in a panel of 25 countries. The specific sets of countries are Argentina, Austria, Belgium, Brazil, Canada, Cyprus, Denmark, Finland, France, Germany, Greece, India, Iceland, Ireland, Italy, Japan, Malaysia, Mexico, the Netherlands, South Korea, Spain, Sweden, Switzerland, the United Kingdom, and the United States. The choice of countries is largely motivated by data availability.
The data are obtained from several sources, namely, Swiss Reinsurance Company (Swiss Re, 2019), the World Bank’s (2019) World Development Indicators (WDI), and ETH Zürich KOF Swiss Economic Institute (2019).
To proxy the development of the insurance sector, I employ total, life, and non-life insurance densities. The insurance density data are collected from the Swiss Re’s Sigma database.
To avoid omitted variable bias and obtain efficient estimation results, I incorporate control variables such as GDP per capita and KOF index of globalization as the financial institution proxy. GDP data are extracted from WDI.
The KOF Globalization Index (KOFGI) is derived from the database of the Swiss Economic Institute. The necessity of including this indicator is justified by previous literature (C.-H. Chang & Lee, 2012; S.-S. Chen et al., 2013; Chi-Chuan Lee et al., 2017). In this study, I adopt the initial version of the index as introduced by Dreher (2006) and updated in Dreher et al. (2008), although Gygli et al. (2018) extend it by adding 20 more variables, disentangling trade and financial globalization within the economic dimension of globalization, using time-varying weights as well as proposing separate de facto and de jure globalization sub-indices. Despite the alterations, the KOF economic globalization index, however, remains unchanged on the aggregate level.
ADR describes how much pressure an economy faces supporting its non-productive population, which is defined as those aged zero to 14 and those aged 65 and above. The ratio is the number of dependents in a population divided by the number of working-age people (from 15 to 64; Notestein et al., 1944; Weeks, 2005). The major task of the research is to measure the relationship between ADR and insurance density. The article includes the components of ADR such as population aged zero to 14 (YNG), population aged 65 and above (OLD), female population aged 65 and above (F65), and male population aged 65 and above (M65). These ADR components are defined as the population in the corresponding age group divided by the number of working-age people (from 15 to 64; Pirani, 2014; Sanderson & Sherbov, 2015). The data on ADR are obtained from WDI.
Table 1 lists all the variables covered by the article.
Description of Variables, Unit Roots.

Source. Author’s estimations.
Note. GDP = gross domestic product; TI = Total insurance; LI = Life insurance; NLI = non-life insurance; KOFGI = KOF Globalization Index; ADR = age dependency ratio.
The unit root tests on all the variables, except for ADR and population aged zero to 14, show that the variables are non-stationary. Table 1 displays p values of W-stat test with an intercept (Im et al., 2003). To achieve stationarity of the time series, I introduce the logarithmic differences.
Testing the adjusted values for the presence of unit roots showed time-series is integrated of order one, I(1). Cointegration of the time-series specified in Table 1 is not detected (Pedroni, 1999).
Table A1 in the appendix provides descriptive statistics of the variables indicated in Table 1. Jarque–Bera Test (Jarque & Bera, 1987) confirms that the variables M65 and DLADR match a normal distribution.
Method
According to the life cycle model of consumption and saving developed by Modigliani and Brumberg (1954), the level of savings is related to the rate of economic growth and population structure. Insurance is a tool for generating savings and is thus associated with the demographic structure of the population. Endogenous variables of Table 1 are interconnected. Their interconnection follows, in particular, from the results of causality test (Granger, 1969). Their inclusion in one equation leads to biased parameter estimates. Therefore, I built panel vector autoregression models (PVAR models) that link endogenous variables with their own lags and lags of other endogenous variables.
The built PVAR models are divided into two groups. The first group includes total insurance density represented by the endogenous variable DLTI. The second group of PVAR models includes the density of life insurance and non-life insurance represented by the endogenous variables DLLI and DLNLI.
Each group of PVAR models is divided into three subgroups, which differ in the representation of the demographic burden. In the first subgroup, the total ADR is considered and measured by the DLADR variable. In the second subgroup, the demographic burden is represented by the population aged zero to 14 (Young) and is measured by the DLYNG variable. This subgroup considers those aged 65 and older (Old), the impact of which is measured by the DLOLD variable.
The third subgroup focuses on gender aspects including female population aged 65 and older (DLF65) and male population aged 65 and older (DLM65). In total, there are six subgroups and six PVAR models, respectively.
Hence, the study applies the following equation of PVAR models:

where i represents an individual country in the panel; t refers to the time period; k is a subgroup of PVAR models;
Subgroups of endogenous variables in the model adopt the following values:

Equation 1 relates to the logarithmic differences of the variables. Therefore, the estimates of the elements of matrices B1 and B2 are interpreted as elasticities.
PVAR models (1) are constructed with the lag length of 2. The length of the lags was estimated according to Akaike (1973), Schwarz (1978), and Hannan and Quinn (1979) information criteria. The lags were selected from the maximum number equal to 8. When choosing the number of lags in PVAR models, I considered the limitations of the available sample and the fact that with an increase in the number of lags, the number of estimated parameters approached the number of observations. Table 2 shows information criteria and the optimal number of lags for each of the six PVAR models. Only in the third model of Table 2, the selected length lags equal 2 contradicts all three information criteria. In other cases, the selected length is feasible.
Optimal Lag Length According to AIC, SC, and HQ Information Criteria for PVAR Models.
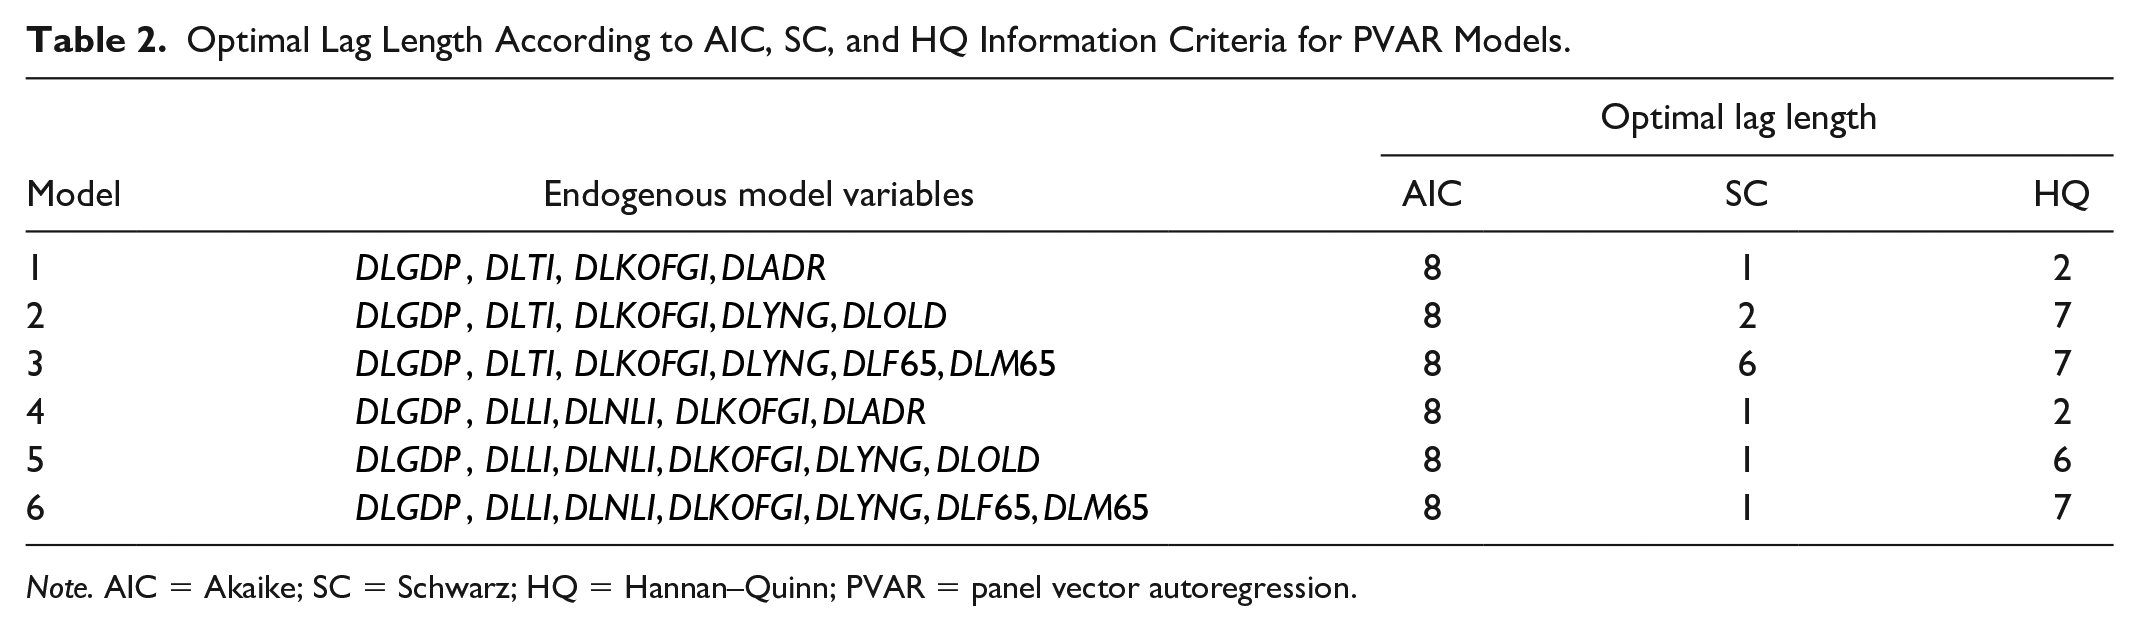
Note. AIC = Akaike; SC = Schwarz; HQ = Hannan–Quinn; PVAR = panel vector autoregression.
The built models were tested for stability. Figure 1 shows the diagrams of the inverse roots of the characteristic polynomial for the PVAR models listed in Table 2. As demonstrated by Figure 1, all inverse roots are inside the unit circle, which proves model stability.

Inverse roots of PVAR characteristic polynomial.
Results and Discussion
The fact of the influence of the demographic burden on the insurance market, as well as the nature of this influence, was assessed by determining the causality significance. Among the whole complex of causality determined in the course of the conducted analyses, the article reflects the cause related to the demographic burden. Among all the consequences of this impact, only responses of the total insurance market as well as life and non-life segments are shown below.
The influence of the demographic burden on the insurance market is also illustrated by a set of impulse responses, with the insurance market (responses) reacting to the shock of the increasing demographic burden (impulses).
Granger Causality
Granger (1969) causality tests were performed for all combinations of endogenous variables presented in Table 2. Tables 3 and 4 show the test results, which are of particular interest in this publication. As the subject of this article is the influence of demographic burden on the insurance market, I specify the results with components of the demographic burden with Lags 1 and 2 being the major reason. The consequence is the reaction of the total insurance market (Table 3) and its components (Table 4). The tests were performed for the entire sample from 1983 to 2016 and for subsamples each of which covers the period of 25 years. Tables 3 and 4 show the p values of the test for the corresponding reactions. All variables are logarithm differences.
The p Values of the Granger Test for Causality of the Demographic Burden for the Insurance Market in Different Periods.

Source. Author’s estimations.
Note. Total insurance market. Demographic burden is represented by age dependency ratio; population aged 0 to 14 and that aged 65 and above; population aged 0 to 14, males and females aged 65 and above. All variables are logarithm differences. Periods include the entire sample and consecutive subsamples of 25 years. Lags of demographic burden are 1 and 2 years.
The p Values of the Granger Test for Causality of the Demographic Burden for the Insurance Market in Different Periods.

Source. Author’s estimations.
Note. Life and non-life insurance market. Demographic burden is represented by age dependency ratio; population aged 0 to 14 and that aged 65 and above; population aged 0 to 14, males and females aged 65 and above. All variables are logarithm differences. Periods include the entire sample and consecutive subsamples of 25 years. Lags of demographic burden are 1 and 2 years.
For the entire observation period 1983–2016, the lags of the components of the demographic burden have a significant impact on the total insurance market. For both life and non-life insurance markets, the influence of the demographic burden of the population aged 0 to 14 in Models 5 and 6 with a standard significance level of 5% is not significant. The impact of the demographic burden of females aged 65 and older on the non-life insurance market is also not significant.
In all subsamples of Model 1, the endogeneity of the demographic burden is set unambiguously with a significance level of 1%. In the subsamples of Model 4, the impact of demographic burden with a level of 10% in 1987–2011 and 1989–2013 was not significant only on the life insurance market.
With demographic burden components being added, the number of PVAR model variables increases, and the significance of the estimates decreases. Nevertheless, for all the variables of the demographic burden, there are periods where the influence is significant. These periods include 1986–2010.
Impulse Responses
All responses and shocks given below are measured in logarithm differences. For the sake of brevity, the term difference of logarithms before the variable name is omitted. Figure A1 (see the appendix) shows the impulse responses of insurance density to all combinations of demographic burden components. All responses show a positive shift in the first periods and are significantly negative, starting from the third period after exposure. In the initial period, the responses are not significant for any shock. Significant response values are in the negative area. This indicates that an increase in any of the components of the demographic burden leads to a reduction in insurance density with a lag of 3 to 4 years.
Figure A2 (see the appendix) shows the impulse responses of life insurance and non-life insurance density. As in the previous case, the responses become significantly negative starting from the third and fourth periods and have a positive upward shift in the initial periods. For impulse of old-age dependency ratio in Figure A2 (c) and impulse of male dependency ratio in Figure A2 (f), this positive response is significant.
The responses demonstrated in Figures A3 to A5 (see the appendix) differ from those of Figure A2 in that they are designed for 25-year subsamples. Subsample periods are shown in the upper parts of the figures. First comes the response of life insurance, then the response of non-life insurance. Subsamples are built to verify the robustness of the obtained results. At the same time, subsamples made it possible to assess the evolution of the nature of the interaction of the insurance market and the demographic burden over time. In PVAR models of subsamples, the number of observations is 605. This is less than for the entire sample, where the number of observations is 830 for the same range of endogenous variables. Therefore, the observed significance of the results is worse than for the entire sample.
Figure A3 (see the appendix) shows the responses of the density of life insurance and non-life insurance to the shocks of the population aged 0 to 14. The responses themselves are in the negative territory, but they are not significant in all periods, with insignificance being in line with Outreville (1996) and Kjosevski (2012). Significance, if any, becomes to be observed starting from third or fourth periods.
Figure A4 (see the appendix) illustrates the responses of the density of life insurance and non-life insurance to the shocks of demographic burden of females aged 65 and above. In the subsamples of the early periods, which begin in 1983 and 1984, the impulses were positively significant in the first and second periods. This indicates that an increase in the demographic burden of females older than the age of 64 has a stimulating effect on the insurance market, and it prevails over the negative impact on the economy as a whole. Then the response goes into the negative territory and becomes negatively significant starting from the fifth to sixth periods of exposure. In the long term, an increase in the economic burden on the economically active population is significant. This may have downward pressure on economic growth (Bloom, 2020) and, as a consequence, to a decline on the insurance market. There is no noticeable difference between life insurance and non-life insurance responses during these periods.
In the subsamples of the further periods, the response pattern changes and comes together in the later periods, which begin in 1988. The response in the subsamples of the first periods is significantly negative. The negative effects of increasing the demographic burden on the economy as a whole begin to prevail over the stimulating effect of the growth of the demographic burden on the insurance market.
In the last subsamples of periods in Figure A4, which begin in 1991 and 1992, the differences between life insurance and non-life insurance responses are noticeable. On the life insurance market, the negative effect of increasing the demographic burden of females fades rather quickly and becomes insignificant starting from the fourth or fifth period. On the non-life insurance market, the negative effect is protracted and significant for all 10 observation periods. Higher interest in life insurance products for aging societies might be explained by investment components thereof and their relative higher returns compared with the yields on safer government bonds which started hitting lows (Campbell Roberts & Mehlman, 2018).
Figure A5 (see the appendix) shows the responses of life insurance and non-life insurance density to the impulse of demographic burden of males aged 65 and above. In subsamples of the early periods beginning in 1983 and 1984, the positive impact on insurance markets prevails, which is similar to that shown in Figure 4 for the females aged 65 and above. Over time, it fades and the negative impact on the economy becomes dominant, and through the economy, it affects insurance markets. With the start dates of subsamples approaching the present day, the positive effect of the impulse of the demographic burden of males disappears and is completely offset by the negative impact on the economy.
In general, there are just slight differences between graphs of Figure A4 for females and those of Figure A5 for males. The only noticeable gender difference was revealed for non-life insurance responses in subsamples from 1991 and 1992. For the demographic burden of males, this response is not significant in the first periods, although for the demographic burden of females, it is significant. This may indicate that dependency ratios measured in respect to the population of males aged 65 and above have a stronger positive effect on the non-life insurance market than those of females. Therefore, in the first periods, it compensates for the negative effect on the economy as a whole.
The subsamples revealed the bidirectional impact of the demographic burden on the insurance market at certain time periods. For the entire sample, this effect was disguised by the heterogeneity of the interaction over time.
On balance, the results provide mixed findings on the relationship between demographic burden and insurance density. A positive impact of increasing demographic burden in the short term suggests that consumers realize that national systems of social insurance become more squeezed (Weeks, 2005), which makes government support insufficient to cover their own losses or losses of their families in case of property damage, bodily injuries, temporary or permanent disability, or premature death; thus, sales of life and non-life insurance products increase. As for the life insurance market, high young-age dependency ratio drives the demand for insurance against mortality risk, while high old-age dependency ratio boosts demand for savings and annuity products (Feyen et al., 2013). The results of positive correlation of increased demographic burden and insurance demand are consistent with those of Hammond et al. (1967), Campbell (1980), Burnett and Palmer (1984), Beenstock et al. (1986), Lewis (1989), Truett and Truett (1990), Browne and Kim (1993), and D. Li et al. (2007). Nevertheless, in the long term, the negative effect of demographic burden on the insurance market prevails. As the changes in the age composition of the population become more vivid, a significant drop in labor supply, due to lowering birth rates and increasing life expectancy reduces aggregate output as well as domestic savings (Santacreu, 2016); therefore, consumers have limited opportunities and spend on insurance less. The results of negative correlation of higher demographic burden and insurance demand are in line with those obtained by Ward and Zurbruegg (2002) and C. P. Chang and Berdiev (2013).
The findings also reveal that in the long term, the differences in the impact of the demographic burden measured in respect to males and females aged 65 and above fade, which could be attributed to the narrowing gender gap in economic dependency. Traditionally, women have participated in the labor force less continuously than men, which results into decreased productivity and lower wages (Becker, 1985; Blau & Kahn, 1997, 2007, 2013, 2017; Mincer & Polachek, 1974). However, the gender pay disparities have become less striking over time (Istenič et al., 2018), which can be partially explained by less frequent employment discrimination in the workplace (Mandel & Semyonov, 2014) as well as more similar fields of studies and occupations chosen by men and women (England, 2010). Realizing that gender equality boosts economic potential and thus insurance demand (Luciano & Rossi, 2014), insurers could assist in minimizing gender differences by further adjusting their gender-responsive schemes and elaborating on tailored inclusive solutions.
Control Variables
Control variables include GDP and KOFGI. Tables A2 and A3 (see the appendix) show that there is a significant reciprocal causal relationship between insurance markets and GDP. The significance level of mutual influence is less than 5% in all cases except for Model 6, where the significance is less than 10%. The impact of GDP on insurance markets is illustrated by the impulse responses shown in Figure A6 (see the appendix). GDP causes a positive response on total, life, and non-life insurance markets.
Earlier in the article, I indicated the publications which studied the relationship between the demographic burden and GDP. Tables A2 and A4 (see the appendix) show a significant mutual influence of GDP and the components of the demographic burden. The nature of the influence is determined by the estimates of the parameters of the PVAR models and the corresponding impulse responses. Figure A7 (see the appendix) illustrates that an increase in the components of the demographic burden causes a short-term growth of GDP; however, after two to three periods, the trend becomes downward. An increase in the demographic burden in the short term results in the growth of insurance markets, with the latter boosting GDP. In the long term, the negative impact of an increase in the demographic burden on GDP prevails over the short-term positive effect of the growth of the insurance market components. The results show that higher proportions of dependents may depress economic growth (Reher, 2011; Van der Gaag & de Beer, 2015).
In the “Literature Review” and “Data” sections, I considered the relevant sources of literature which explain the need for including KOFGI in the list of control variables. Tables A2 and A3 represent the reciprocal causal relationship between KOFGI and the components of the demographic burden, which is an additional reason for including KOFGI in the list of control variables.
Conclusion
The purpose of this article is to determine the nature of the impact of the demographic burden on the insurance market. To solve this problem, PVAR models with panel data for 25 countries were built. The calculations were made for the time period 1980–2016.
The nature of the interaction of insurance density and demographic burden is assessed by means of impulse responses and causality.
The demographic burden is represented by ADR and its components: population under the age of 15, females and males of 65 years and older. The insurance market is represented by the total insurance density as well as life and non-life insurance density.
In total, there are six groups of endogenous variables. To verify the obtained results, the entire time period was divided into 25-year subsamples, for each of which PVAR models were built. The relationship between demography and the insurance market proved to be ambiguous. The diversity of this relationship is reflected in the present article.
First, by means of impulse response function, it is shown that an increase in the demographic burden leads to an increase in the insurance density in the initial period. The same result is obtained on subsamples for the total insurance density, its life and non-life components, and demographic burden of both males and females aged 65 and above. The sign of impulse responses is positive at the beginning of the impact. In the initial periods, the response of insurance density to the impulse of the demographic burden depends on the composition of endogenous variables in the model and on the observation period.
Next, it is found that after a few years, the impulse responses change signs and become negative. It is assumed that in the long run, an increase in the demographic burden has a negative impact on the growth of the economy as a whole (Aksoy et al., 2019; Bloom et al., 2010; Maestas et al., 2016) and, as a result, leads to a decrease in the insurance density.
Overall, the findings of the article provide evidence that dependents are fundamental determinants of insurance density across countries, with dependency ratios measured in respect to the population of males and females aged 65 and above showing almost similar trends, which may be explained by the decreasing gender differences in labor force participation (Istenič et al., 2018).
The growing demographic burden may strain government support for the dependents leading to prolonged employment and reduction in the living standards. Amid the accelerating pace of population aging in most countries considered by the research, the results call for policy makers and insurance companies to revisit their policy agendas and investigate more closely structural changes in demographic factors to promote the growth of insurance markets. This could enable insurers to develop high-touch, personalized service, which could both add value to the customer’s life and make the economy more resilient.
This study is restricted to the impact on the insurance market density only, and future research can include insurance market penetration and other relevant variables. Likewise, this article can be extended by the inclusion of such demographic indicators as life expectancy at birth, total fertility rate, and urban population. In the future research, in case of data availability, it would be useful to consider a bigger sample in terms of countries and periods, which would lead to a greater understanding of demographic determinants of insurance demand.
Footnotes
Appendix
The p Values of the Granger Test for Causality of the Demographic Burden for Control Variables.

| Consequences | Cause | |||||
|---|---|---|---|---|---|---|
| Model 1 | Model 5 | Model 6 | ||||
| DLADR | DLYNG | DLOLD | DLYNG | DLF65 | DLM65 | |
| DLGDP | .0000 | .0780 | .0340 | .1098 | .4563 | .0699 |
| DLKOFGI | .4464 | .4191 | .0065 | .5120 | .1144 | .7223 |
Source. Author’s estimations.
Note. Demographic burden is represented by age dependency ratio in Model 1; population aged 0 to 14 and that aged 65 and above in Model 5; population aged 0 to 14, males and females aged 65 and above in Model 6. All variables are logarithm differences. Lags are 1 and 2 years. Period: 1983–2016.
Acknowledgements
The author is grateful to the Managing Editor Bailey Baumann, three anonymous reviewers, and Mikhail Stolbov for their constructive comments and suggestions that led to a significant improvement of an early manuscript. The author would also like to thank the Peer Review Associate Ankit Kapoor and the Associate Publishing Editor Sara Parker for their encouraging administration of the manuscript progress.
Declaration of Conflicting Interests
The author(s) declared no potential conflicts of interest with respect to the research, authorship, and/or publication of this article.
Funding
The author(s) received no financial support for the research, authorship, and/or publication of this article.