
Abstract
The study purports to search the corporate sustainability practices of the companies in Pakistan. This study is novel research in the context as it tries to capture corporate sustainability practices in a market where these practices involve a high divergence among the companies amidst a voluntary disclosure requirement. Total sustainability efforts by the companies in Pakistan have been assembled over an index based on Global Reporting Initiative (GRI) reporting guidelines and some context-specific indicators. Corporate sustainability has been calculated by applying the quality of disclosure (CSQI) along with the level of disclosure (CSLI). The average CSLI disclosure is 47% and CSQI disclosure is 27%. The quality of disclosure is lower as the companies do not disclose too much data in quantitative or statistical form. The disclosure is also described as inconsistent among the companies. The study finds a relationship between corporate sustainability scores and corporate financial performance by applying a step-by-step approach likely to lead to a generalized method of moments (GMM) estimation for controlling the endogenous nature of such a relationship. Regression results have confirmed that there exists a positive relationship between corporate sustainability and accounting and market-based financial performance. The stakeholder theory seems to have roots in the context. The study has some policy implications and will guide the regulation of sustainability at the corporate level in Pakistan.
Introduction
The usage of current resources should not be at the cost of options available in the future (Crowther, 2000) and this is asserted by the notion of sustainability. The resources in jeopardy call for appropriate attention and planning for their preservation (Aras & Crowther, 2008). United Nations General Assembly (UNGA) formed a special commission in December 1983 to assess global problems, environmental issues, and future strategies. The commission headed by Gro Harlem Brundtland (Former Norwegian Prime Minister) derived the name, World Commission on Environment and Development (WCED) (1987). The outcome of this commission was the Brundtland Commission (1987) Report, which provided the most widely accepted definition of the term sustainable development. The report stated that “sustainable development means to meet the needs of present generations without compromising over the ability of future generations to meet their own needs.” The conclusion was that the era of economic growth should be socially and environmentally sustainable. Brundtland Commission (1987) had a remarkable contribution in attracting attention to sustainability (Cohen & Winn, 2007), and the same caused the first-ever United Nation’s Earth Summit of world leaders in 1992 (Ameer & Othman, 2012).
The epistemology of sustainability economics shifted the traditional view of economics to a blended view containing both the economy and environment (Vildåsen et al., 2017). Sustainable development is gaining greater importance in the corporate context, as the sustainability indicators in economic, social, environmental, and governance domains have been frequently adopted (Kaspereit & Lopatta, 2016; S. F. Lo & Sheu, 2007; Lourenço et al., 2012). Corporate sustainability, a fashionable concept of the moment (Aras & Crowther, 2008) is the companies’ efforts to both recover and develop resources that are available to be consumed at present and have them for future needs (Ehnert, 2009). The United Nations Global Compact (UNGC) principles issued in 2010, are accepted by more than 7,700 companies worldwide and this shows evolving interest by the corporate sector in the concept (Lozano, 2020). Corporate sustainability (hereinafter CS) is allowing companies to attract corporate reputation, enhance shareholder value, provide quality products and services, pursue ethical business practices, create sustainable jobs, build value for all corporation’s stakeholders, and feel attentive to the social and environmental concerns (Arnedo et al., 2021; Kwon et al., 2023; Oncioiu et al., 2020; Teixeira & Canciglieri Junior, 2019).
The CS reporting and the related research are being increased whilst emphasizing Elkington’s (1997), triple bottom line approach (Baral & Pokharel, 2017; Cheng et al., 2014; Perrault & Clark, 2016). Environment as well as economic and social considerations are an integral part of CS practices (Aras et al., 2018; Yu & Zhao, 2015). The underlying intention behind CS activities is to embed the social and environmental concerns in the companies’ philosophy (S. F. Lo, 2010). Developing economies are facing more problems relating to environmental and social considerations. The research is still needed and justified on the concept as there is an increasing trend in sustainability-related activities by firms and the area still needs researchers’ attention in developing economies (Carroll & Brown, 2018). The CS research is limited in Asian economies (Ketprapakorn, 2019). The sustainability studies in developing economies count for only 21% of all the published articles (Amui et al., 2017). The CS research in developing economies should focus on socio-economic realities of the contexts (H. Wang et al., 2016).
Reputation indices capture the sustainability activities of the firms (Galant & Cadez, 2017). These reputation indices quantify the CS efforts of the firms. The majority of these indices evaluate the firms in the developed economies and do not apply to emerging economies (Yoon et al., 2018), however, the applied dimensions and indicators can provide useful understanding to the researchers where there is no coverage of these rating agencies (Turker, 2009). Measurement of the concept for academic purposes is a matter of concern for the researchers (Pérez & Rodríguez del Bosque, 2012). The Global Reporting Initiative (GRI) (2011) guidelines though voluntary, have been the most prominent set of non-regulatory reporting by businesses after their inception (Brown et al., 2009; Marimon et al., 2012). They are providing a common language of reporting and have multiple strengths such as stakeholders’ involvement, applicability, widespread acceptance, and the design (Blasco & King, 2017). The GRI performance indicators embed multiple stakeholders like environment, employees, community, customers and also the issues like human rights and transparency. The GRI performance indicators have been used in capturing the CS performance of corporations in different contexts (Laskar & Gopal Maji, 2018; Raucci & Tarquinio, 2020; Thuy et al., 2021; Yang et al., 2021).
Corporate image requires a sustainability dimension to go hand in hand with other efforts (Pérez & Rodríguez del Bosque, 2012). The socially responsible investment (SRI) has got famous due to investors’ preferences for social and environmental concerns (Chatterji et al., 2009; Koenigsmarck & Geissdoerfer, 2021). Sustainable bonds had record sales in 2019, gaining a 78% increase from 2018 (Bloomberg, 2020). Firms’ involvement in sustainability-related activities does not go in vain. The financial benefits of investing in sustainability do not exceed the cost (MacAskill et al., 2021), firms enjoy good stakeholder relations (Belyaeva et al., 2020), an increased employee operating performance (Sun & Yu, 2015), lower cost of capital (Yeh et al., 2020), long-term viability and growth (López et al., 2007), and increased sales as sustainable products are now the demands of customers (Vătămănescu et al., 2021). The responsible behavior of businesses toward the stakeholders earns their favor and results in improved financial outcomes (Lopez, 2020; Waheed & Zhang, 2022). Past research has shown a positive relationship between CS and financial performance in Pakistan (Alam & Rashid, 2022). The current study offers a more robust analysis for an extended period between 2011 and 2020 and also controls for the endogenous nature of the CS-corporate financial performance (hereinafter CFP) relationship.
This study aims to capture the sustainability disclosure of Pakistani companies and then find the CS-CFP relationship. We have used GRI-G 3.1 version along with other context-specific indicators for the content analysis of the company documents. Corporate ethics play a vital role in driving the firms’ behavior and ethical concerns of the companies have also been captured for the corporate sustainability index. This study is unique in the context as it captures the comprehensive CS performance of all the non-financial firms in Pakistan that disclose such information. Reporting of companies in Pakistan is mainly oriented toward philanthropy and CSR and they do not embed sustainability indicators in their non-financial disclosure. A survey by United Nations Development Program (UNDP) (2019) reported that only 17 pc of firms follow the GRI framework out of 71 CS/CSR-active firms that responded. The lower sustainability reporting in Pakistan is attributed to unstable and weak government structure, unique socio economic and political setup, dependency on foreign aids, lack of education and awareness and weak regulation (Hongming et al., 2020). The research related to CS in Pakistan is deficient in the measurement of the construct and does not consider the theoretical foundations (Alam & Rashid, 2022). The current study adds a new perspective in Pakistan by exploring quality of CS disclosure (monetary/quantitative/statistical/specific) in addition to the level of CS disclosure and builds a comprehensive CS construct.
Finding the quality of CS disclosure in the emerging has not received proper attention from the scholars (Ching et al., 2017). The quality of companies’ non-financial contributions on the indicators like environment, labor practices, community, human rights, customers and ethical practices may provide a healthy output to the companies and others concerned. This study is using the notion of corporate sustainability (CS) as it is an important consideration in modern business practices. The study also contributes to the body of literature concerning measurement of construct, particularly for Pakistan and generally for emerging economies wherever the adoption of GRI is low. The study finds that CS disclosure is not adequate in Pakistan and its quality is much lower however, it positively influences the financial performance. Findings of this study are useful to the regulatory authorities and may trigger policy discussions for enhancing CS disclosure. After the introduction, the remaining content is organized in the following sections as: Section 2 provides the theoretical underpinnings and development of hypothesis, Section 3 enlists data and methods, Section 4 discusses the debate over the results and finally, Section 5 concludes the study with certain recommendations for policy implications.
The Theoretical Background and Development of the Hypothesis
The Theoretical Background
Stakeholder theory notated as total value created is the function of total value created for an organization’s customer, employee, supplier, community, and financier (Freeman et al., 2020). Theories of the firm have limited application to CS, and when addressing sustainability, these theories have a limited scope while explaining one or more dimensions of sustainability but not all (Lozano et al., 2015). In Lozano et al. (2015) words, four sustainability dimensions are there, for example economic, social, environmental, and time.
There has been a natural fitting between the idea of CS and the stakeholders of an organization (Carroll, 1991). The stakeholder theory questioning shareholders’ wealth maximization has been inviting detractors but still has proved its prominence (Laplume et al., 2008). The main principle of stakeholder theory is to manage and balance the relationship with various social and non-social stakeholders and with the addition of the environment, it now encompasses all of the dimensions of CS like economic, environmental, and social (Lozano et al., 2015). It can be stated that stakeholder theory explains all the dimensions of CS (triple bottom line) except for the time dimension which is the balance between current and future. Considering the said critique on stakeholder theory, Turker (2009) argues that the natural environment closely relates to future generations and hence the company’s policies of not harming and preserving the natural environment are related to the theory’s future orientation as is nuanced by the concept of CS. The triple bottom line (TBL) construct is an example of blended value creation for the stakeholders (Windsor, 2017) and this is the construct under discussion in the current study.
Donaldson and Preston (1995) identified three forms of the theory namely descriptive, normative, and instrumental. The discussion about the perspectives of stakeholder theory among scholars has at least delineated the normative perspective as an important part of organizations’ strategy (Freeman et al., 2020). The normative perspective provides an insight into the idea of the stakeholders being in the philosophy of organizations. Understanding the operations of corporations and their management from moral and philosophical guidelines provides the normative perspective (Donaldson & Preston, 1995). The philosophy-based moral obligations are outlined by the normative stakeholder theory (Brickson, 2007). The normative stakeholder perspective discusses the moral responsibilities of corporations. The ethics that is embedded in the philosophy of corporations guide the relationship between them and society (Garriga & Melé, 2004). The normative perspective thus is the central point of stakeholder theory that drives organizations’ intent toward the stakeholders.
On the more practical side, the descriptive perspective hints if the organizations have a stakeholder-oriented approach to involving the stakeholders. The descriptive perspective emphasizes the description of the corporation whose parts are intermingled with different competitive and cooperative interests (Donaldson & Preston, 1995). This provides insights into the overall description of the organization that organizations are socially constructed and the managers’ vision/objectives are centered on the stakeholders (Brickson, 2007). In descriptive form, stakeholder theory describes whether the organizations have stakeholders and on the empirical side it provides the prediction of the organizations’ orientation toward their stakeholders (Donaldson & Preston, 1995). In descriptive form, the stakeholder theory is a tool that provides a basis for mapping the stakeholders (Cottafava & Corazza, 2021).
The instrumental perspective proves the financial benefits of doing good for stakeholders. The instrumental stakeholder theory assumes that organizations are run for profit, and doing stakeholder management provides improved financial outcomes (Jones et al., 2018). In Donaldson and Preston’s (1995) words, if the theory describes the organizations having stakeholders, it can be conceived to build connections between stakeholder management and corporate objectives like profitability and growth. More precisely, the theory may be used as an instrument for enhancing the CFP. The CS is used as a strategic tool to attain better financial outcomes (F. Y. Lo & Liao, 2021). The value creation for shareholders when equally applied to value creation for stakeholders is the essence of instrumental stakeholder theory (Windsor, 2017). Considering its widespread acceptance and applicability to CS, the current study is based on stakeholder theory. The study identifies reporting indicators concerning different stakeholders, scores these indicators, and finally finds a relationship between firms’ stakeholders’ related disclosure and their financial performance.
Corporate Sustainability and Corporate Financial Performance
The research relating to CS and CFP is manifold. There are studies separately relating different components of CS with CFP. This study relates the composite CS performance of companies to CFP. The link between CS and CFP is still under debate. The financial implication of responsible behavior by the companies has engaged them to directly promote societal and environmental good (Brooks & Oikonomou, 2018). Financial benefits, social obligation, and environmental protection are embedded in a single concept of CS (S. F. Lo, 2010). Involvement in CS, considering the environmental, social, and economic dimensions cause long-term value creation for the companies (Yu & Zhao, 2015). Sustainability activities prevent firms from negative reputes (Peloza, 2006). Companies embedding CS into their actions take advantage of socially responsible investment (SRI) (D’Apice et al., 2021).
Companies’ expenditure on environment-green costs proved to be positively related to the financial performance of the firms (C. Wang et al., 2020). Sustainability-related activities reduce the environmental risks and provide favor to the companies from stakeholders (Campbell, 2007; Guoyou et al., 2013; McWilliams & Siegel, 2001). Chopra and Wu (2016) found that the environmental activities of the firms positively correlated to the operating performance of firms. Firms performing well on environmental footprints get repute and stakeholder acceptance. Enhanced customer loyalty and increased product demand led by environmentally conscious behavior result in improved revenues and market share (Kassinis & Soteriou, 2003; Muflih, 2021).
Companies can attract investors by pursuing strategies for preserving the natural environment (Tang & Zhang, 2020). The CS actions enhance the firms’ abilities to attract and retain talented workers (Ikram et al., 2021). Employee programs improve the firms-employee relations and community activities to please the stakeholders. Firms with social and environmental orientation experience good employee morale (Al-Ghazali & Afsar, 2021). A study by Saleh et al. (2011) found a positive and significant relationship between the dimensions like community involvement, employee relations, and CFP. Siueia et al. (2019) found the social dimension of CS as positively related to the CFP of banks in Sub-Saharan Africa. Marti et al. (2015) found a positive relationship between overall CS performance and CFP of the Stoxx Europe 600 Index. Firms proactive in corporate social performance are valued by the markets and enjoy lower costs of capital (Lee et al., 2009; Yeh et al., 2020).
Ameer and Othman (2012) developed the CS score for the top 100 global firms over the ethical, social, and environmental domains and found that these are positively and significantly related to CFP. Hongming et al. (2020) found a relationship between CS reporting and 50 non-financial firms in Pakistan from 2013 to 2017 and reported a positive and significant relationship. The other studies showing a positive relationship between social performance and CFP are Chen and Wang (2011), Laskar and Gopal Maji (2018), and Zu and Song (2009). Another stream of research suggests that investment in environment-related activities is costly and deteriorates the CFP. A study by Saleh et al. (2011) found the environmental dimension of CS to be negatively related to CFP referring to the environmental efforts of the firms that fail to attract reputation from stakeholders. Other studies showing negative relationships between CS and CFP are Lima Crisóstomo et al. (2011), Makni et al. (2009), and Saygili et al. (2022). An inconclusive relationship between social performance and firms’ financial performance can be attributed to the issues like how it is defined, sample selection, or problems in research designs (McWilliams et al., 2006) or there may be issues relating to the insufficient application of data in the research capturing CS and CFP (Lee, 2008). Researchers have tested the relationship by applying the methodologies that are improved. When the sample selection bias issue is solved there remains a positive relationship between CS and CFP (Shahzad & Sharfman, 2017). Overall, the relationship between these two constructs is positive as concluded by the meta-analyses by Orlitzky et al. (2003) and Velte (2022). Based on the discussion we hypothesize that
Methods
Sample and Data
The research sample of the study consists of 76 non-financial firms listed on Pakistan Stock Exchange for the period between 2011 and 2020. The criteria adopted for sample choice were: must be a non-financial listed firm, disclosed sustainability-related information, and remained listed during the study period. Firms that were delisted or for which the annual reports/CS information were not available were excluded from the sample. Hence, a balanced panel of 760 firm-year observations is analyzed in the study. The study period was chosen for the reason that CSR general order for public companies was issued in 2009 by the Securities and Exchange Commission of Pakistan (SECP). Data on CS activities of the firms has been collected from annual and/or sustainability reports. Content analysis has been performed to construct the CS indexes (Szegedi et al., 2020; L. Zhang et al., 2020; Y. Zhang et al., 2020). Data for financial and control variables have been collected from the State Bank of Pakistan’s (SBP) financial statement analysis (FSA) of publicly listed firms. The data on share prices for collection of market based financial performance has been collected from the Pakistan Stock Exchange (PSX). Firms in the sample have been divided into 10 sectors: automobile assembly and parts, chemical and pharmaceutical, oil, gas, and refinery firms, fertilizers, engineering, cement, information and communication, food and personal care, textile, and miscellaneous.
Empirical Models
The study involves static and dynamic panel data. In the first point, the study uses static panel data estimation for getting the regression results. The equation for static panel data is as follows.
In the second place, the study involves dynamic panel data set to observe the relationship between the dependent and explanatory variables. There is potential problem endogeneity in the relationship between CS-related performance and CFP of the firms. Reverse causation exists between CS activities and CFP. The firms with huge revenues tend to invest more in CS activities and in return they get favor from stakeholders and enjoy improved financial performance (Choi et al., 2010). Earlier studies probing the CS-CFP link probably would have suffered from endogeneity problems because research designs did not capture the endogenous nature of such a relationship (Brooks & Oikonomou, 2018). For controlling endogeneity and having a reliable relationship the study relies on Arellano and Bover’s (1995) and Blundell and Bond’s (1998) system GMM. For estimation of GMM following dynamic panel data equation is applied with lagged dependent variable.

The static panel data models may control for unobserved heterogeneity (fixed/random effects) but they are unable to control for dynamic endogeneity (Schultz et al., 2010). The dynamic relationship of the data can be explained in the way that the current year’s CFP and CS performance are dependent on the past year’s CFP. Besides this, the current year’s CFP may be correlated to observable or unobservable factors (heterogeneity) which determine CS decisions (Cavaco & Crifo, 2014). The costs incurred in the short run bring customer satisfaction and efficiency improvements causing improved CFP in the long run (Elsayed & Paton, 2005). The same can be explained for costs on CS where firms’ current investment in CS may bring fruits in the future. Due to these reasons, the data becomes static to dynamic. Endogeneity may be due to simultaneity (reverse causation), heterogeneity, or the dynamic nature of relationships (Ullah et al., 2018). The GMM controls for endogeneity and provides robust estimates. The GMM is also more robust to heteroscedasticity and autocorrelation.
Measurement of Variables
Measurement of Corporate Financial Performance
The CFP being a dependent variable has been assessed through accounting and market-based measures. Accounting and market-based CFP measures may have differences in their prediction (Orlitzky et al., 2003). Accounting-based profitability mainly depicts internal efficiency while the market’s reaction to the firm’s activities is reflected in market-based profitability. These profitability measures carry certain merits or demerits one over the other is upon the researchers’ choice (van Beurden & Gössling, 2008). In this study, we use return on assets (ROA) as accounting-based profitability and Tobin’s Q as market-based profitability. There is evidence in the extant literature about the use of both accounting and market-based measures of financial performance in the CS-CFP relationship (Barauskaite & Streimikiene, 2021; F. Y. Lo & Liao, 2021).
Measurement of Corporate Sustainability
Corporate sustainability (CS) assessed on both the quality and level of disclosure is the primary explanatory variable in the study. We have applied all the categories of GRI performance indicators. Besides using economic, environmental, and social categories we have found company scores on the ethical index capturing the firms’ inclination relating to ethical concerns. A composite CS index has been formed to assess the sustainability of the Pakistani corporate sector. Some context-specific indicators showing firms’ attention toward the environment and society have also been taken into account while forming the CS index. Instead of relying on GRI, the research should include context-specific indicators along with GRI to capture the sustainability efforts of the firms (Laskar, 2018). The GRI G 3.1 has 84 performance indicators. A total of 40 indicators have been adopted from GRI G 3.1. A total of 16 indicators termed as context specific, relate to environmental and social categories and have been selected after performing a pilot survey of companies’ documents. For the pilot survey, two companies from each sector (Appendix E) have been selected randomly. Our initial CS index contained all the indicators included in G 3.1 performance index however certain indicators were dropped as not being covered by either the GRI or non-GRI firms. This is consistent with the finding by Aktas et al. (2013) in the case of Turkish firms that do not provide disclosure over all the indicators of GRI. Only 15% of companies in the sample report sustainability specifically according to the GRI framework. Among the companies reporting according to the GRI framework, few follow the GRI content index for the entire period of study and adopt the pattern of reporting similar to non-GRI firms. The indicators in G3.1 reported by GRI and non-GRI firms and some context-specific indicators along with ethical practices do form part of our CS index (Appendices A, B, C, and D). The indicators on the ethical index have mainly been adapted from the companies’ codes of conduct. The ethical indicators have been adapted as per their relevance to corporate sector sustainability and there is evidence in the literature (Ameer & Othman, 2012; Farag et al., 2015). In the ethical index, nine indicators represent companies’ codes of conduct, and three are related to general ethics and are adopted during search of companies’ documents. All the firms in the sample have been found to adopt a code of conduct and ethics and this has become a motivation to include ethical reporting as part of our CS index.
CS has been assessed through quality of disclosure-CSQI and level of disclosure-CSLI. The scheme of scoring for CS quality index-CSQI is based on a four-point scale. CSQI has assessed that how the companies are reporting on sustainability indicators. The methodology for scoring the indicators is as follows.
a) If an indicator is reported with specific information, in quantitative form or monetary terms, it has been given a score of 3.
b) If an indicator is not reported with specific information and is described with a tangible contribution, in qualitative form, it has been given a score of 2.
c) If an indicator is reported in generic terms with no tangible contribution and hints about the company’s concerns, it is given a score of 1.
d) If an indicator is not reported at all, it is given a score of 0.
Corporate sustainability level index-CSLI is the programed generation of company scores in a binary form if the firms found reporting on the first three layers in the scoring scheme of quality of disclosure. If an indicator has been found reported on any of the first three layers mentioned above, it will get a score of 1 and 0 otherwise. An overall CS index will be assessed on the following formula.

Where Xijt is the estimated score of firm j, at time t for ith item and Nj is the maximum score that may aggregately be obtained by total no. of indicators. In the case of level of disclosure Xijt will contain 0 or 1 and in the case of quality of disclosure, it can be a number between 0 and 3.
Control Variables
Some control variables being documented determinants of profitability have also been applied based on the extant literature. Firm size has been controlled by taking the natural log of total assets (Aras et al., 2010; W. S. Kim & Oh, 2019). The relationship between CS and CFP may be affected by firm size (Pham et al., 2021). Financial leverage embedding risk affects the firm profitability (Hasan et al., 2018). Similarly, the pattern of shareholding may also affect financial performance (Ahmed et al., 2012). Firms’ age is used as a control variable. Older companies are in a better position to earn higher profits (Thuy et al., 2021). Table 1 below presents the variables and their definitions.
Definition of Variables.

Results and Discussion
CS Disclosure Trend and Quality
Figure 1 shows the disclosure trend among the companies in the sample over the period of study. It has been observed that there has been an increase in both the CS quality and the CS level. The CS disclosure and its quality is considered lower among Pakistani companies. The monetary, quantitative/statistical, and specific data has not been disclosed much by the companies on CS indicators (Appendices A, B, C, and D). The individual CS indicators carry less scores. The indicators have been reported either in qualitative or generic form or inconsistently between the years by the companies. A mean score of less than 1 on the indicators points to generic and inconsistent disclosure. The number of indicators reported by the companies also diverge hinting at inconsistent reporting.

Corporate sustainability discloure.
Descriptive Statistics
Table 2 shows the results of descriptive statistics. We have checked for the normality of the data.
Descriptive Statistics of the Variables.

Source. The authors.
Some of the variables had outliers and were not normally distributed. To avoid loss of data in the case of deletion of outliers, we have winsorized the data at 1st and 99th and 5th and 95th percentiles (Gerwanski, 2020; Maury, 2022). The data of CSQI, CSLI, and ROA and lnAssets have been winsorized at the 1st and 99th percentile, while Tobin’s Q has been winsorized at the 5th and 95th percentiles. The data of leverage, listing age, and ownership concentration was quite normally distributed, hence not treated.
Mean values for CSQI and CSLI are 0.269 and 0.466 respectively. Firms in the sample are reporting on 47% of the information and the quality of this disclosure is 27%. There is a low to moderate level of reporting on CS indicators among the companies. The quality of such information is much lower. The mean value of ROA is 0.081 showing that the average ROA is 8%. The mean value of Tobin’s Q is 1.53 showing that the market value of firms is more than the book value. About 53% of the assets are financed through debt as shown by the mean value of leverage. The size of the firms on average is 23.995. Ownership concentration has a mean value of 0.708 and it shows that firms in the sample have a highly concentrated shareholding. The average listing age of the firms in the sample is 30 years. The results of skewness and kurtosis for all the variables have also been presented and show the normality of the data.
Correlation Analyses
Table 3 shows the results of the Pearson correlation analysis. CSQI is positively and significantly correlated with Tobin’s Q and ROA. There is a positive relationship between corporate sustainability disclosure quality and market and accounting-based CFP. Similarly, CSLI is positively and significantly correlated with ROA and Tobin’s Q. CSQI and CSLI both are positively and significantly correlated with firm age and size while these are significantly and negatively correlated with leverage. There is no issue of multicollinearity in the data as shown by the correlation coefficients among the variables, except between CSQI and CSLI which are not being used in the same model for estimation results. The correlation coefficient of two variables up to .8 does not invite the problem of multicollinearity (Gujarati & Porter, 2008, p. 359).
Pearson Correlation Matrix.

Source. Authors’ own calculation from STATA.
, **, * indicate 1%, 5%, and 10% levels of significance.
Regression Results
Regression analysis is applied to get a reliable relationship between CS and CFP. For all the models designed for the study, a step-by-step process has been applied to decide on the interpretation of the coefficients. The relationship between social and financial performance may involve endogeneity (Bruna & Lahouel, 2022). Our variables of CS indexes may be potentially endogenous. For a variable to be exogenous, it should not be correlated with the error term. An endogenous variable is an explanatory variable that is correlated with the error term. In the first step the ordinary least square, pooled OLS regression analysis is performed. In the presence of endogenous variables, the results of simple OLS are inconsistent. The Durbin-Wu Hausman (hereinafter DWH) test for the detection of endogeneity has been applied. The DWH test is applied on the basis of augmented regression (Ullah et al., 2018). The significant F-statistics of the DWH test hints that it is necessary to control for the endogeneity and simultaneity bias (Kao et al., 2018). The value of the DWH test is to be significant to prove the OLS model as inconsistent and the endogeneity problem cannot be ignored (Kao et al., 2018; Rahman et al., 2019).
A superior estimation in the form of fixed effects is obtained. A significant p-value of the Hausman specification test shows that fixed effects are more appropriate than random effects. The panel data fixed or random effects are based on the assumption of a strict exogeneity (Antonakis et al., 2010). A strict exogeneity assumption allows us to determine that firms’ current sustainability initiatives are not the result of past CFP-dynamic endogeneity or present CFP-reverse causation (Cavaco & Crifo, 2014). It is not uncommon that the variables are endogenous in most of the situations, rather they tend to be exogenous (Ketokivi & McIntosh, 2017). Fixed effects are efficient in handling the endogeneity caused by unobserved heterogeneity and they do not control for other sources like dynamic endogeneity and simultaneity (Ullah et al., 2018). In the case of fixed effects models, a violation of the assumption of strict exogeneity, they being efficient only in handling unobserved heterogeneity, and their applicability only to static panel data leads us to move for a superior estimation in the form of system GMM. The GMM better controls for the sources of endogeneity (Li, 2016). The GMM model works on internal transformation and makes exogenous instruments within the data set by taking lagged dependent variables hence, accommodating the dynamic panel data (Cavaco & Crifo, 2014).
Table 4 presents the regression results of CSQI and ROA. A pooled OLS regression has been estimated first and the tests of multicollinearity, heteroskedasticity, and endogeneity are applied. In order to determine whether the variable CSQI is endogenous or exogenous, an augmented regression is estimated to perform the DWH test. An augmented regression has been performed by taking the explanatory variable (CSQI) as a dependent variable and taking the residuals. These residuals are then added to the basic model to obtain the test statistics of the DWH test.
Regression Results of CSQI and FP—ROA as the Dependent Variable.

Source. Author’s calculation from STATA.
Note. Mean VIF: 1.11.
, **, and * are statistically significant at 1%, 5%, and 10% respectively. Standard errors are shown in parenthesis.
A significant p-value of the DWH test indicates that the variable CSQI is endogenous. The null hypothesis of exogeneity is rejected. Hence, the coefficients of pooled OLS are declared inconsistent. A significant result of the Hausman test guides to present the results of fixed effects. The fixed effect models are not supposed to solve the problem of endogeneity except for the kind of unobserved heterogeneity. In the estimation of system GMM, there exists a positive and significant relationship between CSQI and CFP measured through return on assets (ROA), ceteris paribus. The relationship is positive and significant at a 1% level of significance (p < .01).
The lagged dependent variable for example L.ROA shows a significant association with the firms’ past performance. The financial performance is persistent and is the realization of its past performance. The coefficients of all the control variables used in the study are also significant at a 1% level of significance. All the control variables are negatively related to firm performance except ownership concentration. It is concluded that the quality of CS disclosure enhances the return on assets (ROA). The results of AR (1) statistics confirm the presence of first-order serial correlation. The null hypothesis of no serial correlation can be rejected for AR (1). A GMM estimation requires the presence of first-order serial correlation. However, the second-order serial correlation ought not to be present and the results depict the absence of second-order serial correlation as shown by the insignificant p-value of AR (2) statistics. The null hypothesis of no serial correlation cannot be rejected for AR (2). An insignificant p-value of the Hansen test shows that the instruments used in the internal transformation are valid. The null hypothesis of the validity of instruments cannot be rejected. The mean VIF is 1.11 which is less than 10. According to Wooldridge (2010), there is not a serious issue of multicollinearity if the value of VIF is less than 10. Hence it is concluded that the issue of multicollinearity does not exist.
Table 5 shows regression results of CSQI and market-based CFP measured through Tobin’s Q. In the presence of endogeneity as shown by the significant p-value of the DWH test, superior estimations in the forms of fixed effects and system GMM have been obtained. The null hypothesis of exogeneity is rejected. In the presence of endogeneity, the results of system GMM have been obtained and presented for interpretation. In the system GMM estimation, the relationship between CSQI and Tobin’s Q is positive and significant at a 1% level of significance (p < .01). It is interpreted that an increase in the firm’s sustainability efforts enhances their market-based CFP. The lagged dependent variable at the first lag is significant at 1%. The Breusch-pagan heteroskedasticity test (hettest) has shown that heteroskedasticity is present in the data. Due to this reason heteroskedastic robust standard errors have been presented in the estimation of pooled OLS and fixed effects (Buallay et al., 2020). The p-values of AR (1) and AR (2) statistics depict the presence and absence of serial correlation in the first and second-order respectively. The p-value of the Hansen test is showing the validity of the instruments used in the GMM estimation. From the regression results of CSQI and the measures CFP, we accept our hypothesis H1.
Regression Results of CSQI and FP—Tobin’s Q as the Dependent Variable.

Source. Author’s calculation from STATA.
Note. Mean VIF: 1.12.
, **, and * are statistically significant at 1%, 5%, and 10% respectively. Standard errors are shown in parenthesis.
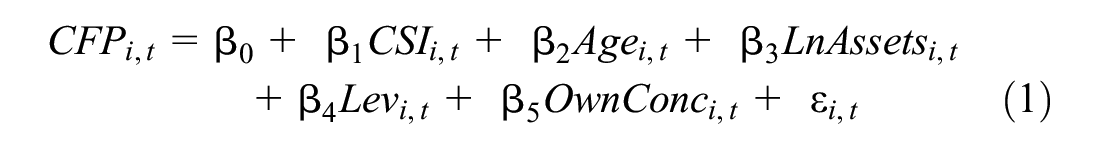
Table 6 shows a regression analysis of CSLI and ROA. The regression analysis has been performed for CSLI and measures of CFP for ROA and Tobin’s Q. The procedure followed is the same as above in the case of CSQI and measures of CFP. A significant p-value of the DWH test has pointed that the variable CSLI is endogenous. The null hypothesis of exogeneity has been rejected. The insignificant p-value of the Breusch-pagan test has shown that there is not any problem of heteroskedasticity in the data. The Hausman specification test advocates in the favor of fixed effects. Finally, the results of system GMM have been obtained and interpreted.
Regression Results of CSLI and FP—ROA as the Dependent Variable.
Source. Author’s calculation from STATA.
Note. Mean VIF: 1.08.
, **, and * are statistically significant at 1%, 5%, and 10% respectively. Standard errors are shown in parenthesis.
The regression analysis has confirmed that there exists a positive relationship between CSLI and CFP measured through ROA. In the GMM estimation, the relationship between CSLI and ROA is significant at a one percent level of significance (p < .01).
Leverage, firms’ age, and size show a negative relationship with ROA while the sign of ownership concentration is positive and significant. The p-values values of AR (1) and AR (2) statistics validate the estimation of GMM by showing the presence and absence of first and second-order serial correlation. The p-value of the Hansen test indicates that the instruments used in the GMM are valid.
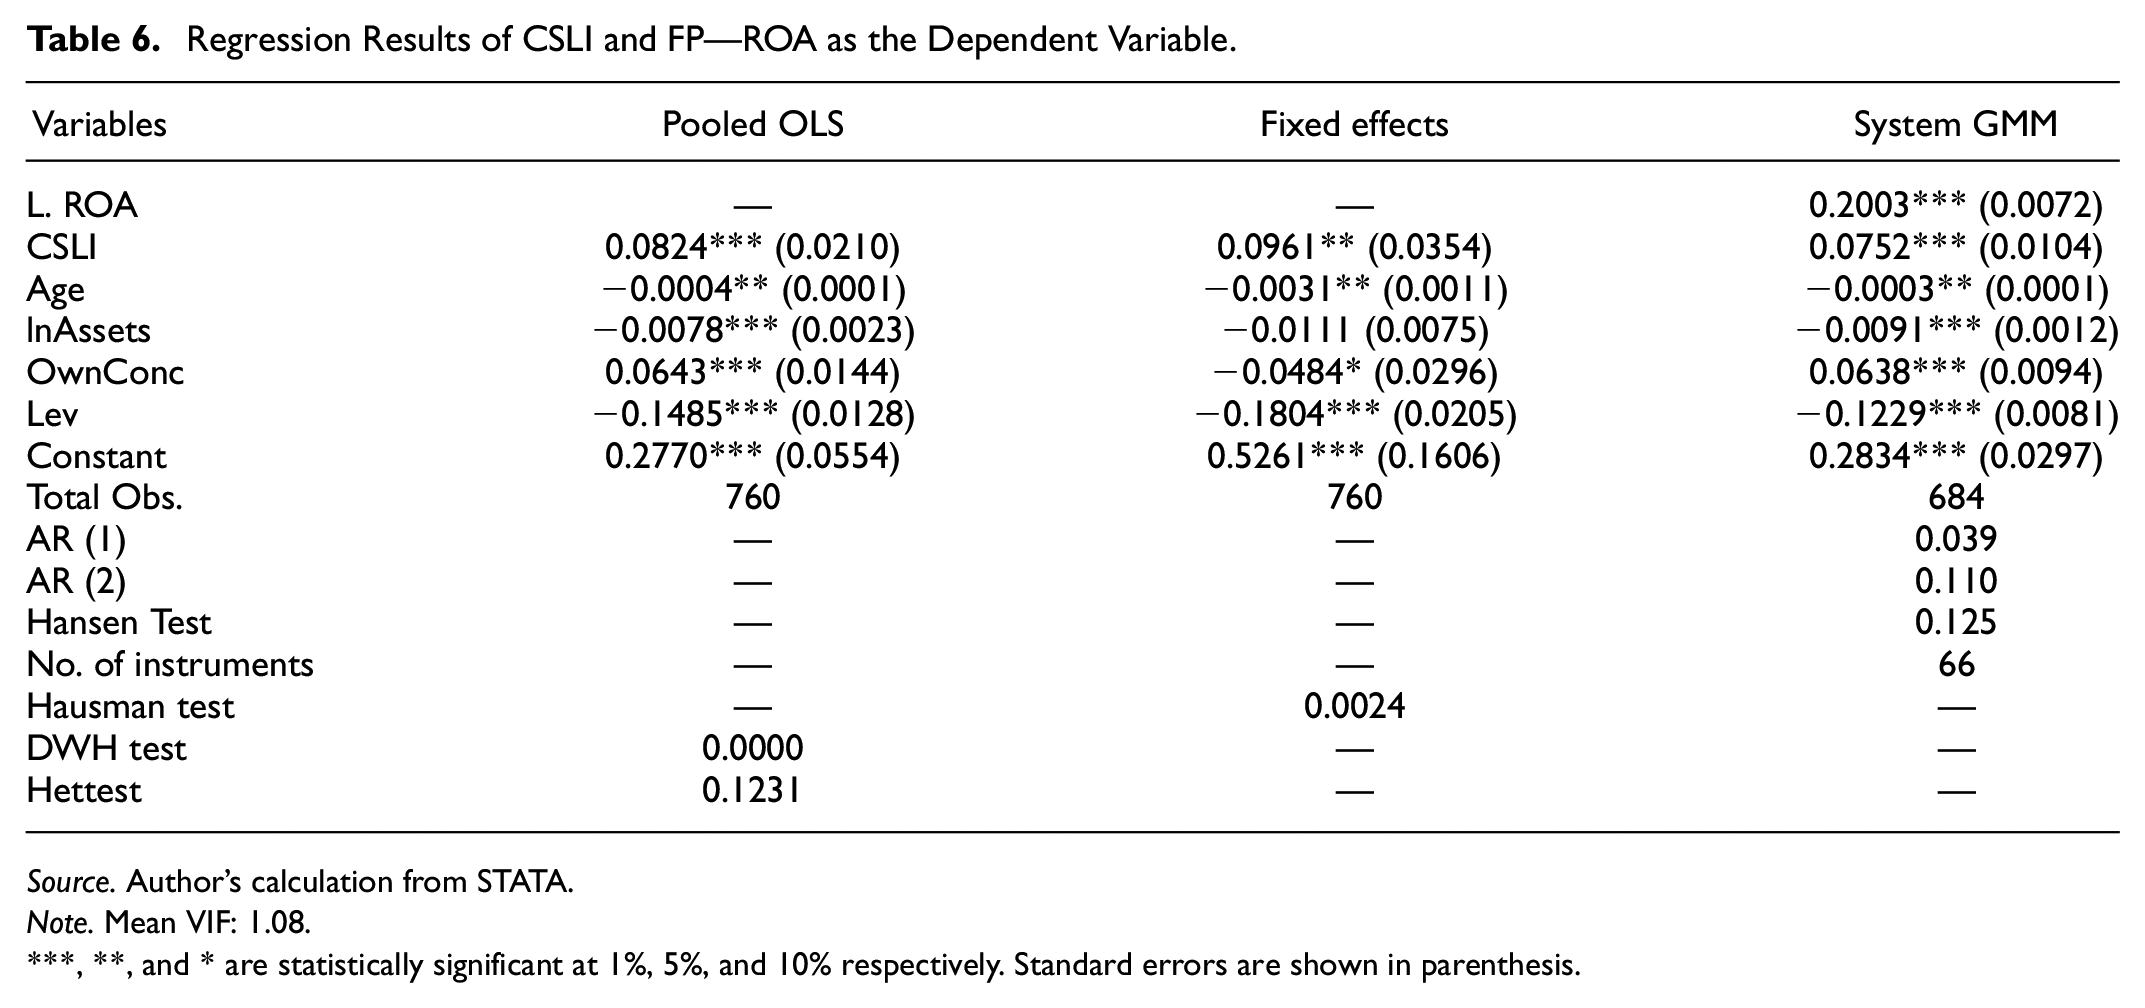
Table 7 shows the regression results of CSLI and Tobin’s Q. An appropriate model has been estimated in the form of system GMM. The Breusch-pagan heteroskedasticity test results depicted that heteroskedasticity is present in the data, leading to present the heteroskedastic robust standard errors. The significant p-value of the DWH test hinted that the variable CSLI is endogenous, thus guiding that the coefficients of pooled OLS are inconsistent. Superior estimations have been obtained in the form of fixed effects and system GMM. The fact that fixed effects only solve the endogeneity caused by unobserved heterogeneity make us move for the system GMM. The GMM results have depicted that there exists a positive and significant relationship between CSLI and Tobin’s Q. The relationship is significant at 5% (p < .05). Based on the results we hereby accept our hypothesis H2.
Regression Results of CSLI and FP—Tobin’s Q as the Dependent Variable.
Source. Author’s calculation from STATA.
Note. Mean VIF: 1.08.
, **, and * are statistically significant at 1%, 5%, and 10% respectively. Standard errors are shown in parenthesis.
Regression results have provided a shred of evidence that there exists a positive relationship between CS performance and CFP of the firms.
Based on the results of regression analysis we hereby accept our hypotheses H1 and H2. Both the CS disclosure quality and level enhance the accounting and market-based CFP of the firms. The firms in the sample get stakeholders’ favor and are better off financially. The results suggest that the stakeholder theory prevails in the context of Pakistan and companies are benefiting from their stakeholders’ orientation. The corporate initiatives for sustainability equally reported with financial reporting result in an increased value for the firms (Oncioiu et al., 2020). The reputational benefits associated with CS initiatives are the driving forces behind the improved financial performance of the firms (S. Kim et al., 2021). A good environmental performance by the firm provides stakeholders support (L. Zhang et al., 2020). The financial gains that are obtained from firms’ orientation toward the stakeholders thus can be aligned to build unique resources for sustaining the competitive edge (Yadav et al., 2017). It is argued that CS initiatives create a win-win situation for the firms.
Conclusion
The involvement of companies in CS initiatives is recognized by the stakeholders. Such stakeholder support benefits the companies, resulting in an improved financial performance. The world is progressing on the concept of sustainable development and the corporate sector has well embraced the idea. The modern way of doing business is to actively pursue sustainability strategies. The evaluation of companies for their contribution to CS provides useful understating and ideas for improvement. The study has built a comprehensive CS construct in the Pakistani market for non-financial firms. The CS index presents a balanced measurement of the variable referring to the indicators included in the index. With the inclusion of the ethical dimension of CS, the study significantly contributes to the body of literature. However, the CS disclosure over the selected indicators is not high and can be described as low to moderate disclosure. Companies do on average report on 47% of the indicators and quality of such disclosure is 27%.
This study has found CS scores on the criteria of quality of CS disclosure in addition to its level. Companies do not provide quantitative or statistical data on the indicators and the quality of disclosure is low. The reporting pattern is also inconsistent among the companies as shown by the difference in the number of companies reporting on indicators. Companies also do not report consistently on the indicators during the entire period of study as the 10 years mean score is less than 1 on the individual indicators. The generic and inconsistent disclosure is the cause of the lower mean score on the indicators on the quality of disclosure scoring criteria (Appendices A, B, C, and D). Few firms disclose CS information over the pattern of GRI guidelines. Mandatory disclosure by firms on sustainability indicators is strongly recommended. The voluntary nature of the CSR reporting guidelines leaves it at companies’ discretion to report on sustainability.
The Security and Exchange Commission of Pakistan (SECP) recently updated the Code of Corporate Governance for listed companies (2019) though requiring companies to adopt a “comply or explain” approach to Environmental, Social and Governance (ESG) disclosure is great hope. However, it just puts the responsibility on the shoulders of the Board to make sure the ESG sustainability disclosure does not specify the performance indicators to report on. Companies’ efforts should be guided toward CS which could lead them to identify and disclose the material non-financial key performance indicators.
From the regression results, it has been found that a positive and significant relationship exists between CS and CFP. The earlier research has shown that there exists a positive and significant relationship between CS and CFP among the emerging economies of Asia (Su et al., 2016). The positive relationship of CS disclosure with market-based CFP indicates that the market reacts to the CS efforts of firms. The study has also controlled for the endogenous nature of the CS-CFP link and followed more robust approach of identifying and dealing with endogeneity bias. From the positive relationship between CS and CFP, it is concluded that firms get stakeholders’ favor by involving in CS activities. The firm’s orientation and involvement in sustainability attributes like environment, labor practices, community, human rights, product responsibility, economic, and ethics are the determining factors in CFP. It is concluded that stakeholder theory has its roots in the Pakistani market. Stakeholders’ orientation in the companies’ philosophy provides them practical attention and as a result, these actions prove to be instrumental in enhancing the firms’ profitability.
Practical Implications
The study provides a great deal of insight into the CS efforts by the companies in Pakistan. The regulatory authorities may use the companies’ scores on quality of disclosure for policy discussion and for seeking improvement. The management of the companies may also take useful insights from the measured CS efforts and may enhance the non-financial disclosure in terms of quality and quantity. The social and environmental activists may find the companies’ scores on social and environmental indicators useful for demanding more efforts on the part of companies. The ethical dimension may also be added to the CS construct in future research. The study also provides a useful understanding of the concept to academia regarding the measurement of the CS construct.
Limitations
The study only evaluates the CS efforts of the non-financial sector. Future research can include financial sector companies. Future research in CS scholarship may apply the methodology of capturing CS scores. Firms belonging to environmentally sensitive industries may be evaluated separately for CS and financial performance.
Footnotes
Appendix
Companies and Sectors.

| S. No | Sectors | Frequency | Percentage |
|---|---|---|---|
| 1 | Oil Gas and Refinery Firms | 12 | 16 |
| 2 | Chemical and Pharmaceutical Firms | 11 | 14 |
| 3 | Cement Manufacturer Firms | 11 | 14 |
| 4 | Fertilizer Sector Firms | 6 | 9 |
| 5 | Automobile Assembly and Parts Sectors Firms | 6 | 8 |
| 6 | Food and Personal Care Sector Firms | 6 | 8 |
| 7 | Engineering Sector Firms | 4 | 5 |
| 8 | Information, Communication, and Transport Firms | 4 | 5 |
| 9 | Textile Sector Firms | 4 | 5 |
| 10 | Miscellaneous Firms | 12 | 16 |
| Total | 76 | 100 | |
Source. Authors’ compilation.
Declaration of Conflicting Interests
The author(s) declared no potential conflicts of interest with respect to the research, authorship, and/or publication of this article.
Funding
The author(s) received no financial support for the research, authorship, and/or publication of this article.