
Abstract
This research aimed to study significant relationships among factors influencing customer satisfaction and loyalty in the health care service industry. In order to test the conceptual framework, structural equation modeling (SEM) was used to analyze the data from 252 respondents (outpatients) at four public and private hospitals in Khon Kaen City, Thailand. This empirical research determined how the health care service image, service quality, and behavioral intentions were interrelated using a scale adapted from Taiwan Customer Satisfaction and American Customer Satisfaction Indices, as the perceived quality variable was designated as a second-order construct. The findings showed that the significant factor impacting customer loyalty is customer satisfaction. Corporate image significantly enhanced both customer expectations (CEs) and perceived service quality. The researchers also observed that perceived service quality was positively related to tangibility, instrumental, and emotional supports in addition to customer satisfaction. In conclusion, this article proposed a thoughtful research scenario for management and corporate/public policymakers at the national level in Thailand. It was observed that a good image could directly enhance perceived service quality for businesses in the health service sector.
Short Abstract
We aimed to explore the relationship between image, service quality, and patient loyalty in the health service sector. A multivariate analysis (structural equation modeling) was employed to analyze the data from 252 outpatients in Khon Kaen City, Thailand. The conventional service quality model suggests that corporate image influences customer expectation, and then affects perceived service quality, then customer satisfaction, and finally, loyalty. However, this article found that, in the health service sector, a corporate image may directly influence perceived service quality without the customer expectation variable as a mediator.
Introduction
Health care is one of the essential sectors in the service industries of every country, and Thailand ranks sixth among countries concerning the best health care, receiving an overall score of 67.99 out of 100. This number was derived from the ranking that examines 89 countries worldwide for five different health variables, such as infrastructure, health care professionals (doctors, nursing staff, and other health care workers), quality medicine availability, costs, and government readiness (Ireland, 2019). When it comes to health care services in Thailand, the potential of medical services can be divided into three levels. First, primary care is the day-to-day health care provided by a health care professional or the service place to which people go for general health advice or treatment, such as general practitioners (GPs), the family or local doctor), and community services. These services are close to the community and integrated by nature, including medical care, health promotion, disease prevention, and rehabilitation. Second, secondary care places emphasis on medical treatment for severe diseases using more sophisticated facilities. The services are served at hospitals at the district level and the provincial level, and large hospitals managed under the Public Health Ministry. The third level is tertiary care and excellence center using advanced medical technology to diagnose complicated diseases. These services are equipped with medical personnel in specialized fields. At all three levels of Thai medical services, there are both public and private service providers. Thailand has 13,438 public hospitals and health care facilities, 380 private hospitals, and 13,465 private clinics as of 2019 (Thai Health Coding Center, 2019).
Maslow’s hierarchy of needs (Maslow, 1943), which is a psychological theory containing a 5-tier model of human needs: (a) physiological, (b) safety, (c) belongingness, (d) esteem, and (e) self-actualization defines hierarchical pyramid levels. Mainly, medical centers play one of the most critical roles in measuring national progress in physiological needs. Government and public hospitals do not have sufficient resources to respond to the needs of the patients. Service quality is not that high, resulting in the establishment of private hospitals that support middle- to high-income patients who can pay higher service fees. The private hospital business has grown in conjunction with the economic growth of the country because people have higher purchasing power, including the attitude that service needs to be more convenient and faster, leading to increased use of private hospitals. According to the number of medical services from 2017 to 2019 (Medical Devices ASEAN, n.d.), the researchers found that the increase in the number of medical services in Thailand was about 16% over those two consecutive years.
Furthermore, the state of society today has changed a lot from the past due to economic, social, political, and cultural variables. Factors increasing the demand for health care services in the country originated from population aging, growing prevalence of chronic diseases, urbanization, and a combined result of the increasing income, and an increase in the middle class. A significant challenge is that Thailand is among the most rapidly aging nations in Asia after Japan, Singapore, and Hong Kong. Sharing demographic similarities with China, Thailand is facing an aging society and has been predicted to become an elderly society by 2031 (KPMG, 2019). Besides, the morbidity rate among Thai people has increased, especially the tendency of diseases in the noncommunicable diseases (NCDs), such as obesity, diabetes, heart, blood vessel, kidney diseases, and cancer. In addition, urbanization also refers to the migration of the Thai population to urban areas. In 2017, 49.2% of Thailand’s total population lived in urban areas and cities (Plecher, 2019). These demographic and geographic changes have increased the number of middle-class citizens and the country’s average income. Essentially, business operators, brand owners, and marketers need to understand changes in consumer perspectives to prepare products or services that meet the market needs.
Thailand has an excellent health care system, and it has turned out to be one of the medical and wellness tourism destinations of world travelers because of the lower costs for treatment than in many other nations (World Health Organization, 2017). Joint Commission International (JCI) accreditation represents the “gold standard” in health care and patient safety, and Thailand has more than 60 scientific services with international health care accreditation that puts them on par with requirements and practices found in the United States. Most of the medical professionals in Thai hospitals or health care facilities are American Board Certified, and many of the doctors and surgeons practicing have also earned international qualifications from many western countries, mainly the United States and the United Kingdom (Immigration Bangkok, 2019). This development has resulted in rapid growth in complementary industries such as pharmaceuticals, laboratory examinations, and clinical R&D.
The government and private sectors have been trying to position Thailand as one of the medical hubs of Asia (Department of International Trade Promotion, 2020). Notably, within a 10-year time frame (2016–2025), the progressive policies were established to make the country accomplish the position of “Thailand, a Hub of Wellness and Medical Services.” This policy focuses on four primary areas, namely, wellness, medical services, academics, and products. Thailand has welcomed 3 million medical tourists each year, which has already drawn tourists from throughout the world. The country is also an aviation hub in the South Asian area, with all crucial worldwide destination flights leaving and arriving daily. The warm weather, famous Thai cuisine, user-friendly tourism infrastructure, exotic islands, and sun-kissed beaches present a tremendous appeal for travelers from Europe, the United States, and Australia, especially. There is also a rising demand by medical tourists from the Middle East and Cambodia, Lao People’s Democratic Republic (PDR), Myanmar, and Vietnam (CLMV countries).
The combination of health care quality and low service costs makes Thailand very competitive in attracting international travelers for medical check-ups and cosmetic and dental services with an increasing focus on health and wellness. While Singapore and South Korea are competing for many of the same visitors by offering high-quality services, medical tourists also value the unique attractiveness of Thailand’s low-priced hotels, culture, shopping, and the service-minded tourism industry. In 2018, there were 347 private hospitals and clinics in Thailand. There were 58.8 million outpatients and 2.8 million inpatients, while there are 1,002 public hospitals in Thailand. The number of outpatients was approximately 71.83 million and 5.53 million for inpatients (National Statistical Office, 2018). However, the growth and fierce competition within the health care service industry domestically and globally result in the need for the health care provider to improve its service quality model.
According to the problems mentioned above, the researchers realize the importance of evaluating medical centers’ performances and quality so that the health care provider can use the research results to develop their own business to meet the needs of the patient and maximize customer satisfaction (CS). This research aimed to elucidate methods for superior service delivery for the health care business using empirical evidence from Khon Kaen City, Thailand, because it is the medical and academic center of the region (Ketkaew & Naruetharadhol, 2016). The research objective was to study significant relationships among factors, such as, corporate image, customer expectation (CE), perceived quality (PQ), CS, and customer loyalty (CL) associated with medical centers in Khon Kaen City, Thailand. This research may provide guidelines for Thai health care providers so that they understand the factors that affect CS and can analyze customer needs and then use the resulting information to develop their effective marketing strategies. The second-order structural equation modeling (SEM) approach was applied to test the significance of these relationships. In recent times, the two main streams in research dealing with consumers in the health service industry have employed (a) probability-based statistics like regression and SEM (Anabila, 2019; Asnawi et al., 2019; Schmalbach & Avila, 2018) and (b) stochastic-based statistics like the second synthetic gray relational analysis (SSGRA) model (Javed & Liu, 2018; Li et al., 2014; Liu et al., 2014; Swain et al., 2017; Wang & Qian, 2017). As for theoretical contribution, an application of the second-order SEM to create a health service system model that enhances CL could describe the relationship between service quality and CL in a more profound sense.
The article is divided into six sections: (a) in the introductory part of the article, Thai medical services are related to a discussion of overall health market analysis, competitive environment, industry growth, and potential challenges are presented. (b) The second section lays the foundation of the research framework with related theories and academic literature. This section also describes the studied variables and their measurements. (c) The third section outlines the research method involving sample and data gathering as well as statistical models. The findings and analysis of the results from the test models are discussed in (d) the fourth section. Finally, (e) the last section summarizes this research article by discussing significant conclusions drawn from this study in addition to suggesting policy implications.
Literature Review
Consumers worldwide are increasingly aware of the importance of service quality. Therefore, the demand of customers for higher-quality services has increased (J. Lee, 2005). Service sectors need to provide excellent services to customers to gain a sustainable competitive advantage. Despite its criticality of service quality to the service industry, measuring service quality causes difficulties to service providers concerning the unique characteristics of services: intangibility, heterogeneity, inseparability, and perishability. Insight into this, services need an explicit framework for service quality clarification and assessment. Taiwan Customer Satisfaction Index (TCSI) and The American Customer Satisfaction Index (ACSI) developed by H.-Y. Hu et al. (2010) and Fornell et al. (1996), respectively, are widely-used models for measuring service quality in the service industry. To assess the factors that affect the satisfaction of health care centers, the researchers applied the related research concepts to the study.
Image
In marketing, a firm’s image was defined as perceptions of an organization expressed in the associations held in customer memory (Zeithaml et al. 2013). Corporate image may have an impact on corporate credibility (Nisar et al., 2017) and be created by intangibles such as price, word of mouth, and advertising (Clow et al., 1997). Advertisements can improve the trustworthiness and image of the brand and organization. Furthermore, the result of the previous study indicated that advertising credibility positively influences the brand and corporate image (Zimand-Sheiner et al., 2020). Zeithaml et al. (2013) defined customer perceptions as the subjective appraisal of the actual experienced or perceived service and whether the customer was satisfied or dissatisfied with the service quality. When patients assess whether the quality of service meets their expectations, they always consider their perceived service perceptions relative to expectations. Customer perceptions can be affected by a company’s image or reputation. Also, a corporate image was defined as “perceptions of an organization expressed in the associations held in customer memory.” The associations can be reflected by contacting employees and even analyzing the service experience itself. Corporate image can assist a medical center in building positive customer perceptions of their services. This positive image acts as a buffer against incidents of poor-quality service (Zeithaml et al., 2013). Hence, we generated the following research hypothesis.
CE
Expectations can be defined as the “perceived potential of alternative suppliers and brands to achieve an explicit and implicit objective in a particular purchasing decision” (Sheth, 1973). The information on CEs is an essential factor as it influences customer behavior and management within the limited resources that are capable of managing CEs. In general, CEs about a product or service are based on information gathered from existing data sources. CEs may be influenced by advertising, promotions, and word of mouth. Several literature reviews have described the importance of both CEs and satisfaction (Boulding et al., 1993; Parasuraman et al., 1985). Patient expectations are defined as the anticipation that given events are likely to occur during or as an outcome of health care (Bowling et al., 2012). Patient preferences refer to an individual’s evaluation of what should happen during a health care encounter (Wensing & Elwyn, 2003). There are many surveys expressing CEs in different ways, such as, “It is necessary to exceed customer expectations.” It is imperative to remember that if a product or service can fulfill customers’ expectations, they will give more attention and preference to that product or service again. There is one great articulation regarding this finding because if customers have terrible expectation levels of a product or service quality and then perceive it, they will lower their preference levels toward the brand (Rust et al., 1999). This finding may be one reason why CEs cannot be ignored while studying CS because these expectations play an essential role in customer behavior regarding future repurchasing decisions. CEs are the key to CS, pleasure with the product, and loyalty (Kotler, 2000). Health care providers must recognize customer needs and expectations to achieve higher CEs (Parasuraman et al., 1991). Overseeing and fulfilling CEs will provide an excellent tool for enabling CS (Pitt & Jeantrout, 1994). After carefully reviewing the related literature regarding CEs, PQ, and CS, we formed the hypothesis described below:
Quality can be defined as satisfactory or exceeding the needs and expectations of customers; therefore, to a certain extent, customers will ultimately judge the quality of the product (Shen et al., 2000). The perceived service quality of customers has been increasing in recent years due to specific support in particular businesses and improvements in both CS and loyalty (Negi & Ketema, 2013). Service quality is suitable when perceptions equal or exceed CEs. Customers evaluate the service quality by comparing what they want or expect what they receive or perceive (Parasuraman & Berry, 1998). Health care center service quality studies began in the late 1970s, and since then, service quality issues have attracted considerable interest from many scholars. After summarizing the views on service quality, two main types were found: (a) the opinion of the Nordic school represented by Gronroos. In 1984, Christian put forward the perception of quality, which considers that the quality of service is the difference between service performance and service expectation, namely: Quality of Service = Service Performance − Service Expectations. The other is an American school view represented by Parasuraman et al. (1991). The quality of service is the capability of service providers to meet CEs of services. It is defined as the Quality of Service = Customer Expectations − Customer Perception. Patient-defined needs and expectations of health care are increasingly recognized as the essence of health care quality (Hudak et al., 2004). Service quality can be defined as “the distinction between predicted or expected service (customer expectations) and perceived service (customer perceptions)” documented by Parasuraman et al. (1985). The difference between CEs and assessments indicate perceived service quality (Zeithaml et al., 2002). Thus, service quality is a measurement of how well a service delivery matches CEs (Zeithaml et al., 2013). In sum, the literature implies a positive relationship between CE and PQ, and the following hypothesis was established.
PQ
According to the literature concerning service quality, it is generally acknowledged that there is a multidimensional concept of service quality that can mean different things to different people (Mersha & Adlakha, 1992). Parasuraman et al. (1998) defined PQ, “the customers’ overall evaluation of the utility of a product or service based on their perceptions of what is received and what is given.” In health services, PQ can be defined as the patient judgment or impression about a health care unit’s overall excellence and superiority (Javed & Ilyas, 2018). Health service quality comprises of three dimensions (Asnawi et al., 2019; Brady & Cronin, 2001): interaction quality (emotional support), physical environment quality (tangibles), and outcome quality (instrumental support). In this study’s context, because instrumental and emotional supports (ESs) are an explicit demonstration of service quality, it is hypothesized that a positive relationship exists between instrumental and ESs and PQ. Tangibles (T) are also one of the derivations of PQ from the consumers’ perspective. The following gives more details regarding the dimension of PQ in the health service industry.
Instrumental support refers to offering physical help. This section addresses the capability of performing the promised service dependably and accurately, which represents the dimension of reliability (Asnawi et al., 2019; Brady & Cronin, 2001; Parasuraman et al., 1998). For instance, when the customer comes to the health care facility, they are hoping for physical help. Hence, providing this type of service at that time has been promised by the facility.
Emotional support (or empathy) indicates the caring and individualized attention that the health care facility provides to residents (Asnawi et al., 2019; Brady & Cronin, 2001; Parasuraman et al., 1998), taking into account the emotional needs of the customer when they purchase the service. The customer needs help and attention from personnel, including counselors, who assist with changes in life transitions, such as aging, cognitive decline, and loneliness. Customer support is the crucial element in defining the quality of services (Naruetharadhol & Ketkaew, 2018) and includes addressing the diverse needs of the elderly. Health care personnel should be good listeners when a customer needs help with a disease, and customers need advice from the doctor to heal/treat them. Attention, enthusiasm, and willingness of staff are essential from these aspects because the way the customer is treated relates to how the customer feels about the facility. Therefore, the following hypotheses were proposed.
Tangibles address contemporary tools or equipment, such as visually appealing and clean physical facilities, in addition to clear signs, symbols, and sufficient facilities (parking, public telephone, and seating). The spacious area around the clinic center is also essential. There should be adequate lighting in the clinic. The pathway should be safe and should have a non-slip rubber pad. Visual factors, such as the area around the health care center, are also perceived as necessary (Asnawi et al., 2019; Brady & Cronin, 2001; Parasuraman et al., 1998).
Nowadays, the quality of products and services is exceptionally significant. It is generally acknowledged that survival in a complex and competitive world requires quality products. The PQ should be measured to understand and assess the outcomes of the measures taken to ensure good quality. The quality of service can easily be considered by taking into account the physical properties of medical services. The measurement of service quality is somewhat complicated because the quality in this industry depends on many factors. Even though there have been many studies addressing perceived service quality, there is still no particular agreement on the relationship between different measurements and CS. At the moment of purchase, perceived service quality needs to be necessarily the same as customer perception (as stated by Crosby et al., 1990). Numerous definitions of perceived service quality revolve around the identification and satisfaction of customer needs and requirements. There is also conflicting evidence concerning perceived service quality (Lehtinen & Lehtinen, 1982) with three-dimensional views consisting of association, physical, and corporate quality. Perceived service quality is the determinant of CS, as concluded by Cronin and Taylor (1992) and Ramanathan and Ramanathan (2011). The majority of literature reviews point to support satisfaction as the consequence of perceived service quality (Brady & Robertson, 2001; Parasuraman et al., 1985; Taylor & Baker, 1994; Teas, 1994). The customer has positive mental images of the product or service that will lead to higher satisfaction and loyalty (Brodie et al., 2009). Based on the above arguments, the following hypothesis was formed.
CS and loyalty
CS is the area on which we focus to form a good relationship between the organization and the customer. CS is a concept in marketing literature, and it is a big goal for businesses. Companies struggling with their competition must switch from a product and sale philosophy to a marketing philosophy that will yield a better chance to outperform the competition (Kotler, 2000). CS can translate into more profits in addition to market shares for companies. For CS, it is definitely about addressing a customer’s feelings. CS is defined as the overall customer attitude toward a service provider or emotional reaction from them for the difference between what customers expect for and what they receive, that fulfillment of some need, goal, or desire (Kotler, 2000). CS will positively affect company profitability. When customers are satisfied with the product or service, companies generate more opportunities to be successful because satisfied customers lead to brand loyalty, repurchasing activities, and word-of-mouth marketing (Henrique and de Matos, 2015). CL is an essential factor in the growth and performance of companies. Loyal customers purchase the product or service once and then repurchase it in the future (Kotler, 2000). That behavior indicates satisfaction with the product or service from the company. This attitude shows a good quality of service from the company. Service and products affect the customer in such a way that they decide to purchase products that they think are worth the money. If a company can keep the customer with them as long as possible, companies will continue to grow. The finding of prior research suggested that service quality is positively related to CS and CL (Narteh, 2018). Therefore, the following hypothesis was proposed:
Concerning the review of related literature and established hypotheses, we propose the structural relationship among different variables, as shown in Figure 1. Explicitly, the PQ was proposed as a second-order construct and adapted from the first-order hospital service quality model introduce by J. E. Lee and Severt (2017). The second-order model signifies the hypothesis that these seemingly distinct, but related constructs can be accounted for by one or more common underlying higher-order constructs (Thompson, 2004). The rest of the relationships were modified from the patient satisfaction model of H.-Y. Hu et al. (2010). A questionnaire was developed to obtain the required information for the proposed model. The questions in this questionnaire were designed to collect both nominal and ordinal scale variables. Most of the ordinal scale variables followed the form of a 10-point Likert-type scale on which 1 indicates the lowest degree and 10 signifies the highest degree with the mid-point (5) representing a state of uncertainty or neutrality. The English questionnaire was adapted from the literature review (see Table 1 and Appendix A), afterward translated into Thai, and ultimately changed back to English to guarantee no loss of meaning occurred in the Thai version after translation (Douglas & Craig, 2007). This process was performed under the supervision of a linguist at the International College, Khon Kaen University. The questionnaire was divided into three parts: (a) the first part consisted of two screening questions as to whether respondents live in Muang Khon Kaen or not and the type of medical services respondents usually use; (b) the second part consisted of eight questions related to the demographic information of the respondents and included necessary demographic information, such as sex, age, educational level, income, and working sector (details reported in Table 2); and (c) the third part consisted of eight constructs representing latent variables, and their measures represent manifest variables. Table 1 reveals the variables and measures. The literature review characterized all of the indicators for each construct.

Proposed model and constructs.
Variables, Scales, and Measures.

Note. See the abbreviations (I1, I2, I3, . . ., CL3) from Appendix A (Questionnaire).
Demographic Profile of Respondents (n = 252).

Source. Data adapted from Authors (2020).
Methodology
Sampling and Data Collection
Data collection in this research was purposely gathered from respondents who are working age in Muang KhonKaen, Thailand. The quota and purposive sampling methods were used in data collection through a structured questionnaire (Hair, 2008), and the acquired data were kept confidential. The research includes quota respondent proportions from the total population. This technique can be regarded as a sampling method for gathering representative data from a group (Kahle & Malhotra, 1994). It is necessary to focus on a selected population to complete the survey using quantitative methods (Showkat & Parveen, 2017). The quota sampling technique was used to select an equal proportion of the outpatients (25% or 75 respondents) from each of the four selected health service providers. We decided to collect the representative data of health service customers from the four most populated public and private hospitals in Khon Kaen City namely, Srinagarind Hospital, Khon Kaen Hospital, Ratchaphruek Hospital, and Bangkok Hospital (Khon Kaen branch) (National Statistical Office, 2018). The purposive sampling technique was used because only the outpatients or people who had been using the services of the medical center in Muang Khon Kaen and understood the issues under investigation were selected. The data gathering was based on the intercept survey concept to collect on-site perception information from respondents in public areas of the selected hospitals. This approach allows the respondent to complete the questionnaire in one attempt, hence enhancing the quality of feedback due to less distraction (Buschmann, 2019). The study focused only on people above 20 years old in Muang Khon Kaen, Thailand. During the data collection process, there may exist method bias regarding common scale attributes due to several constructs (MacKenzie & Podsakoff, 2012). In this research, this problem was elevated by informing respondents that although some questions may seem similar, each is unique in significant ways. The respondents were encouraged to read each item carefully. Moreover, Harman’s single factor test was also used to examine common method variance (CMV) of the collected data (Podsakoff et al., 2012).
As for the sample size, Hair et al. (2010) suggested that no generally accepted rule was applied in determining a specific sample size for confirmatory factor analysis (CFA), which is the first step to perform SEM. Tabachnick and Fidell (2007) claimed that CFA was sensitive to sample size and could be less steady when estimated using a small sample. As a guideline, Kline (2016) proposed a typical sample size for an SEM study of 200 observations. In contrast, Hair et al. (2010) suggested the minimum sample size of 300 when a structural model involves seven or fewer constructs. Taking in to account the related literature, the researchers decided to collect the data based on a structured questionnaire obtained through intercept surveys of 300 respondents, and 252 valid respondents were selected. As there are no specific rules regarding the sample size for SEM, 252 observations were acceptable because this number is between 200 and 300, as suggested by Kline (2016), respectively. The valid questionnaire rate reached 84%. Based on all of the gathered questionnaires, we can decide whether the measurement has any errors and determine whether the interviewees misunderstood or were perplexed during the answering process.
After analyzing the demographic characteristics of the sample, it was found that most of the respondents were female, mostly between 20 and 30 years old. Most education was at the level of bachelors’ degrees, with the majority of those being private employees with an average monthly income level of less than 20,000 baht. Many people usually visit provincial hospitals. Most of these hospitals had average service fees in the range of 1,001 to 5,000 baht, and most of the influencers on decision-making were family members.
Data analysis
The study’s data analysis employed the SEM technique. SEM encompasses such diverse statistical methods as path analysis, CFA, and casual modeling with latent variables. This approach allows us to analyze the structural relationship between measured variables and latent constructs. Moreover, SEM evaluates the multiple and interrelated dependence in a single analysis. This method is more suitable for this study than a regression analysis that is used to predict a continuous dependent variable from a number of independent variables but cannot represent outcomes as latent variables with multiple indicators (Bollen & Pearl, 2013; Byrne, 2016).
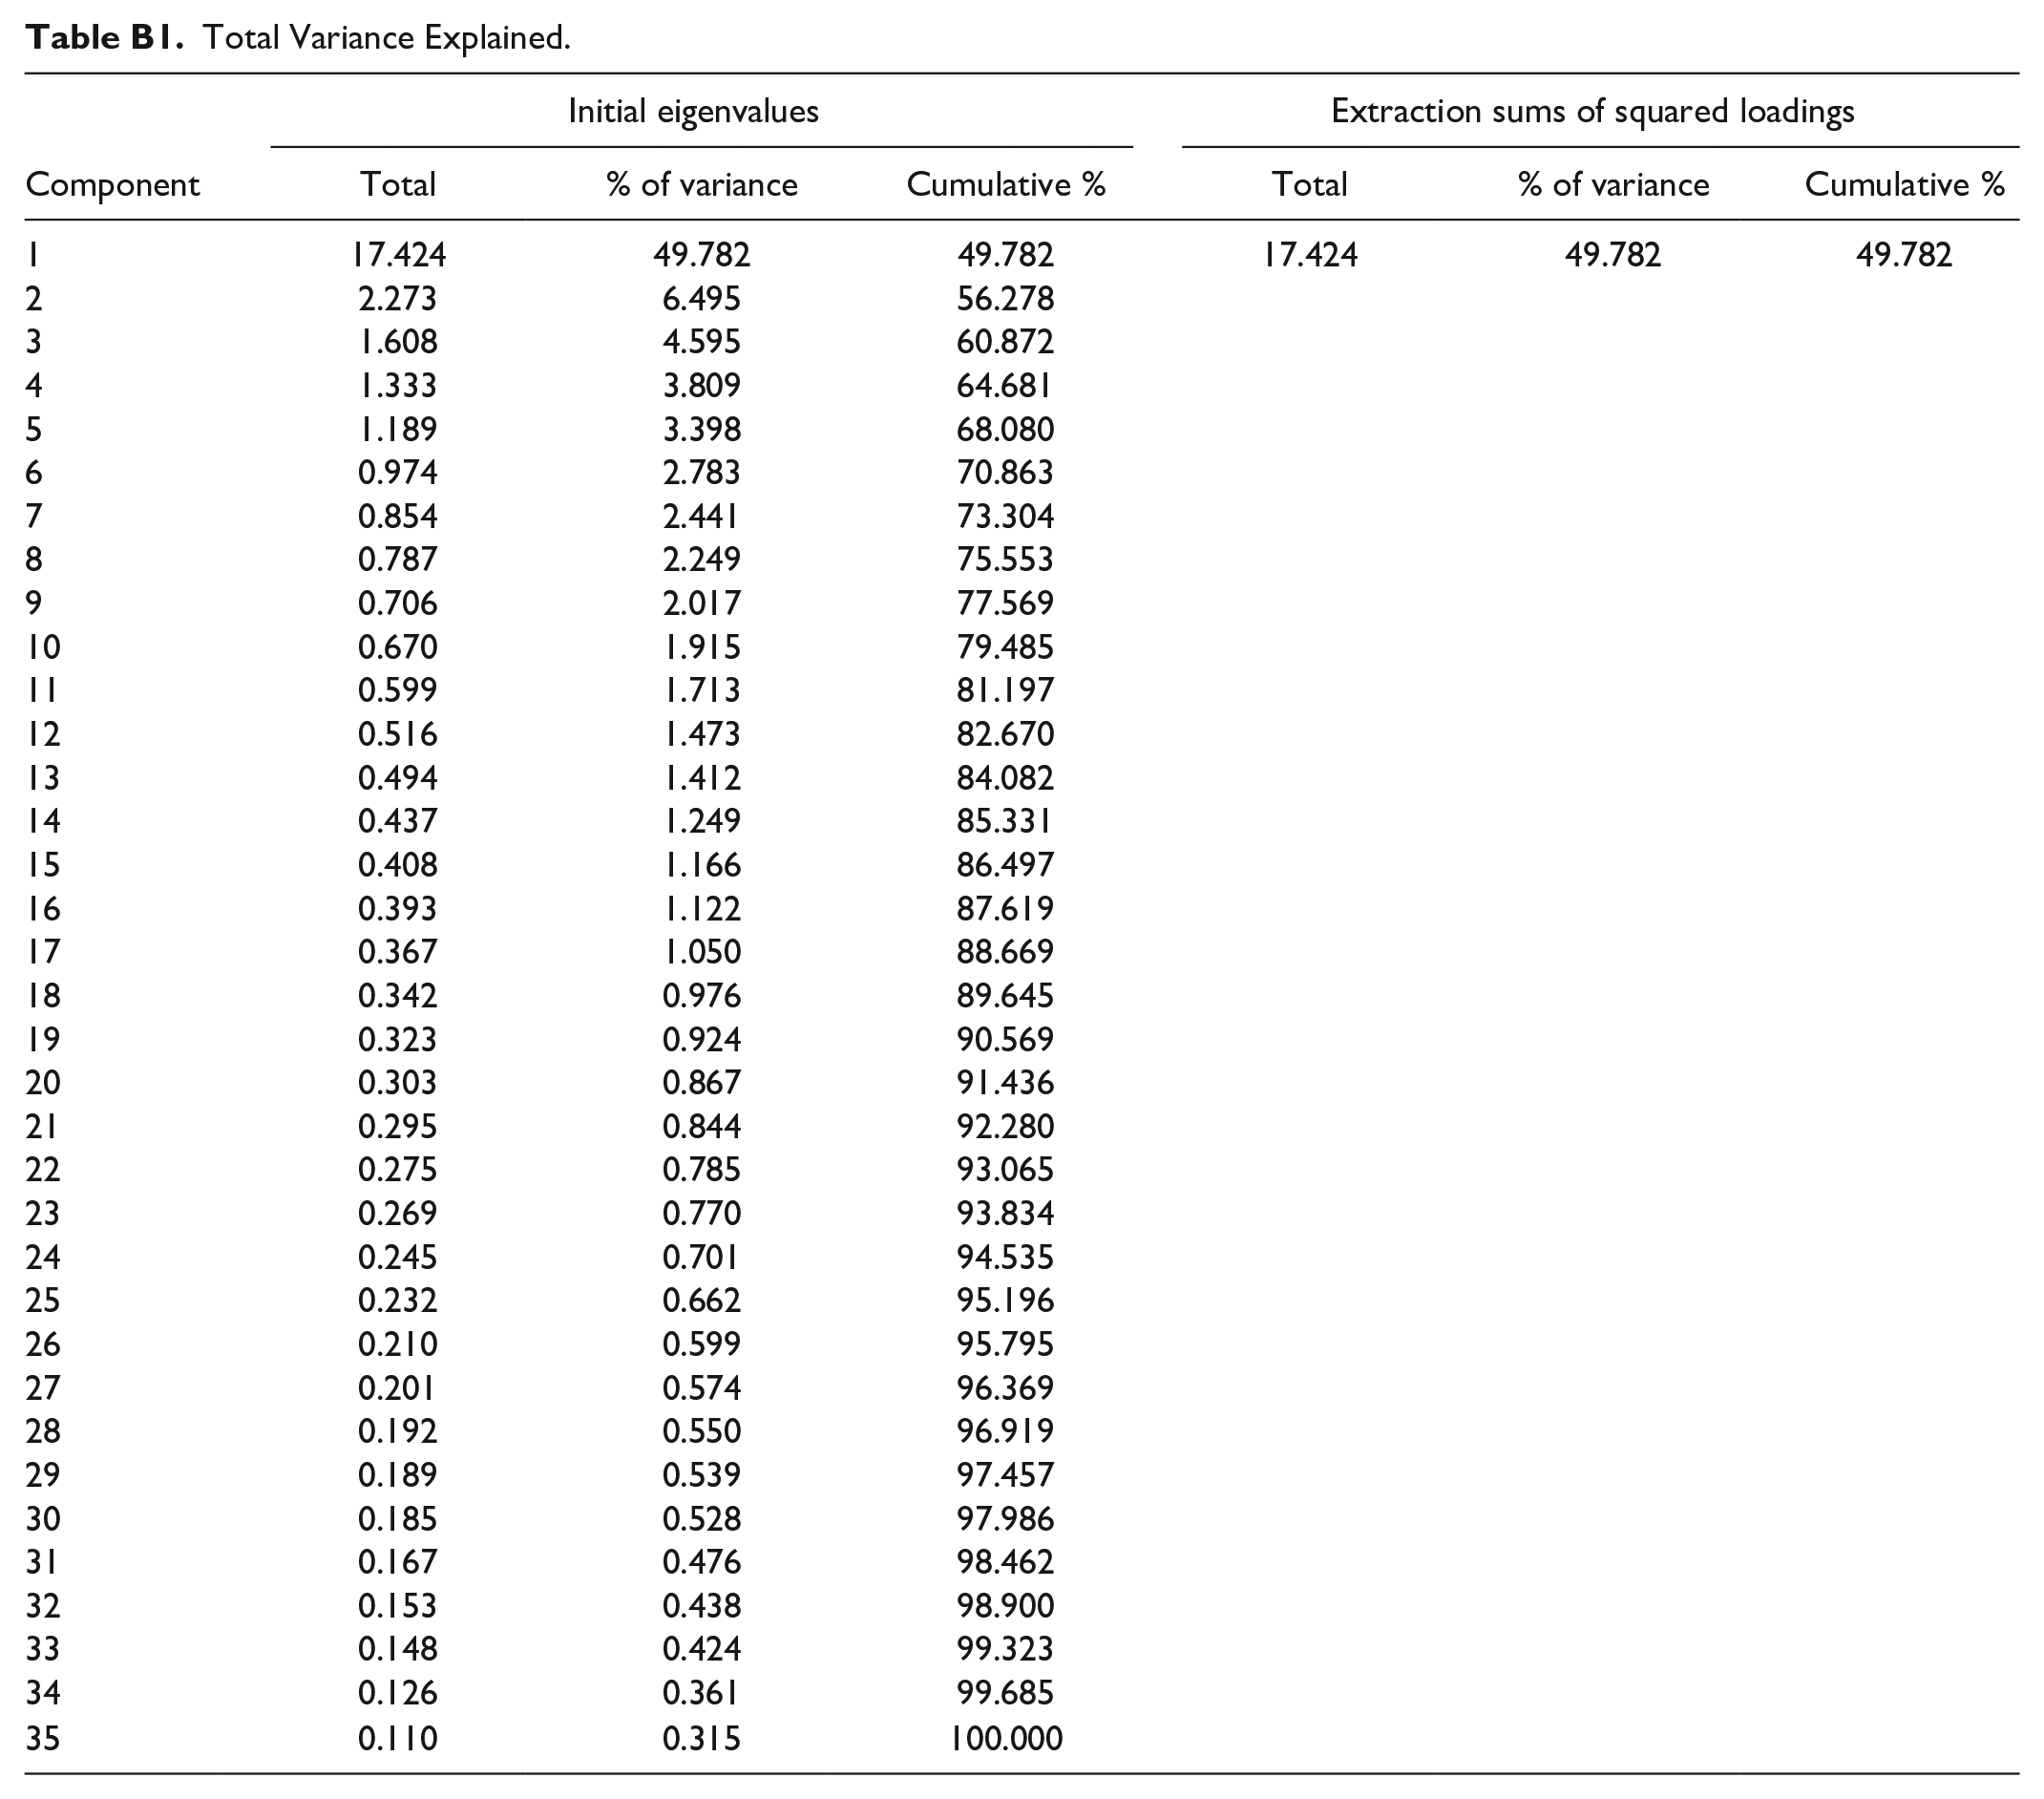
Before analyzing the data using SEM, we addressed an issue of CMV in this study. CMV occurs when variables in the same model are measured using the same method or derived from the same source, which results in systematic error variances among those variables and potentially biases the estimated relationships among them (Podsakoff et al., 2012). This study collected the data, both dependent and independent variables, from the same respondents, therefore, exposing to a risk of CMV. We adapted Harman’s single-factor test following Podsakoff et al. (2012). The results revealed the cumulative variance of 49.782% (less than the 50% threshold), which further assured the absence of CMV (see Appendix B).
Moreover, SPSS and AMOS statistics programs were used for data analysis. The data’s descriptive statistics were first analyzed. Next, given the use of second-order constructs in this research model, an assessment of the proposed second-order models for the PQ and the whole measurement model was adapted from the recent business research literature (Di-Clemente et al., 2019; Ketkaew et al., 2019, 2020; Nadeem et al., 2020). Explicitly, perceived service quality was assigned as a second-order construct, suggesting the two-step approach to assess the study’s measurement model (first-order and second-order measurement models) and the full structural model.
First-order measurement model assessment: This step requires all constructs involved to have a reflective nature (see Figure 2). The constructs were connected using covariances, and the error terms were allowed to covariate to improve the model fit (Hair, 1998). The measurement reliability was examined by the Cronbach’s alphas, using 0.70 as the minimum threshold (Nunnally, 1994). In addition, the model was evaluated regarding internal consistency, convergent validity, and discriminant validity (Hair, 1998; Kline, 2016). The internal consistency employed composite reliability (CR), which is considered adequate when exceeding the threshold of 0.70. Convergent validity was assessed with the standardized loadings and the average variance extracted (AVE), using the minimum threshold of 0.70 and 0.50, respectively. Finally, the Fornell and Larcker criterion was used to evaluate the model’s discriminant validity (Fornell & Larcker, 1981). In this approach, the square root AVE of each construct was placed at the diagonal of the latent variables’ correlation matrix. These square root AVEs must be higher than their off-diagonal correlation values in the associated rows and columns to satisfy this criterion. Moreover, this study also used the heterotrait-monotrait (HTMT) ratio method to assess discriminant validity (Henseler et al., 2015) because the Fornell and Larcker (1981) criterion was criticized for lacking reliability in addressing this issue. The HTMT values of higher than 0.85 (Kline, 2016) or 0.90 (Gold et al., 2001) demonstrate the existence of discriminant validity between the associated latent variables. Finally, the model’s goodness of fit (GOF) was evaluated using p value, minimum discrepancy per degree of freedom (CMIN/DF, <3.00), Tucker–Lewis Index (TLI, >0.90), comparative fit index (CFI, >0.90), Incremental Fit Index (IFI, >0.90), and root mean square error of approximation (RMSEA, <0.10), as suggested by Hair (1998).
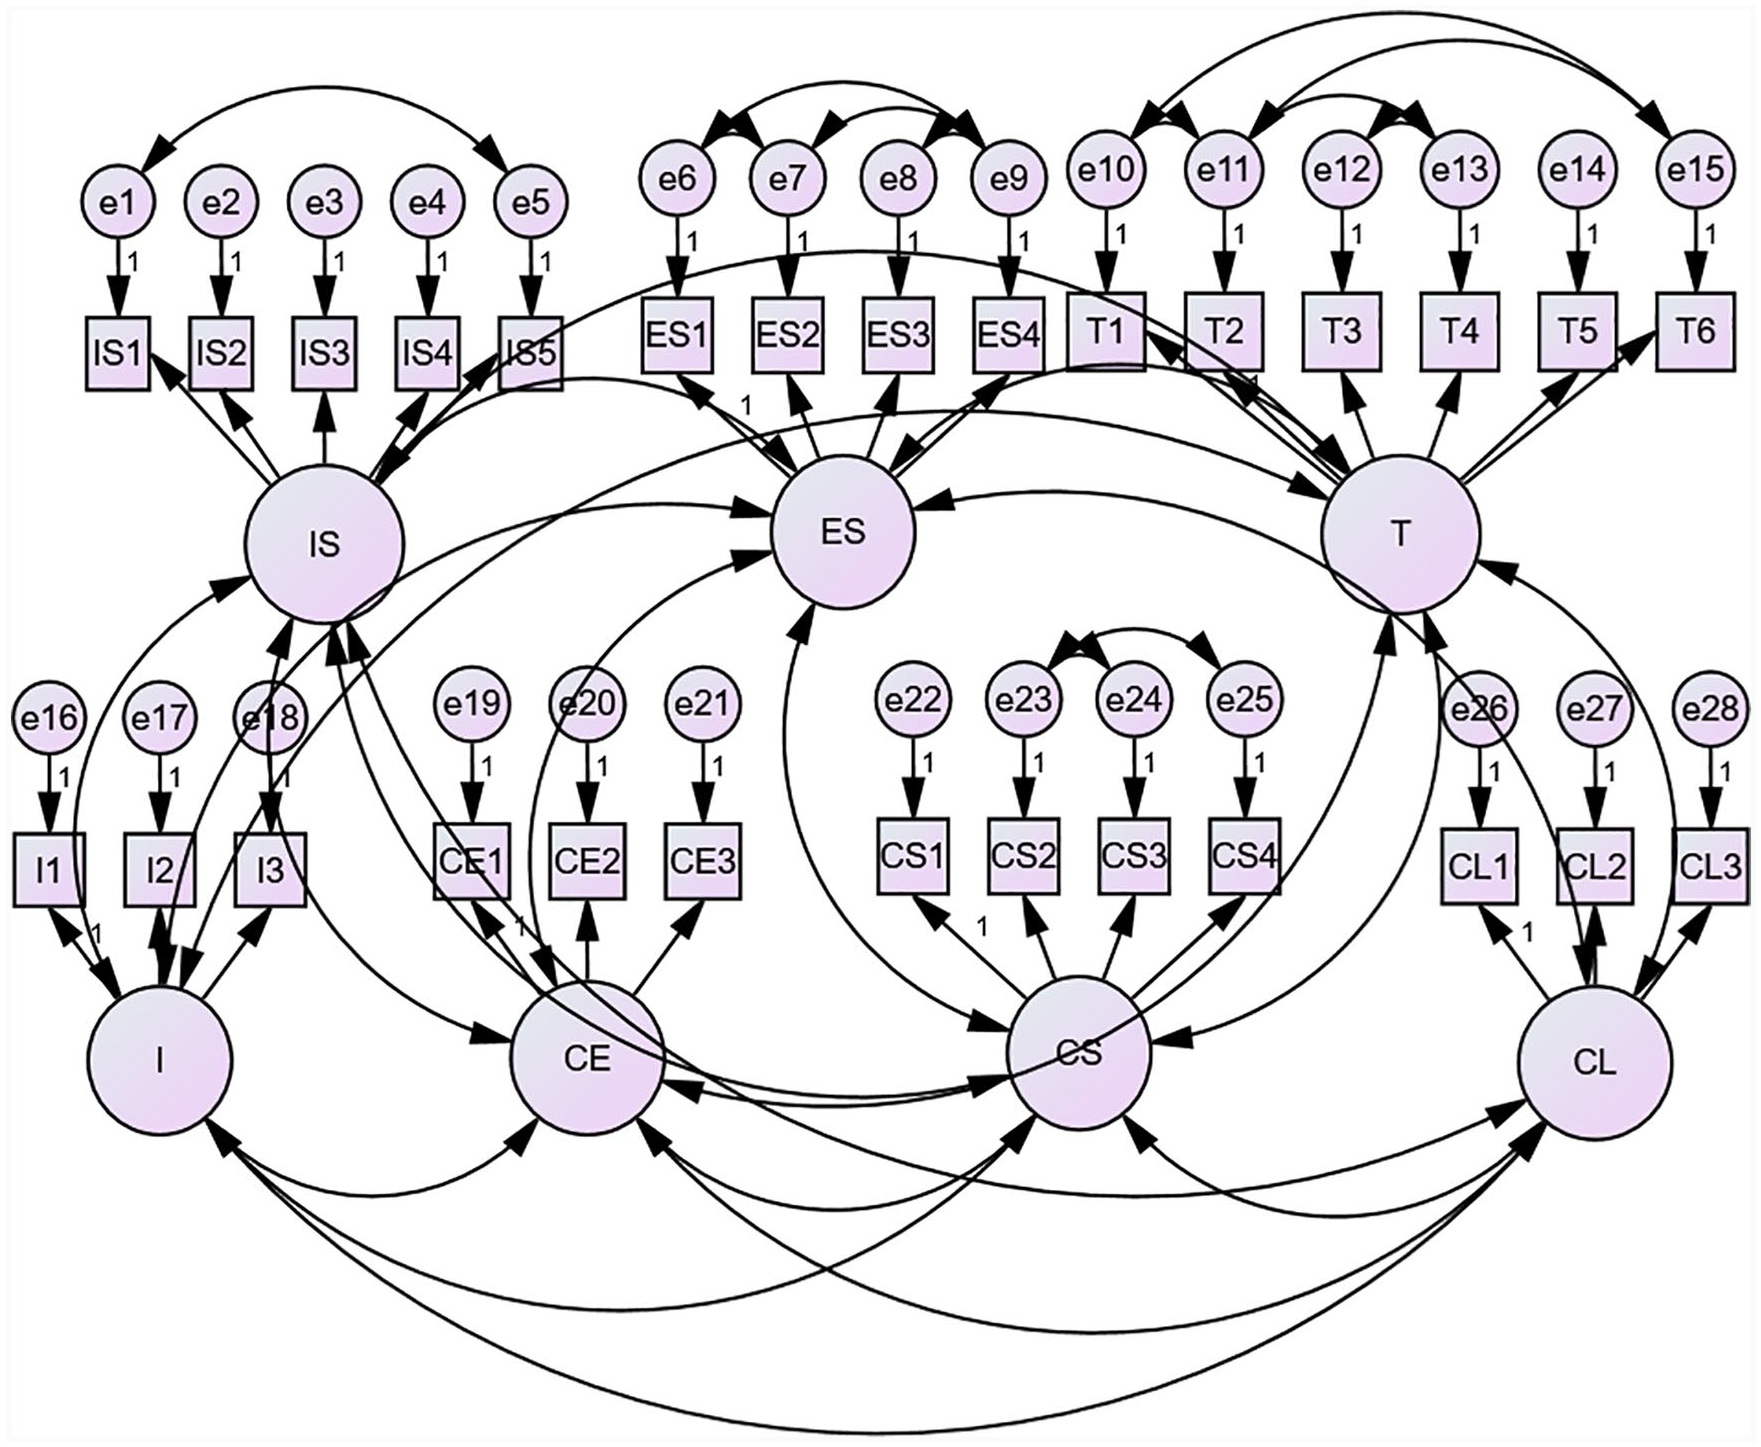
First-order measurement model.
Second-order measurement model assessment: According to Figure 3, this step forms the second-order construct (Perceived Quality) with the three constructs as the formative indicators (IS, ES, and T). At this stage, the model’s measurement validity was re-examined. We used the same assessment criteria as was used in the first-order measurement model assessment except for the discriminant validity criteria because the cross-loading issues among the latent variables were already evaluated using the Fornell and Larcker criterion and the HTMT ratio approach. In addition, assessing the second-order constructs requires the outer loadings >0.50 (Diamantopoulos & Winklhofer, 2001) and significant t values (Peng & Lai, 2012). The variance inflation factor (VIF) was employed to address the multicollinearity of the formative indicators (IS, ES, and T) using the VIF value of 5 as the maximum threshold (Cassel et al., 1999).

Second-order measurement model.
After that, the SEM technique was applied to the data analysis to determine whether the proposed research model fits reasonably well with the collected data and to evaluate the path analysis of the model (Anderson & Gerbing, 1988). The constructs were connected to demonstrate the primary research hypotheses. Then, we summarized the GOF indices of the proposed structural model. If the GOF indices were statistically weak, the model adjustment based on modification indices should be recommended. The results of the analysis are discussed in detail below.
Results
First-Order Measurement Model Assessment
The first-order measurement model was evaluated concerning its reliability (Nunnally, 1994), internal consistency, convergent validity, and discriminant validity (Hair, 1998; Kline, 2016), as described in the methodology section. Table 3 revealed that the construct reliability and international consistency were met because all the Cronbach’s Alpha and CR values were higher than the threshold of 0.70. Moreover, the convergent validity criteria were satisfied because the standardized loadings and AVEs were all above 0.70 and 0.50, respectively.
Convergent Validity.

Note. AVE = average variance extracted; CR = composite reliability; *** = significant at < 0.01.
Source. Data adapted from Authors (2020).
Next, we examined the measurement’s model discriminant validity using the Fornell and Larcker (1981) criterion and the HTMT approach (Henseler et al., 2015). Table 4 indicated that the examination of discriminant validity, using the Fornell and Larcker (1981) criterion for the latent variables, was partly satisfied. Many off-diagonal correlations were higher than the diagonal values (square root AVEs), implying the existence of discriminant validity due to cross-loadings among the associated latent variables. However, the Fornell and Larker criterion was criticized for lacking the ability to establish the distinctiveness between the latent variables in the considering measurement model (Henseler et al., 2015). It was reported that the HTMT approach demonstrated higher specificity and sensitivity rates (97%–99%) as compared to the Fornell–Lacker (20.82%). According to Table 4, the HTMT ratio approach suggested improved discriminant validity because the majority of the HTMT ratios were lower than 0.85 (Kline, 2016) or 0.90 (Gold et al., 2001). Yet, the first-order measurement model’s discriminant validity was not fully supported because only two pairs of the HTMT ratios were above 0.90 (0.933 for CL and CS; and 0.944 for CS and IS). As referred to the established questions in the questionnaire following the literature review, the researchers believed that CL and CS constructs and CS and IS were theoretically distinguished. Hence, we decided to retain the existing model and proceed to the next step.
Discriminant Validity.
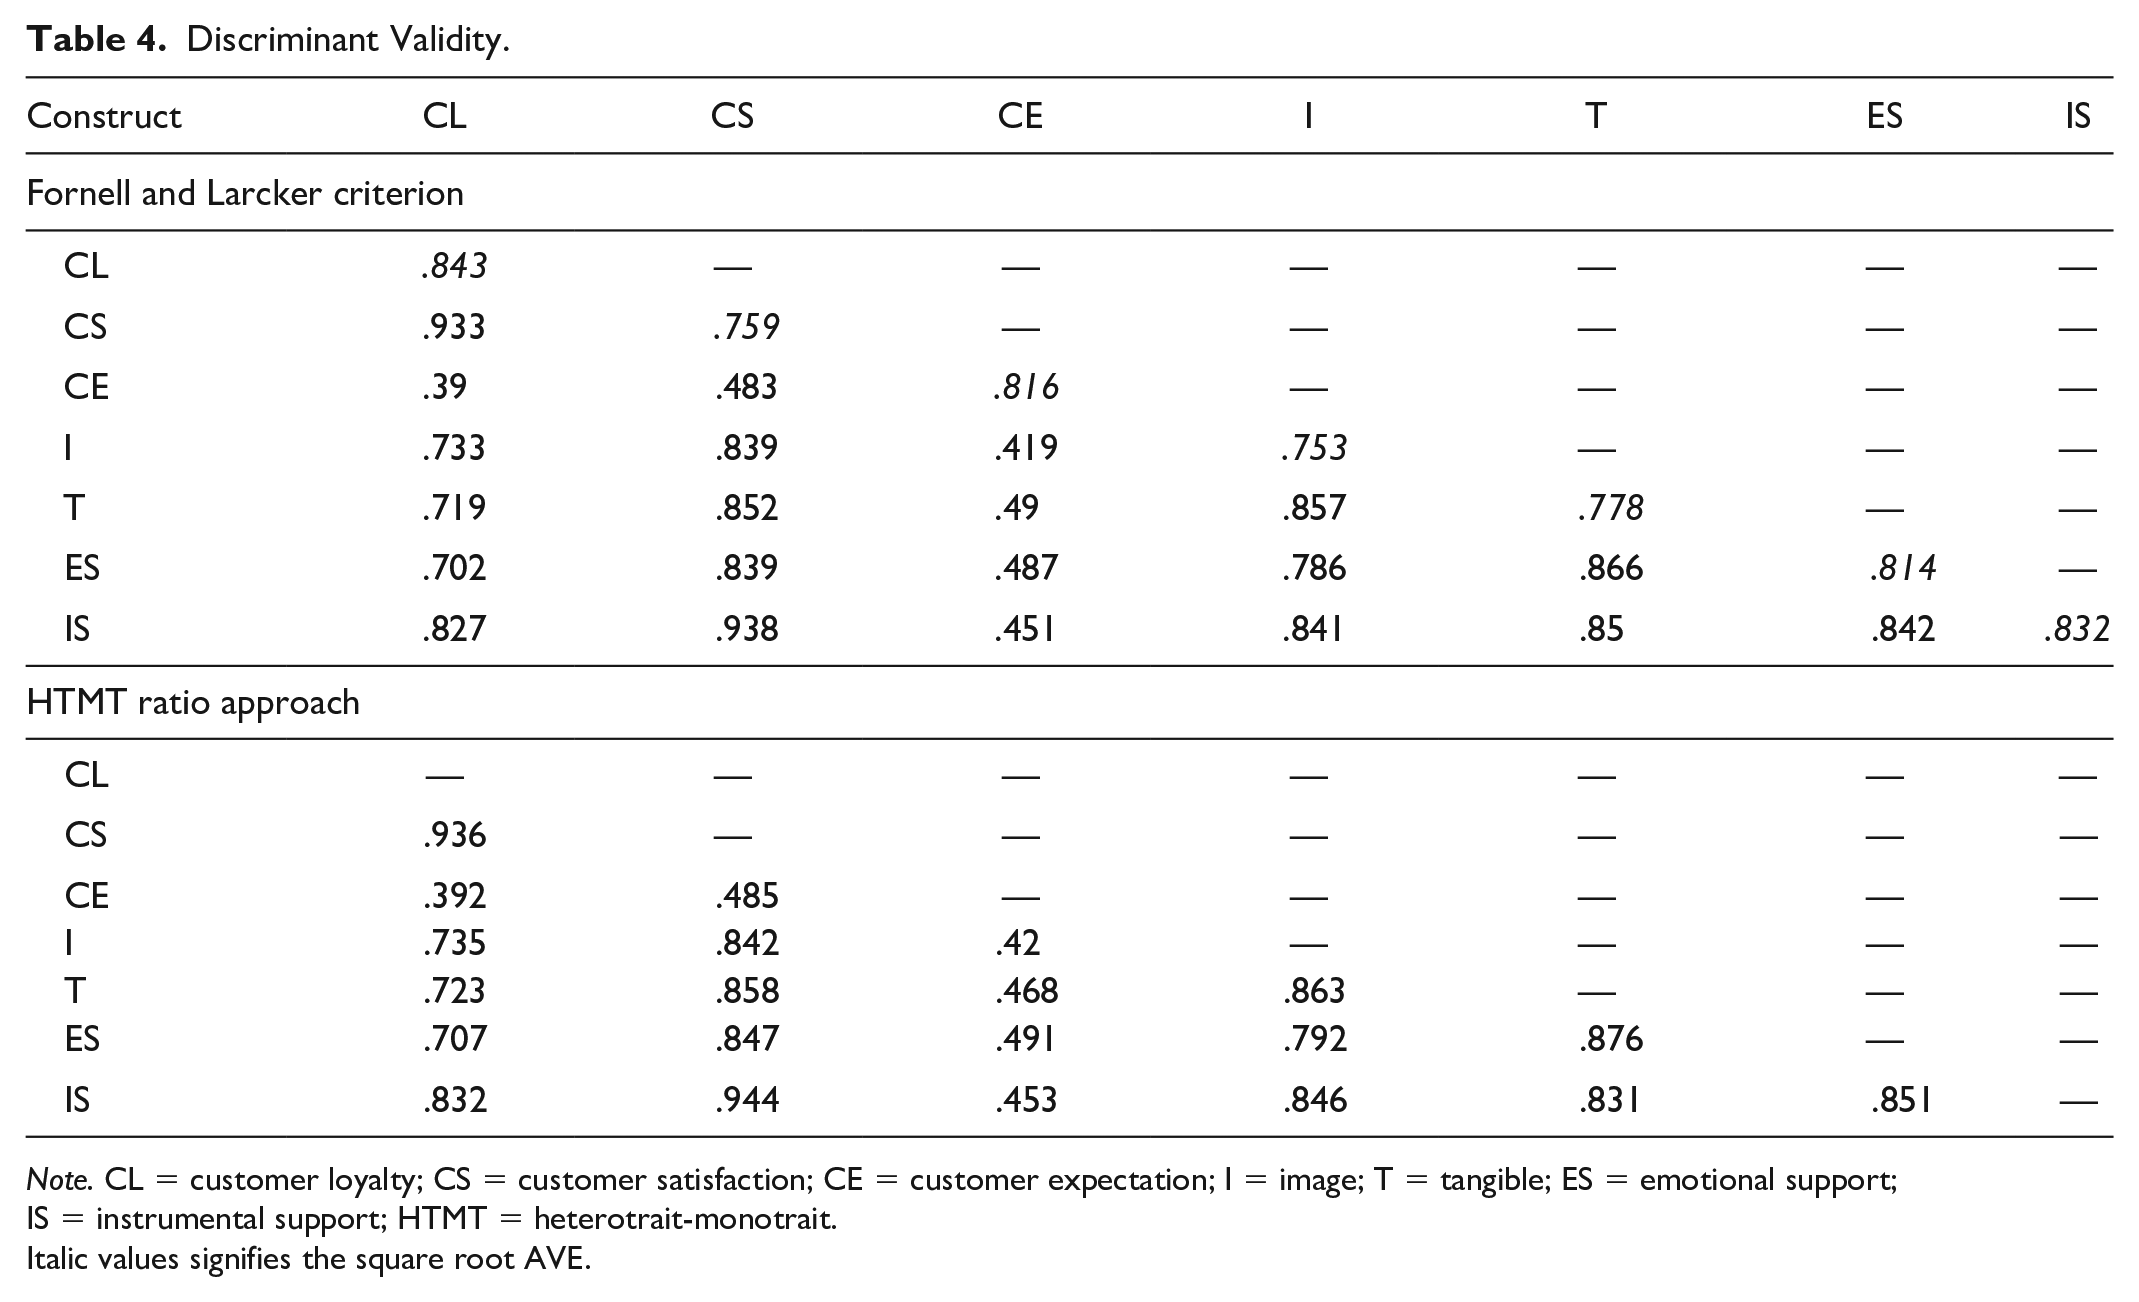
Note. CL = customer loyalty; CS = customer satisfaction; CE = customer expectation; I = image; T = tangible; ES = emotional support; IS = instrumental support; HTMT = heterotrait-monotrait.
Italic values signifies the square root AVE.
Finally, GOF was performed by comparing the model results with the fit index thresholds. Table 5 shows the GOF measurements and their thresholds. The results were satisfactory in that all the fit indices passed the suggested thresholds, CMIN/DF (2.404 < 3.00), TLI (0.903 > 0.90), CFI (0.919 > 0.90), IFI (0.920 > 0.90), and RMSEA (0.075 < 0.10).
Goodness of Fit of First-Order Measurement Model.
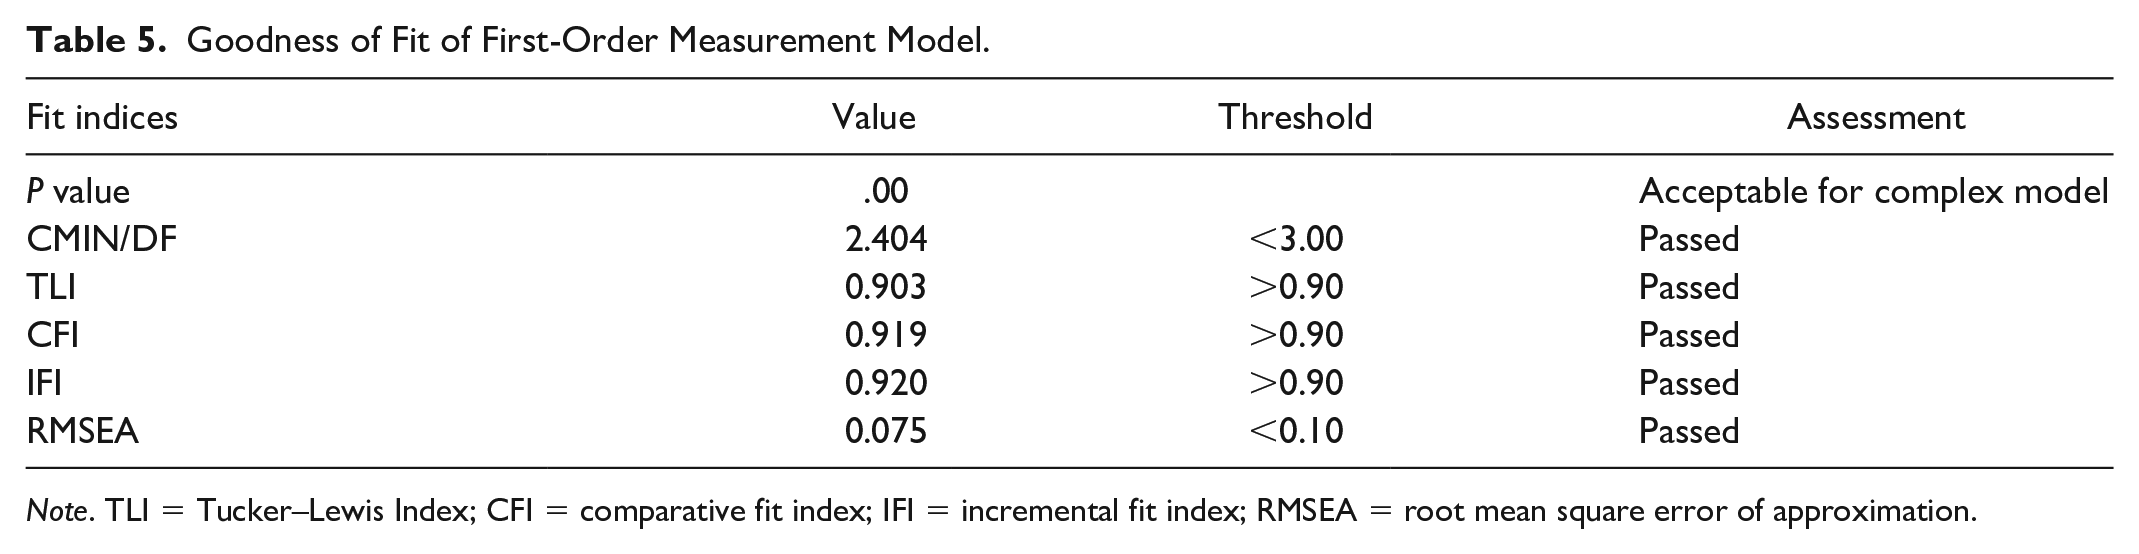
Note. TLI = Tucker–Lewis Index; CFI = comparative fit index; IFI = incremental fit index; RMSEA = root mean square error of approximation.
Second-Order Measurement Model Assessment
Table 6 demonstrated that the formative construct (Perceived Quality) and reflective constructs (Image, CE, CS, and CL) passed the validity criteria very well when comparing the calculated measures with their thresholds. The p values <.001 of all indicators (IS, ES, T, I1-3, CE1-3, CS1-4, and CL1-3) were statistically significant. Their standardized loadings were all above .50. In addition, all the AVEs and CRs were above the thresholds of 0.50 and 0.70, respectively. These findings implied that the convergent validity condition was met, suggesting that all the manifest variables belonged to their latent constructs, as described in the literature review.
International Consistency and Construct Reliability.
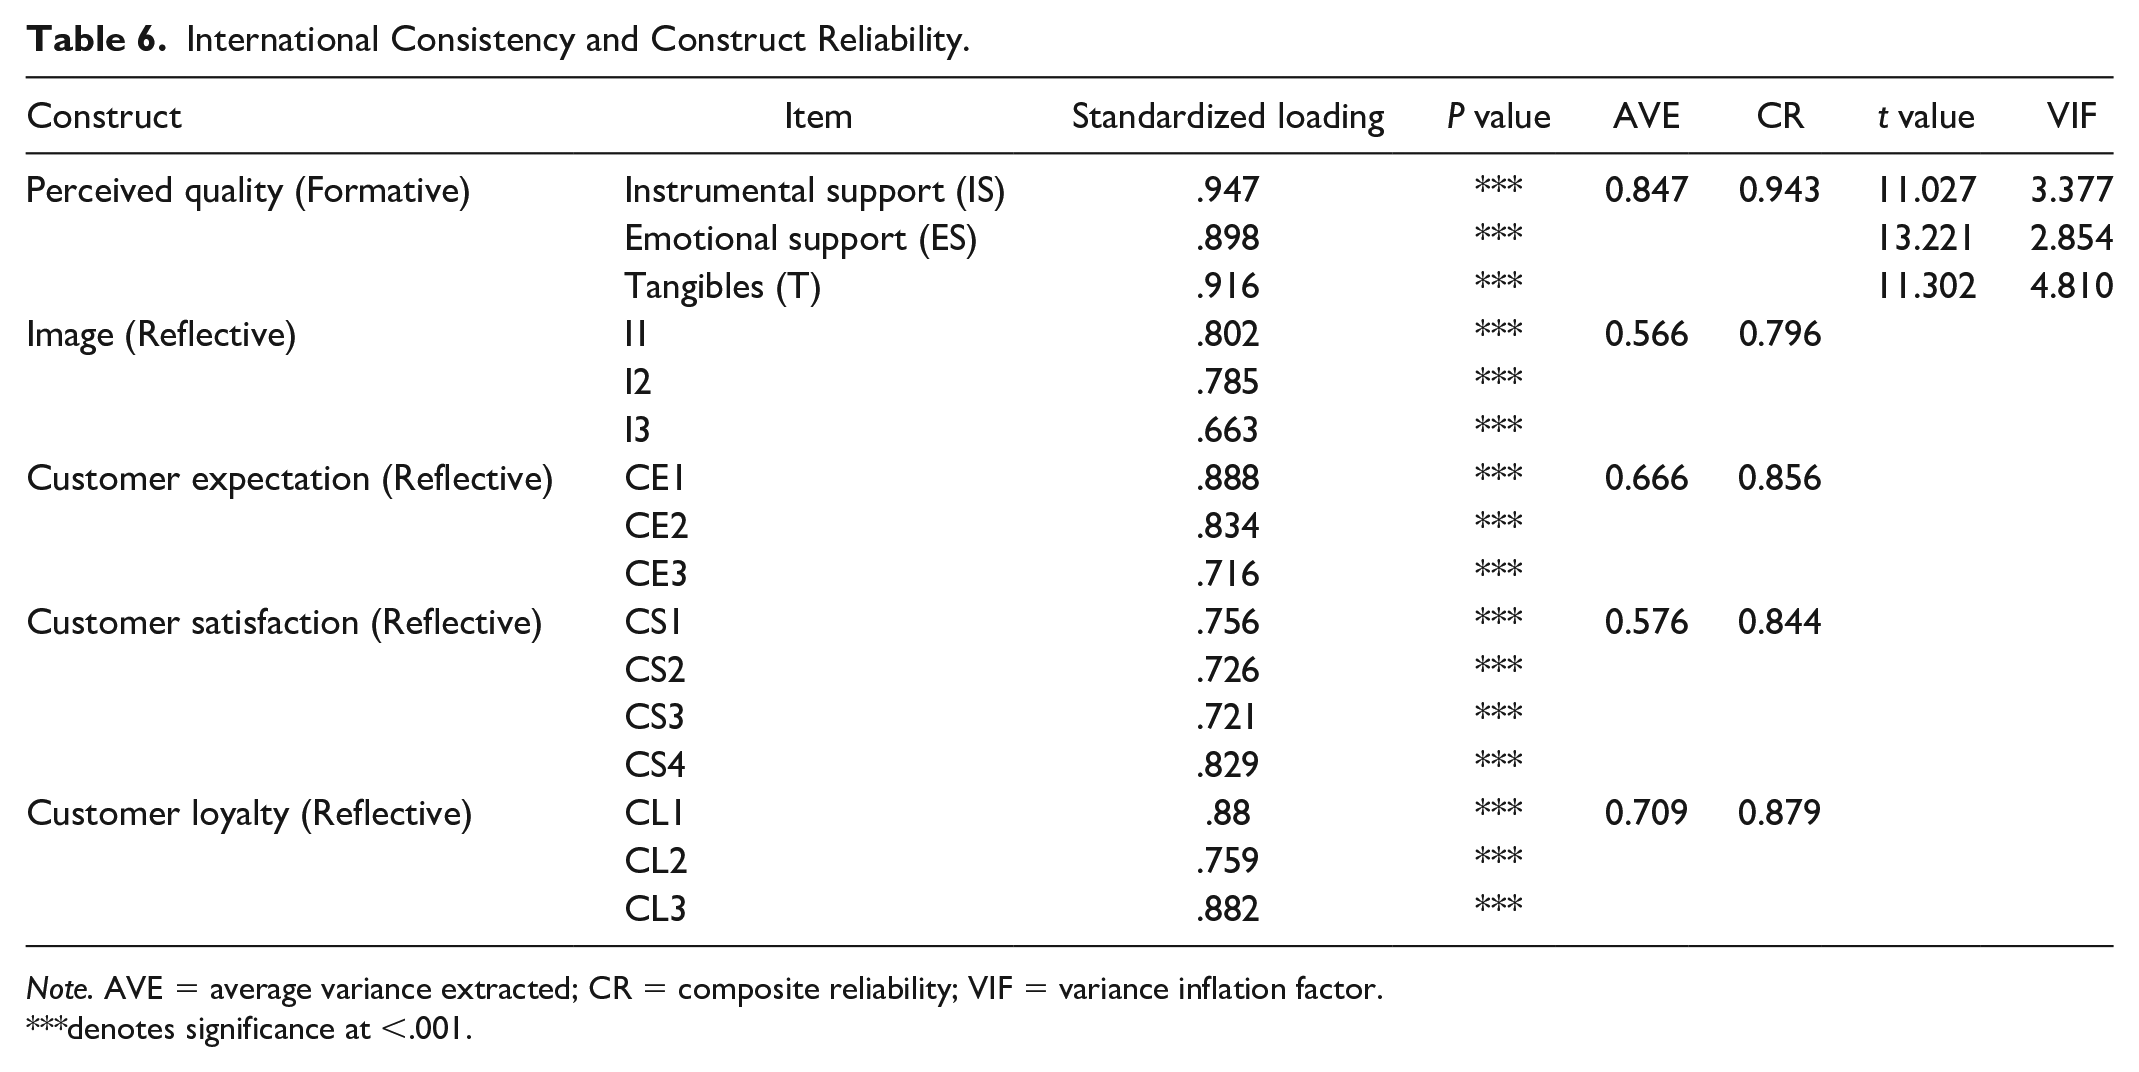
Note. AVE = average variance extracted; CR = composite reliability; VIF = variance inflation factor.
denotes significance at <.001.
In the second-order construct (the formative model of PQ), the calculated t values of the variable IS, ES, and T surpassed the critical values, given the degree of freedom of a one-tailed t-test for each variable (Peng & Lai, 2012). In addition, the VIF values were all lower than the threshold of 5.00, which implied the absence of multicollinearity issues among the formative variables. Hence, the second-order hypothesized relationships (Ha, Hb, and Hc) were supported. This finding implied that the hypothesis that perceived service quality in the health care businesses consists of these three subconstructs (IS, ES, and T) was very well supported.
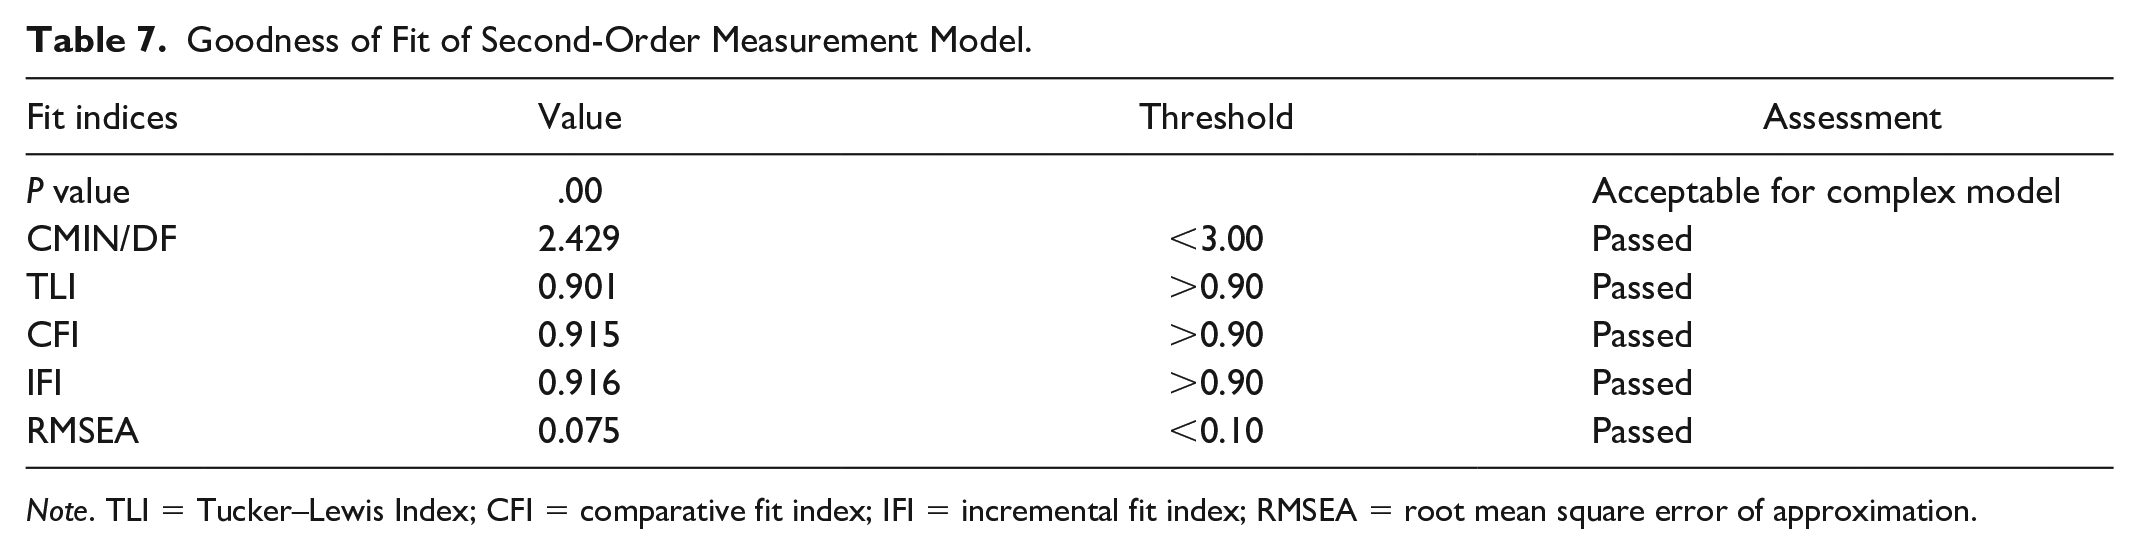
Moreover, the model fit was confirmed by the GOF indices. Table 7 illustrates the GOF measures and their thresholds. The results were adequate in that all of the measurement indices passed the suggested thresholds. CIM/DF of 2.429 < 3.00, TLI of 0.901 > 9.00, CFI of 0.915 > 9.00, and RMSEA of 0.070 < 0.10 passed the designated thresholds suggested by Hair (1998).
Goodness of Fit of Second-Order Measurement Model.
Note. TLI = Tucker–Lewis Index; CFI = comparative fit index; IFI = incremental fit index; RMSEA = root mean square error of approximation.

Structural model and hypothesis test results.
Structural Model Assessment
In this section, the structural model was analyzed using the GOF indices and the p values derived from the hypothesis test. Table 8 shows the GOF measurements and their thresholds. The results were unacceptable since the majority of the GOF indices (CMIN/DF, TLI, CFI, and IFI) did not pass the suggested thresholds, except for RMSEA (0.089).
GOF of the Structural Model.

Note. GOF = goodness of fit; TLI = Tucker–Lewis Index; CFI = comparative fit index; IFI = incremental fit index; RMSEA = root mean square error of approximation.
Source. Data adapted from Authors (2020).
According to Table 9 and Figure 4, the hypothesis test results demonstrated that all the established hypotheses were supported except for H3, which showed the relationship between CE and CS. At this stage, we decided to modify the model due to a highly insignificant statistical relationship between the CE and the CS construct (p value = .67) and the unacceptable GOF results. Therefore, H3 was omitted from the modified model. In addition, the modification index (MI) resulted from the AMOS software suggested that the Image construct should be directly associated with the PQ construct. This attempt was strongly supported by the MI of 89.652, with the par change of 0.520. The modified structural model is shown in Figure 5. In addition, the positive relationship between image and perceived service quality was supported by a study of Clow et al. (1997) and Zameer et al. (2015). However, regardless of health services provided at hospitals, this study only emphasized tax services, dental services, restaurants, video rental stores, and banking services.
Test Results From the Structural Model.

*** = significant at < 0.01.

Modified structural model.
Final Test Results and Mediating Analysis
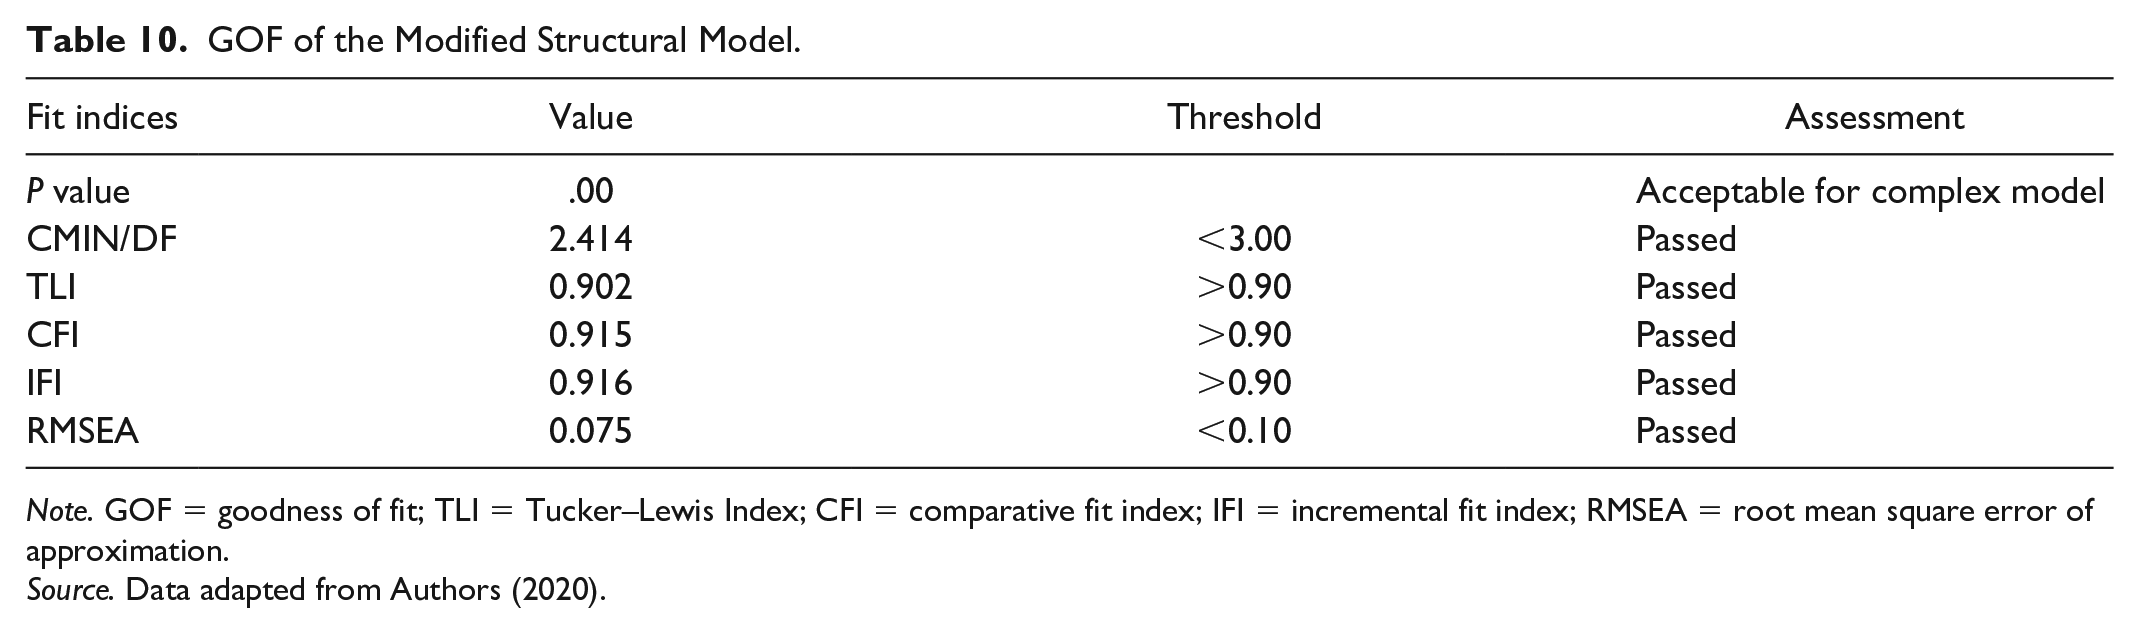
The final resulting structural model after omitting H3 and adding the modified relationship is presented (see Figure 5). According to Table 10, the modified model demonstrated the improved GOF indices in that CMIN/DF decreased from 2.971 to 2.417. RMSEA decreased from 0.089 to 0.075. CFI and IFI improved from failing to passing the threshold of 0.90. Explicitly, CFI increased from 0.881 to 0.915, with the same indication in which IFI escalated from 0.882 to 0.916. The improvement in the GOF indices indicated that the new structural model could better represent the modified structural relationships among the existing variables.
GOF of the Modified Structural Model.
Note. GOF = goodness of fit; TLI = Tucker–Lewis Index; CFI = comparative fit index; IFI = incremental fit index; RMSEA = root mean square error of approximation.
Source. Data adapted from Authors (2020).
According to Table 11, the test results from the modified structural model supported Ha, Hb, Hc, H1, H2, H4, and H5. Also, they suggested that the modified relationship (Image → Perceived Quality) was at the significance level of
Test Results From the Modified Structural Model.

*** = significant at < 0.01.
Discussion
This study expanded the results from the studies by Fornell et al. (1996), H.-Y. Hu et al. (2010), and Kotler (2000), which primarily emphasized that PQ was related to CS and would lead to future CL. However, the proposed model was validated and modified to fit with the health services context in Thailand. We narrated the discussion section as follows: (a) the associations among image, CE, and PQ; (b) PQ as the second-order construct; (c) the relationships among PQ, CS, and CL.
The theories suggested that both customer experience and brand image are individual and subjective experiences that can vary tremendously depending on the customers’ perceptions of the brand (Zeithaml et al., 2013). If the organization has a good image and customers trust its products or services, the customer will want to buy more or give more support. Each customer shapes his or her image and perception of the brand. The better the image or reputation that a brand possesses, the more customers expect to receive what they perceive in it (consistent with H1). Then, the accepted H2 confirmed the positive relationship between CE and PQ in health service businesses (Hudak et al., 2004). Thus, CS plays a mediating role between image and PQ in this context (H.-Y. Hu et al., 2010).
In the modified structural model, the arrow starts from the image construct then points to the PQ construct, indicating that these two constructs are positively related (Clow et al., 1997 and Zameer et al., 2015). Thus, there are two approaches to influence the perceived service quality: (a) from the image along with CE to PQ (indirect effect) and (b) from the image to PQ (direct effect). After comparing these two pathways (see Figure 5), the effect with CE as a mediator I → CE → PQ (0.421 × 0.157 = 0.066) was weaker than the direct effect I → PQ (0.819). This finding implies that the critical factor influencing customers’ PQ in the medical service industry is corporate or brand image, which can be enhanced by reputation, positive news, and possibly architecture (Clow et al., 1997).
Concerning the PQ construct, IS in Ha is the way to offer physical help when a customer comes into the health care center (Parasuraman et al., 1998). This process makes customers feel that doctors and staff members care about them; thus, this factor presented a strong loading of 0.949. The next support factor is emotional, as shown in Hb (Naruetharadhol & Ketkaew, 2018; Parasuraman et al., 1998). This factor is quite essential. It focuses on caring (individualized attention the community provides to residents) and shows the dimensions of empathy and compassion for another person (Parasuraman et al., 1998). Its loading was estimated at 0.899. The construct of T in Hc strongly supported the PQ construct because Ts are the parameters that patients or customers can touch or feel (Parasuraman et al., 1998): for instance, the areas around the health care center, doors that are wide enough to permit entering or exiting, and tools or equipment that are good and clean and ready to use. Ts are the first step in making a good impression for the customer who comes for service at the health care center, which passed the estimate (0.917).
The review of literature claims that exceeding CEs lead to higher CS, but our results did not support this theory. So, the researchers eliminated H3. In the health service industry, this model suggested and confirmed that PQ created by experience through the utilization of quality health services is a prerequisite of CS.
In summary, PQ is the most fundamental approach to improve CS and loyalty. A good image will increase the customer perception of the medical services and will result in customer trust in the services. Hence, customers will be more worthy of the services and make it possible to receive mental value without knowing whether the product can meet their expectations or not. When companies in the health service industry can make the customer feel satisfied with their services, the customer will have a good feeling with the services, and a good relationship between the customer and the organization will then be formed. This relationship leads to CL toward the company. CL is essential for helping a company expand. This factor positively affects a company because it shows that the company or organization has quality products and high standards, which can help lead to and bring about an increase in the number of future customers.
Conclusion
Due to economic, social, political, and cultural variables, modern society has changed a lot from the past. Health care demands have also been adapted so that there are more opportunities to run the health care business, causing a fiercely competitive environment today. As such, this research aims to study the significant relationships among factors influencing CS and loyalty in the health care service industry. The results prove the hypothesized relationship in the research framework by employing the SEM approach. This study established eight hypotheses, as previously described. Based on the quota and purposive or judgmental sampling approach, the researchers conducted the quantitative research based on a structured questionnaire through a face-to-face interview with 252 valid respondents using health care services in Muang Khon Kaen, Thailand. The SEM model generated the four reflective constructs (image, CE, CS, and CL) and one formative construct (PQ as a second-order construct) consisting of IS, ES, and T as subconstructs. Most of the hypothesis test results supported the previously established hypotheses, except H3, which could infer that patient satisfaction was not related to their expectations without experiencing quality services offered by the health service businesses. Furthermore, the researchers found that image can also affect PQ, which could indicate that an image can help build the PQ of customers directly regardless of the mediating role of CE.
Research Implications
The research findings proposed recommendations to two main stakeholders, including managers at the corporate level and policymakers at the national level in Thailand. As shown in Figure 5, the test result of the modified structural model, in which PQ is a second-order construct, is the critical factor that has a direct impact on CS and loyalty. In other words, it shows that image is the key to enhancing the PQ in the health care business. A health service business may improve its image by improving its reputation, exposing to news and media, and updating its architecture and design. Next, there are three main components regarding the PQ, namely, IS, ES, and T. The development of high-quality service may involve several means, such as delivering professional services, following the feedback or complaints of patients, effective service encounters, customer relationship management, and building employees a positive attitude. As a result, improving the customer’s PQ may result in increased satisfaction. The positive impact on CS will bring about higher levels of CL, repurchase, and recommended intention then lead to higher future revenues in the health care business. For management/corporate considerations, the research provides an essential measure of the health service industry performance. Higher CS should increase loyalty. Satisfying consumers in making purchase decisions and making repeat purchases in addition to being loyal to the service should result in steady long-term profits.
For public policymakers, this research has the potential to be a useful tool for assessing and enhancing the health service policy of Thailand, both in terms of national competitiveness and citizen welfare, as the northeast of Thailand has set the goal to become the regional medical hub. Public policymakers must realize and place importance on physical needs as well as instrumental and ESs to develop the quality of services in the health care industry. The service setting can affect customer perceptions of service quality in several ways. Management has to ensure continuous improvement in its physical surroundings and safety and should try to create a culture that emphasizes the service mind. This type of development should further increase levels of social engagement through social networks among the patients and staff in a medical center.
Limitations and Future Research
Although this study provides significant contributions to academia and business practices, a few limitations remain. Since the questionnaire was only sampled from people in Khon Kaen City, the research results may not cover sample groups in the surrounding areas and its neighboring provinces. The sample size is not large but was sufficient for the type of analysis undertaken. Nevertheless, this work provides future research with an opportunity to explore the proposed health service business model using another sample in other locations within Thailand and internationally. This model could be explored in a deeper dimension, for instance, a moderating effect to test the behavioral differences between various customer segments.
Footnotes
Appendix A
Appendix B
Total Variance Explained.
| Component | Initial eigenvalues | Extraction sums of squared loadings | ||||
|---|---|---|---|---|---|---|
| Total | % of variance | Cumulative % | Total | % of variance | Cumulative % | |
| 1 | 17.424 | 49.782 | 49.782 | 17.424 | 49.782 | 49.782 |
| 2 | 2.273 | 6.495 | 56.278 | |||
| 3 | 1.608 | 4.595 | 60.872 | |||
| 4 | 1.333 | 3.809 | 64.681 | |||
| 5 | 1.189 | 3.398 | 68.080 | |||
| 6 | 0.974 | 2.783 | 70.863 | |||
| 7 | 0.854 | 2.441 | 73.304 | |||
| 8 | 0.787 | 2.249 | 75.553 | |||
| 9 | 0.706 | 2.017 | 77.569 | |||
| 10 | 0.670 | 1.915 | 79.485 | |||
| 11 | 0.599 | 1.713 | 81.197 | |||
| 12 | 0.516 | 1.473 | 82.670 | |||
| 13 | 0.494 | 1.412 | 84.082 | |||
| 14 | 0.437 | 1.249 | 85.331 | |||
| 15 | 0.408 | 1.166 | 86.497 | |||
| 16 | 0.393 | 1.122 | 87.619 | |||
| 17 | 0.367 | 1.050 | 88.669 | |||
| 18 | 0.342 | 0.976 | 89.645 | |||
| 19 | 0.323 | 0.924 | 90.569 | |||
| 20 | 0.303 | 0.867 | 91.436 | |||
| 21 | 0.295 | 0.844 | 92.280 | |||
| 22 | 0.275 | 0.785 | 93.065 | |||
| 23 | 0.269 | 0.770 | 93.834 | |||
| 24 | 0.245 | 0.701 | 94.535 | |||
| 25 | 0.232 | 0.662 | 95.196 | |||
| 26 | 0.210 | 0.599 | 95.795 | |||
| 27 | 0.201 | 0.574 | 96.369 | |||
| 28 | 0.192 | 0.550 | 96.919 | |||
| 29 | 0.189 | 0.539 | 97.457 | |||
| 30 | 0.185 | 0.528 | 97.986 | |||
| 31 | 0.167 | 0.476 | 98.462 | |||
| 32 | 0.153 | 0.438 | 98.900 | |||
| 33 | 0.148 | 0.424 | 99.323 | |||
| 34 | 0.126 | 0.361 | 99.685 | |||
| 35 | 0.110 | 0.315 | 100.000 | |||
Acknowledgements
The authors have undertaken much effort in this project. However, it would not have been possible without the kind support and help of many individuals and organizations. They would like to extend sincere thanks to all of them. They would like to express their gratitude to the doctors and staff of Khon Kaen University Community Outreach Center for their cooperation and encouragement, which helped complete data collection. Their appreciations also go to Mahidol University International College and Khon Kaen University International College for providing research facilities.
Declaration of Conflicting Interests
The author(s) declared no potential conflicts of interest with respect to the research, authorship, and/or publication of this article.
Funding
The author(s) received no financial support for the research, authorship, and/or publication of this article.