
Abstract
Facing immense competition, retailers across the globe are experiencing reduction in their customer loyalty. This decreasing trend is even more observable in the superstore retailing in Bangladesh; especially whose target market is young cohort (Generation Y [Gen Y]). As a result, it is vital for the superstore owners to ascertain the factors affecting the customer loyalty of Gen Y. The main purpose of this study is to investigate the influence of service quality and corporate image on customer loyalty of Gen Y in the retail superstores of Bangladesh. A total of 325 Gen Y shoppers were surveyed from four leading superstores in Bangladesh using a structured questionnaire. Smart-PLS 3.0 software was used to validate the collected data and test the statistical significance of the path relationships by following structural equation modeling. The results indicate that Gen Y customers’ loyalty toward the superstores is positively and significantly influenced by both service quality and corporate image. The outputs also reveal that service quality indirectly affects Gen Y customer loyalty toward superstores with an intervening role of corporate image. Research implications from theoretical and practical standpoints as well as the recommendations for forthcoming study are also provided.
Introduction
With the presence of intense rivals, nowadays, retailers are struggling to ensure the loyalty of their customers (Hegner-Kakar et al., 2018). The reduction rate of loyal customers is proportionately high especially in the retail industry compared with other service sectors of the economy (Ngobo, 2017). Majority of the retailers have identified the issue of customer retention as the most important encounter that they face (Kamran-Disfani et al., 2017). This battle is even more severe in the retail sector of developing countries (Grosso et al., 2018), such as Bangladesh (Alam, 2018). Thus, retailers are losing their existing customers and this decreasing trend is more intensive among those who are dealing with Generation Y (Gen Y) customers as they possess unique characteristic—tendency to attach less with products/retailers (Quintal et al., 2016). Thus, as a consequence, it is vital for the retailers to differentiate themselves from rivals (Konuk, 2018). As an important differentiation tool, ensuring and rendering service quality at their high end is considered essential in creating competitive edge for service organizations, in general (Prakash, 2019; Roy et al., 2019; Shemwell et al., 1998) and for retailers, in particular (Jain & Aggarwal, 2018; Prentice et al., 2018; Sarker & Ashrafi, 2018). Thus, higher level of service quality might ensure the cutting edge of competition which in turn leads to customer attachment toward the retailers. Moreover, in the emerging economies, there is dearth of knowledge concerning the structural association between retail store service quality and customer loyalty (Nguyen et al., 2016) and such limitation is more prevailing in the superstore sector in Bangladesh (Islam et al., 2016).
As narrated by Baumann et al. (2017), it is inevitable to explore a new construct as an intervening variable in the service quality and customer loyalty link as customer satisfaction has become stagnant in such link in terms of influencing strength. The American Marketing Association (2019) defined store image from two distinctive perspectives—one is from retailing view point represented by store attributes in the name of “store image” and other is from holistic view point represented by the overall impression of customers toward the store in the name of “corporate image” (CI). The distinction of the image construct in retailing lies in the ultimate discrepancies of focus given. The construct “store image” is used if the focus is on the major attributes of the store, whereas, the construct “corporate image” is utilized if the focus is on the retail corporation as a whole (Lin & He, 2017). In the context of retailing, it is evident in the literature that store image (from store attributes perspective) has long been used as an antecedent of service quality (see Bao et al., 2011; Konuk, 2018). Whereas, in different research settings, the construct “corporate image” has appeared as a consequence of service quality (Coutinho et al., 2019; Darmawan et al., 2018; Giovanis & Tsoukatos, 2017; Hassan et al., 2019). But in the platform of retailing, study addressing the CI construct (from holistic viewpoint) as an outcome variable of service quality is still scant (Nesset et al., 2011). Hence, to address this gap in the retailing literature, this study considers image of the superstore retailers from holistic viewpoint and initiates to investigate the intervening role of CI in the path association between service quality and Gen Y customer loyalty.
The significance of this study has many dimensions. First, in the retailing perspective, image is typically perceived through the lens of “store attributes,” but this study viewed image from holistic sense and used as a mediating variable in the link between service quality and customer loyalty. Second, this study focuses on the loyalty behavior of Gen Y toward superstore retailing which is a rare one from Bangladesh perspective. Finally, by investigating the influence of retail store service quality on Gen Y customer loyalty with the intervention of CI aligned with stimulus–organism–response (S-O-R) paradigm is a rare one.
Literature Review
The S-O-R Model
The S-O-R paradigm was developed by Mehrabian and Russell (1974) and appeared as a widely used guiding framework in the field of consumer behavior (Chang et al., 2011; Choi & Kandampully, 2019; Goi et al., 2018). In the S-O-R framework, stimulus (S) is a variable that affects the inner state of consumers, known as organism (O), which in turn elicits the behavioral responses (R). This S-O-R paradigm is also widely recognized and used as input (S)–process (O)–output (R) framework (Kim et al., 2020). Initially, the S-O-R framework was developed to address the influence of store attributes on consumer behavior and later on modified by Sherman et al. (1997) to cope up with the retail setup by incorporating variables that lead to purchase decision of consumers (Chang et al., 2015). The proposed study framework is theoretically supported by the S-O-R paradigm where service quality acts as S, CI as O, and customer loyalty as the ultimate R of customers.
In the original S-O-R framework of consumer behavior (Mehrabian & Russell, 1974), a stimulus represents any environmental cue that triggers the emotional reactions of individuals toward that environment. Literature indicates that service quality attributes are considered as the elements of environmental cues (Alsaggaf & Althonayan, 2018; Um & Lau, 2018), and hence the attributes of retail store service quality. For instance, Alsaggaf and Althonayan (2018) used five dimensions of SERVQUAL model as environmental stimuli to predict electronic word of mouth and switching intentions (as responses) through pleasure, arousal, and attitude (organism). In the similar fashion, Famiyeh et al. (2018) also considered and tested the service quality dimensions as environmental stimuli to justify the relationship with customer loyalty (response). According to S-O-R paradigm, an organism is a psychological state that acts as a mediating link between the environmental stimuli and the individual responses (Chang et al., 2015). As perceived image has both functional and emotional aspects (Lee et al., 2010) and we conceptualized image of the store from consumer behavioral (psychological/emotional) perspective, considering image as an organism (emotional state) is justifiable. Moreover, several previous studies also confirmed the role of image as an organism in the S-O-R paradigm along with different set of stimuli and responses (such as Faryabi et al., 2012; Huang et al., 2015; Kim et al., 2009; Nunthiphatprueksa, 2017; Park & Lennon, 2009; Rohman, 2019; Sherman & Smith, 1987). For instance, Huang et al. (2015) verified the role of CI as an organism in the relationship between consumer attitudes toward green marketing and purchase intention. Finally, as an output (response), customer loyalty has appeared in various scholarly papers (Famiyeh et al., 2018; Wu & Li, 2018). Thus, it is expected that being exposed to various aspects of superstore quality, customers will form a positive emotional feeling toward the retail store image which in turn will drive them to stay with the store.
Gen Y
Generational Cohort Theory, introduced by Inglehart (1977), has become a dominant customer segmentation tool as individuals belong to a specific cohort that exhibits similar values, preferences, and experiences (Ladhari et al., 2019; Parment, 2013). Among the five generational cohorts identified in the literature, this study concentrates on Gen Y. In the literature, there is still lack of unified consensus among the scholars on the starting and ending period of Gen Y cohort. One group of scholars identify Gen Y as individuals born after 1980 (Khera & Malik, 2017; Lub et al., 2012; Messarra et al., 2016; Ordun, 2015), while another group of researchers refer the late 1970s as the starting point (Dalla Pozza et al., 2017; Quintal et al., 2016; Reis et al., 2016; San et al., 2015). However, such variation in the timeline is acceptable due to the dissimilarities that prevail among countries and cultures (Soares et al., 2017). For this study, individuals who were born within the year 1977 and 1994 are defined as the members of Gen Y cohort recommended by recent scholars (e.g., Cham et al., 2018; Chen & Chou, 2019; Dalla Pozza et al., 2017; Husnain et al., 2019; Quintal et al., 2016; Tangsupwattana & Liu, 2017). Historically, Gen Y members are considered as the most vibrant generation and economically an active market segment (Tudorache et al., 2019). Having a high disposable income and greater discretionary spending capacity (Chen & Chou, 2019; Gardiner et al., 2014), this cohort has become a focal segment for marketers in general (Bilgihan, 2016) and retailers in particular (Altinbasak-Farina & Guleryuz-Turkel, 2015). They are rigorously fascinated to brands and are ready to pay extra for having their desired one (Chen & Chou, 2019). Thus, perceived image of a brand (like store) is very crucial for the members of this cohort. They have the courage to accept new marketing offers and hence, act as innovators in the new offer adoption process (Ladhari et al., 2019). As they are always connected through social network (Bento et al., 2018), Gen Yers have become sophisticated shoppers (Eastman & Liu, 2012). Compared with their previous generations, the members of Gen Y cohort are more conscious about style and quality and less sensitive to price of a product (Fyall et al., 2017).
Customer Loyalty
Customers who do exhibit loyalty have the tendency to spread positive word-of-mouth and enhance the referrals (Bowen & Shoemaker, 1998; Eryandra et al., 2018; Lai, 2019). As a result, a loyal customer has become a vital asset for any organization (Petzer & van Tonder, 2019; Shankar & Jebarajakirthy, 2019) and has become a focal management issue (Rokonuzzaman et al., 2020). Although a plethora of study on customer loyalty has been carried out in the domain of marketing scholarship (Makanyeza & Chikazhe, 2017), still disagreements prevail among the scholars on how to operationalize this concept (Ali et al., 2016; Ngobo, 2017). Oliver (1999) conceptualized loyalty as “a deeply held commitment to rebuy or repatronize a preferred product or service consistently in the future, thereby causing repetitive same-brand or same brand-set purchasing, despite situational influences and marketing efforts having the potential to cause switching behavior” (p. 34). Critics argued that this definition of loyalty is not widely acceptable due to its behavioral focus. From the behavioral standpoint, customer loyalty can be seen as an actual choice behavior (Carrel & Li, 2019) focusing on frequency of usage or repetition of purchase (Neal, 1999). From the attitudinal perspective, on the contrary, loyalty is termed as conative loyalty or loyalty intention (Almeida-Santana & Moreno-Gil, 2018) which can be understood as a customer’s unfathomable emotional commitment to purchase a particular product and/or service (Cong, 2016). As defining loyalty solely from either attitudinal or behavioral perspective is not enough to gauge the true picture of loyalty (Suhartanto et al., 2020), it is imperative to address both the facets of loyalty (Bapat, 2017). Even this assimilation is more essential for retailing due to distinctive characteristics attached to it (Sivapalan & Jebarajakirthy, 2017). As this study focuses on the loyalty of Gen Y customers toward superstore, for better conceptualization, the loyalty construct encompasses the composite approach covering both attitudinal and behavioral aspects.
Corporate Image (CI)
CI has become a vital issue for both academicians and practitioners as it plays a significant role in the choice narrowing process of customers at the time of purchase (Horng et al., 2018). Being an intangible asset, CI of a firm is quite difficult to emulate by the rivals, and as a consequence affects the overall perception of the customers about the firm (Kant et al., 2017). As the domain of CI is very broad, a unique definition of this construct accepted by the scholars is still absent (Lee, 2019). As defined by some scholars (such as Abratt & Mofokeng, 2001; Barich & Kotler, 1991; Dichter, 1985; Lee & Lee, 2018; Park et al., 2011), CI is the public’s perception of overall impression that an organization holds. Whereas, some others (Dutton & Dukerich, 1991; Gürlek et al., 2017) viewed CI as the concrete outcome of a company’s various stakeholders’ emotions, opinions, interactions, and impressions regarding an organization. As the customers are external stakeholders and vital for any corporation (Mostafa et al., 2015), creating positive impression among them toward the corporation can ensure the competitive advantage of such corporation (Gürlek et al., 2017; Leonidou et al., 2013). In the context of retailing, image can be seen from two perspectives—one from consumer behavior and another from store attributes (American Marketing Association, 2019).
Image from store attributes perspective
From this aspect, image of the store is perceived from a standpoint of store attributes in terms of physical characteristics, psychological attributes, and retailing mix (Nesset et al., 2011). This conception of image focuses more on functional factors of the store with respect to both tangible and intangible elements that can be compared easily with rivals (Martineau, 1958; Moliner-Velázquez et al., 2019). Literature indicates that this view of store image usually precedes the service evaluation variables (service quality, customer satisfaction, and customer value) as appeared in several scholarly works (e.g., Bao et al., 2011; Beneke et al., 2015; Calvo Porral & Lévy-Mangin, 2015; Konuk, 2018; Moliner-Velázquez et al., 2019).
Image from consumer behavior perspective
Retailer image from the standpoint of consumer behavior encompasses the holistic view of the customers in terms of emotions, feelings, and experiences toward the retail outlet (Brunner et al., 2008) and this view is considered for this study. This conception of store image encompasses psychological issues appealing to the personality of consumers that deduce the sense of belongingness to the store through their feelings (Burlison & Oe, 2018; Lindquist, 1974). In the other context like banking sector, this format of image is termed as CI. In this connection, CI refers to the totality of the impression or perception of the customers as a major stakeholder which incorporates both real facts as well as inferences (Johnson & Zinkhan, 2015). Like the chain (branch) banking, superstores are managing their businesses through different branches under the same corporate name. Hence, this study conceptualized image of the store from a holistic point of view in the name of CI and this conception is evident in the study of Ko et al. (2013).
Service Quality
Growing demand for the presence of higher quality services in an organization has become the vital trend among the consumers (Chen et al., 2019; Osakwe, 2019). Quality services are essential to differentiate the organization and gain competitive advantage (Mahmoud et al., 2019). Although the issue of service quality is quite prominent in various sectors of service economy, this issue is more important in retailing industry due to the presence of strong rivals (Bhat, 2016; Hsiao, 2018). Thus, ensuring the delivery of quality services at the higher end is considered by the retailers as one of the essential and vital strategic issues (Ihtiyar & Ahmad, 2015). Despite the increasing interest among the academicians and practitioners, a consensus on the conceptualization and operationalization of service quality is still scant as different scholars defined this construct with diverse characteristics clubbing into numerous dimensions (Lopes et al., 2019). It is evident from the service quality literature that the most cited information came from the work of Parasuraman et al. (1985) in the name of SERVQUAL model. But due to some unique features attached to the retailing context (combination of physical goods and intangible services rather than pure services alone; Dick & Basu, 1994; Kajenthiran, 2018), the SERVQUAL model is not considered as a suitable instrument to encompass the quality aspects in this sector. Based on a vacuum present in the literature to operationalize retail store service quality more appropriately, Dabholkar et al. (1996) introduced a new instrument which is multidimensional and hierarchical in nature, namely Retail Service Quality Scale (RSQS). This instrument comprises of five basic dimensions—such as physical aspect (store design in terms of physical appearance and convenience), reliability (ensure delivery as promised and doing things right the first time), problem solving (ability of the store staff to manage customers’ problems, complaints, returns, and exchanges), policy (a bunch of guiding principles with respect to product quality, credit card facilities, parking facilities, and convenient operating hours), and personal interaction (courteous, helpful skills of store personnel, and the capacity of them to instill trust and confidence among shoppers) (Dabholkar et al., 1996). Aligned with numerous scholars (such as Bhat, 2016; Jain & Aggarwal, 2016; Yeap Ai Leen & Ramayah, 2011), this study applied the RSQS instrument for appraising the superstores’ service quality.
Theoretical Model and Hypotheses Development
Service Quality and Customer Loyalty
In a handful number of service settings, the effect of service quality on customer loyalty has extensively been examined (Kiran & Diljit, 2017) and appeared as a positive link (Bloemer & Kasper, 1995) explaining that the better the service quality provided, the more the loyalty of customers is expected (Mukerjee, 2018; Zeithaml et al., 1996). In the B2B context, Gandhi et al. (2019) conducted a study and found that organizational service quality (OSQ) leads to a better distributor service quality (DSQ) that ensures the satisfaction and loyalty of the organization toward the distributor. Subrahmanyam (2017) empirically examined a research model in the higher education setup and found that students’ loyalty is affirmatively and significantly determined by students’ perception of quality services. Numerous scholars also investigated the affirmative link of service quality with customer loyalty in various service settings and confirmed this link as statistically significant (Boonlertvanich, 2019; Iqbal et al., 2018; Liu et al., 2017; Parawansa, 2018; Prentice & Kadan, 2019). In the context of retailing, numerous studies also established the significant role of service quality in determining the long-term attachment of customers toward the stores (Das, 2014; Sheikh & Lim, 2015). In the same vein, more recently, Konuk (2018) investigated the influence of perceived quality on purchase intention of customer for organic private level food and found the relationship as positive and significant. Moreover, the loyalty behavior of Gen Y toward shopping mall is significantly determined by the service quality of the mall (Haj-Salem et al., 2016). Hence, we stipulate the hypothesis as follows:
Service Quality and CI
In their study, Lai et al. (2009) asserted that customers tend to evaluate the image of an organization more favorably given that they are experienced with better service quality. It is also explained by numerous scholars that formation of an organization’s overall image is the result of customers’ accumulated perception about service quality derived from recurrent service experiences (Lai et al., 2009; Nguyen & LeBlanc, 1998). In the setup of quick service restaurant industry, Wu (2013) conducted a study to examine the linear association between service quality and CI along with other variables in a complex model and concluded that service quality has a positive and significant explanatory power over CI. In different contexts, various scholars also confirmed the positive and meaningful impact of perceived service quality on favorable assessment of CI (Geraldine & David, 2013; Hapsari et al., 2017; Kandampully et al., 2011; Liat et al., 2014; Nguyen & LeBlanc, 2001; Wu et al., 2015). Therefore, the following hypothesis is offered:
CI and Customer Loyalty
As the attitude of customers toward the organization is the function of CI (Gürlek et al., 2017), organizations, such as retailers, with better CI are basically preferred by the customers (Bloemer & De Ruyter, 1998; Nguyen & LeBlanc, 2001). Existing literature indicates that better image of a company positively effects customer retention (Andreassen & Lindestad, 1998; Lee & Lee, 2018; Nguyen & LeBlanc, 2001; Richard & Zhang, 2012; Xhema et al., 2018). It is argued by Kevork and Vrechopoulos (2009) that customer behavioral intention (loyalty) can be increased as a result of identification as well as customers’ psychological support, whereas confirmation of both can be accelerated by a compact CI (Ryu et al., 2012; Wang, 2020). Thus, we offer the following hypothesis:
CI as a Mediator
In their study, Wu et al. (2015) investigated the influence of service quality on CI and subsequently on customers’ revisit intention. The study revealed that in both cases (influence of service quality on CI and CI on revisit intention), the path analyses appeared as positive and significant. Liat et al. (2014) also found CI as a mediating variable in the service quality and customer loyalty link. Similarly, other scholars also investigated the indirect influence of service quality on customer loyalty via CI and found significant effects (Cheng & Rashid, 2015; Giovanis et al., 2014; Hu et al., 2009). Thus, we posit the hypothesis as follows:
The Proposed Theoretical Model
Figure 1 illustrates the proposed theoretical model of the study. Based on a theoretical ground of S-O-R paradigm, the model encompasses the influence of service quality and CI on customer loyalty along with the intervening role of CI in the link between service quality and customer loyalty.

Conceptual model.
Method
Measures
The measurement items of all the constructs of the study were taken from the existing literature with minor revisions. To gauge customer loyalty toward superstores, Chang and Yeh (2017) proposed a scale comprising six items covering both attitudinal and behavioral aspects. CI was measured based on a three-item scale proposed by Nguyen and LeBlanc (2001). Finally, the construct service quality was operationalized based on the five-dimensional RSQS instrument developed and proposed by Dabholkar et al. (1996). Although the original RSQS instrument comprises of total 28 items clubbing into five primary factors, for the final questionnaire of this study, four items were discarded due to contextual differences as recommended by Deb and Lomo-David (2014) and Meng et al. (2009). As a consequence, five items for physical aspect dimension, three for problem solving, five for reliability, three for policy, and eight for personal interaction were finally retained for the scale (see Appendix A). In this study, service quality was operationalized as a second-order reflective construct where five dimensions were measured as first-order constructs. A 5-point Likert-type scale was applied to measure all three study constructs. The originally developed instrument was translated to Bengali and then further converted to English. Expert opinion was taken to confirm the preciseness and clarity of the converted items.
Sampling and Data Collection
Data were gathered from Gen Y customers (age of whom ranges from 23 to 40 years) who did shopping in four leading superstores (viz., Agora, Shwapno, Meenabazar, and Princebazar) of two major cities (such as Dhaka and Chattogram) in Bangladesh. Since the inception of Agora in 2001, Bangladesh has witnessed a tremendous growth in the superstore retailing sector (Alam & Noor, 2019). Eventually, other superstores such as Meenabazar, Princebazar, and Shwapno started their operation in 2002, 2005, and 2008, respectively. According to industry experts, the expected turnover of this sector in Bangladesh will reach to US$2.6 billion by the year 2021 with an average sales growth of 30% per annum (Gain Report, 2013). At present, 121 outlets of different superstores are running their businesses in Bangladesh (Alam, 2018). Among them, 95 branches are managed by the above-mentioned four major superstores. For sampling purpose, 10 out of 95 branches were randomly selected. Then, from each branch, 50 respondents were approached using a systematic sampling method where every five alternative respondents were intercepted. As suggested by Orel and Kara (2014), data were systematically collected both in morning and evening session of each collected day to ensure more representation of the selected samples. A total of 500 questionnaires were distributed and finally 325 were returned with 65% response rate. This sample size is enough to run a SEM (structural equation model) analysis as it meets the minimum number of sample suggested by Hair et al. (2010) based on the formula (5 × number of items/observable variables in the model). In this connection, minimum size of the required respondent is 165 (5 × 33). Moreover, respondents were prescreened to confirm their belongingness in the Gen Y cohort by asking a filtering question.
Data Analysis
At the initial stage of analysis, SPSS Version 23 was applied to detect and phase out incomplete responses, missing values, and outliers of the data, along with analyzing the respondents’ demographic profile. Later on, Smart-PLS 3.0 software was used to test the assumed relationships by deploying PLS-SEM method. For several reasons, we utilized PLS-SEM as a data analysis technique. First, PLS-SEM can deal with hierarchical component model (in our case, reflective–reflective second-order service quality model) whereas traditional regression analysis in SPSS cannot (Hair et al., 2017). Second, PLS-SEM has higher statistical power in explaining the significance of the path relationships (Hair et al., 2019). Third, this technique is less sensitive to data normality (do Valle & Assaker, 2016). Finally, in scrutinizing the indirect (mediation) effect, this analysis technique delivers more consistent outputs compared with traditional regression analysis in SPSS (Ramli et al., 2018). A two-stage approach suggested by Anderson and Gerbing (1988) was followed. At the initial phase, measurement model was examined to assess the factor structure of the selected constructs and confirmed by means of confirmatory factor analysis (CFA); whereas, at the later phase, the structural model was assessed through applying SEM technique to test the hypotheses.
Results
This section embraces the results of data analysis as follows—inspection of non-response bias, evaluation of the common method variance (CMV), assessing the respondents’ demographic profile, assessment of measurement model, and subsequently the structural model.
Assessment of Non-Response Bias
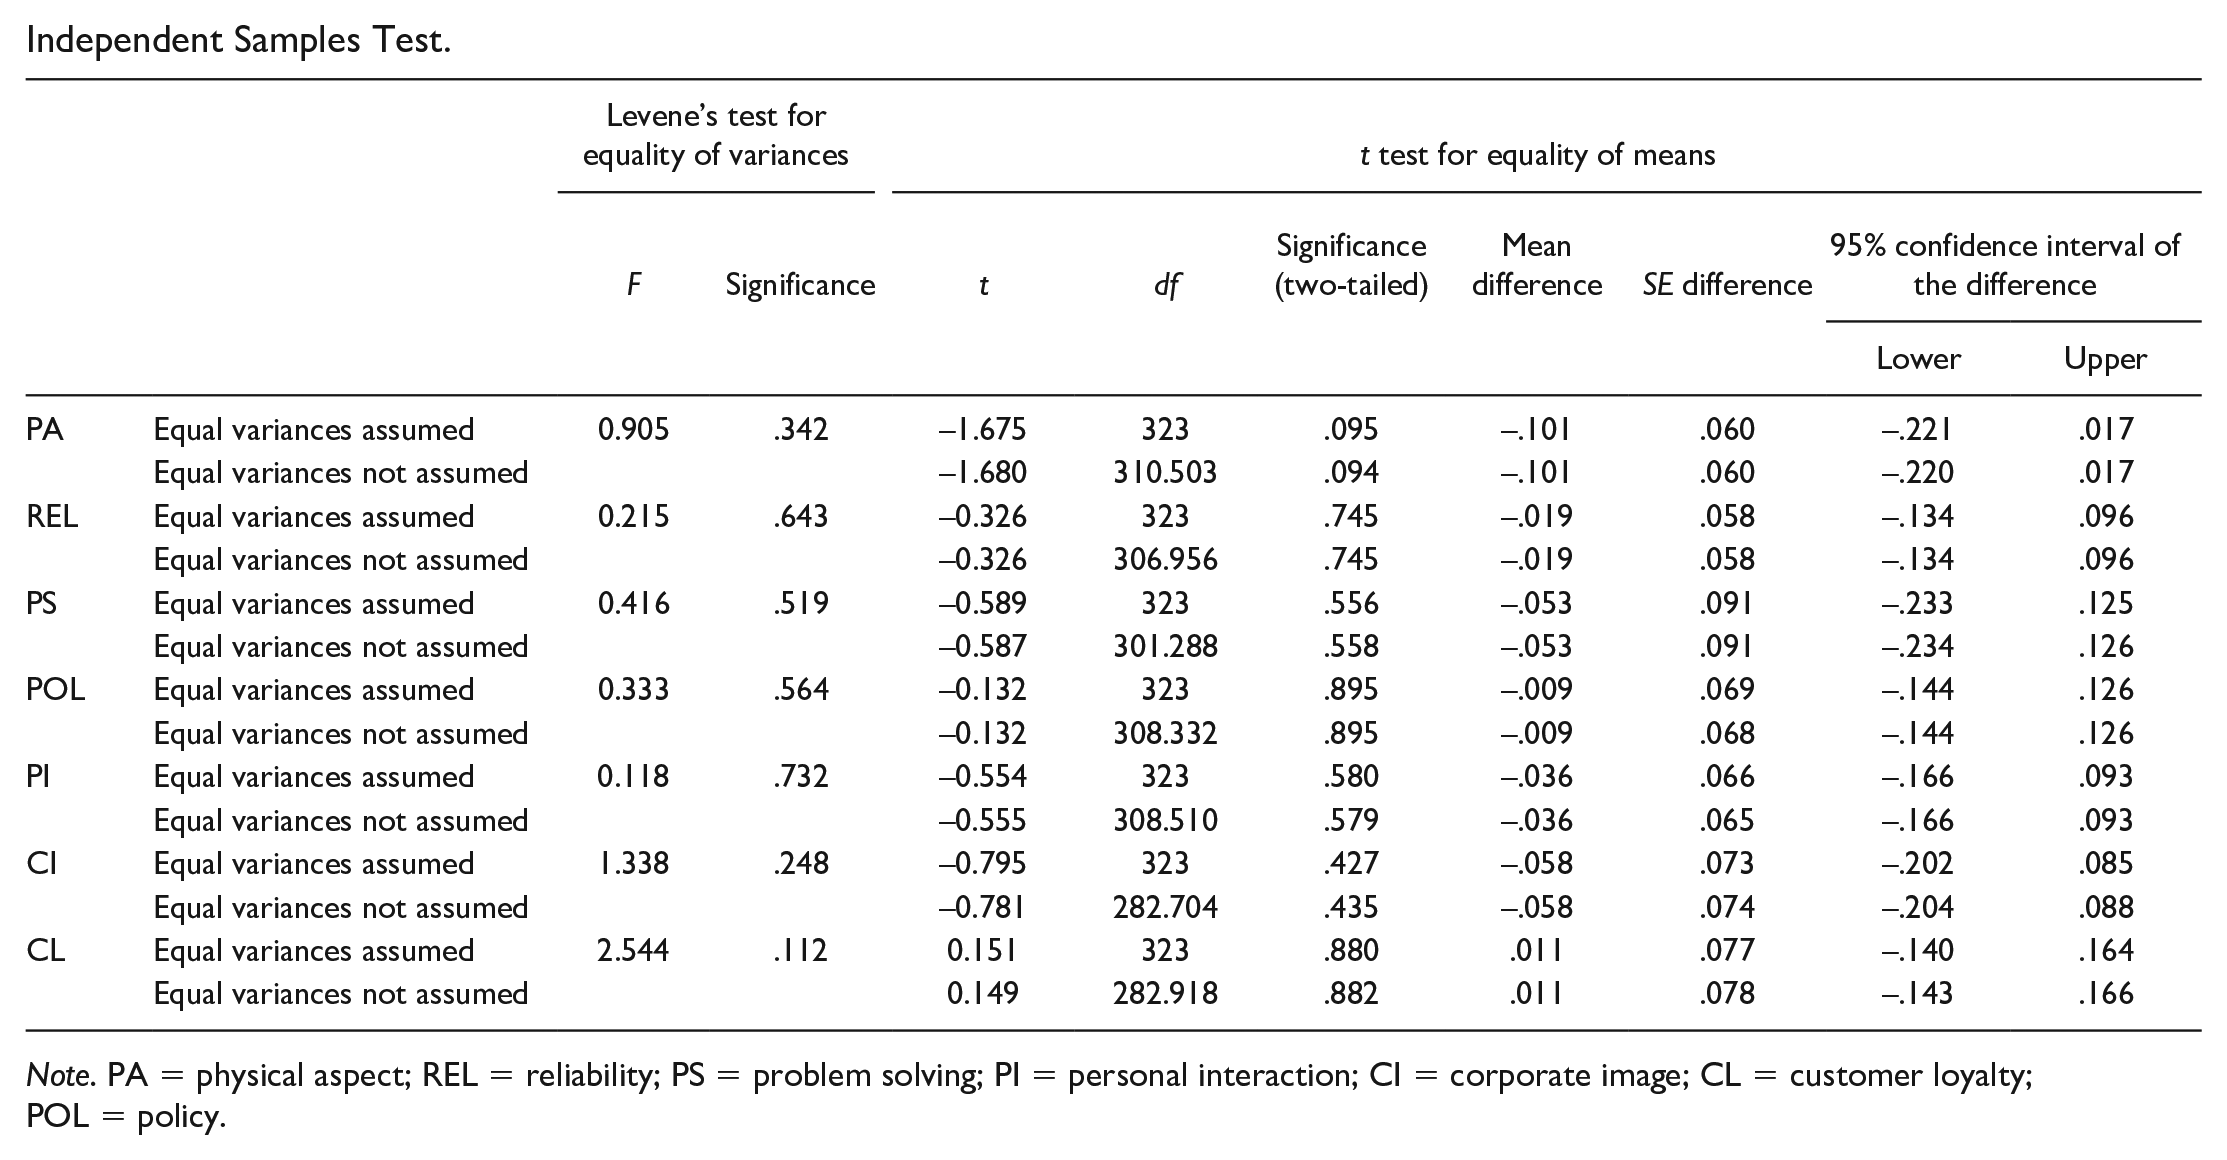
To inspect the existence of non-response bias in the data set, this study deployed independent-sample t test for comparing the mean score of early group (181) and late group (144) of respondents. Respondents who initially refused to fill the questionnaire at the time of entrance but did it at the time of leaving the superstore are considered as late respondents. As shown in Appendix B, the outcome reveals that the difference between the two group means is statistically insignificant in relation to all variables. As a result, non-response bias is not an issue for the collected data that confirm the homogeneity in both early phase and later phase.
Evaluation of CMV
As the generated data came from a single source, it is necessary to scrutiny the existence of CMV in the data set. As a widely applied post hoc technique to assess the CMV issue, the Harman’s single factor test was used as recommended by Podsakoff and Organ (1986). The test output reveals that the variance explained by the first factor is 31.83% which is below the recommended ceiling value of 50%; whereas all the factors generate the aggregated variance of 59.61% which is higher than the threshold level of 50% as recommended by Podsakoff et al. (2003). Moreover, single factor was not extracted through exploratory factor analysis (EFA)—indicating that CMV is not an issue for collected data. Several recent scholars also applied this technique to detect the CMV issue in their study (e.g., Kim et al., 2019; Rahman et al., 2020). In addition, as a second endeavor to detect the presence of CMV in the data set, correlation analysis was done as recommended by Pavlou et al. (2007) and Bagozzi et al. (1991). According to them, the presence of high correlation value (more than 0.90) between any two constructs of the study model indicates that the data are susceptible to CMV issue. Table 3 illustrates that the highest correlated value of the study constructs is .696 which is below the endorsed cut-off value 0.90. Recently, Islam et al. (2019) also utilized this technique to check the CMV issue in their study. Thus, it is confirmed that CMV is not an issue for this scholarship. Besides, we confirmed the anonymity of the research and informed the respondents not to be concerned about right or wrong answer, rather focus on the honesty in providing responses. These initiatives are often found as remedies to lessen the risk of CMV in surveys (Chang et al., 2010; Chuah et al., 2017; MacKenzie & Podsakoff, 2012).
Sample Profile
Out of the total sample (N = 325), majority of the participants (56.6%) were female, indicating the general trend prevails in the world’s grocery shopping. This outcome is more relevant in the context of Bangladesh as appeared in the study by Rahman and Noor (2016). Despite the participants were from Gen Y cohort, most of them (55.4%) were from 23 to 30 years—indicating younger customers. Majority of the participants were married (55.7%) followed by single (41.5%), divorced (2.2%), and widow (0.6%). Most of them were graduated (96.9%) with 52.3% master’s degree and 1.8% PhD; 56.2% participants had monthly income more than BDT 60,000 (BDT 1 = US$0.0119223 as on February 20, 2019).
Assessment of Outer Model
At the initial phase of SEM analysis, it is essential to check the factor structure of the outer model to make sure the reliability as well as validity aspects of the study variables by examining convergent and discriminant validity.
As recommended by Hair et al. (2017), the convergent validity of the measurement model was examined through AVE (average variance extracted), factor loadings, internal consistency, as well as composite reliability (CR). The outputs (see Table 1) indicate that the requirements of convergent validity are fulfilled as the factor loadings of all the indicators are above 0.6, the Cronbach’s alpha and CR values exceed 0.70, and the AVE values are higher than 0.50 (Hair et al., 2017).
Convergent Validity Outputs of the First-Order Construct.
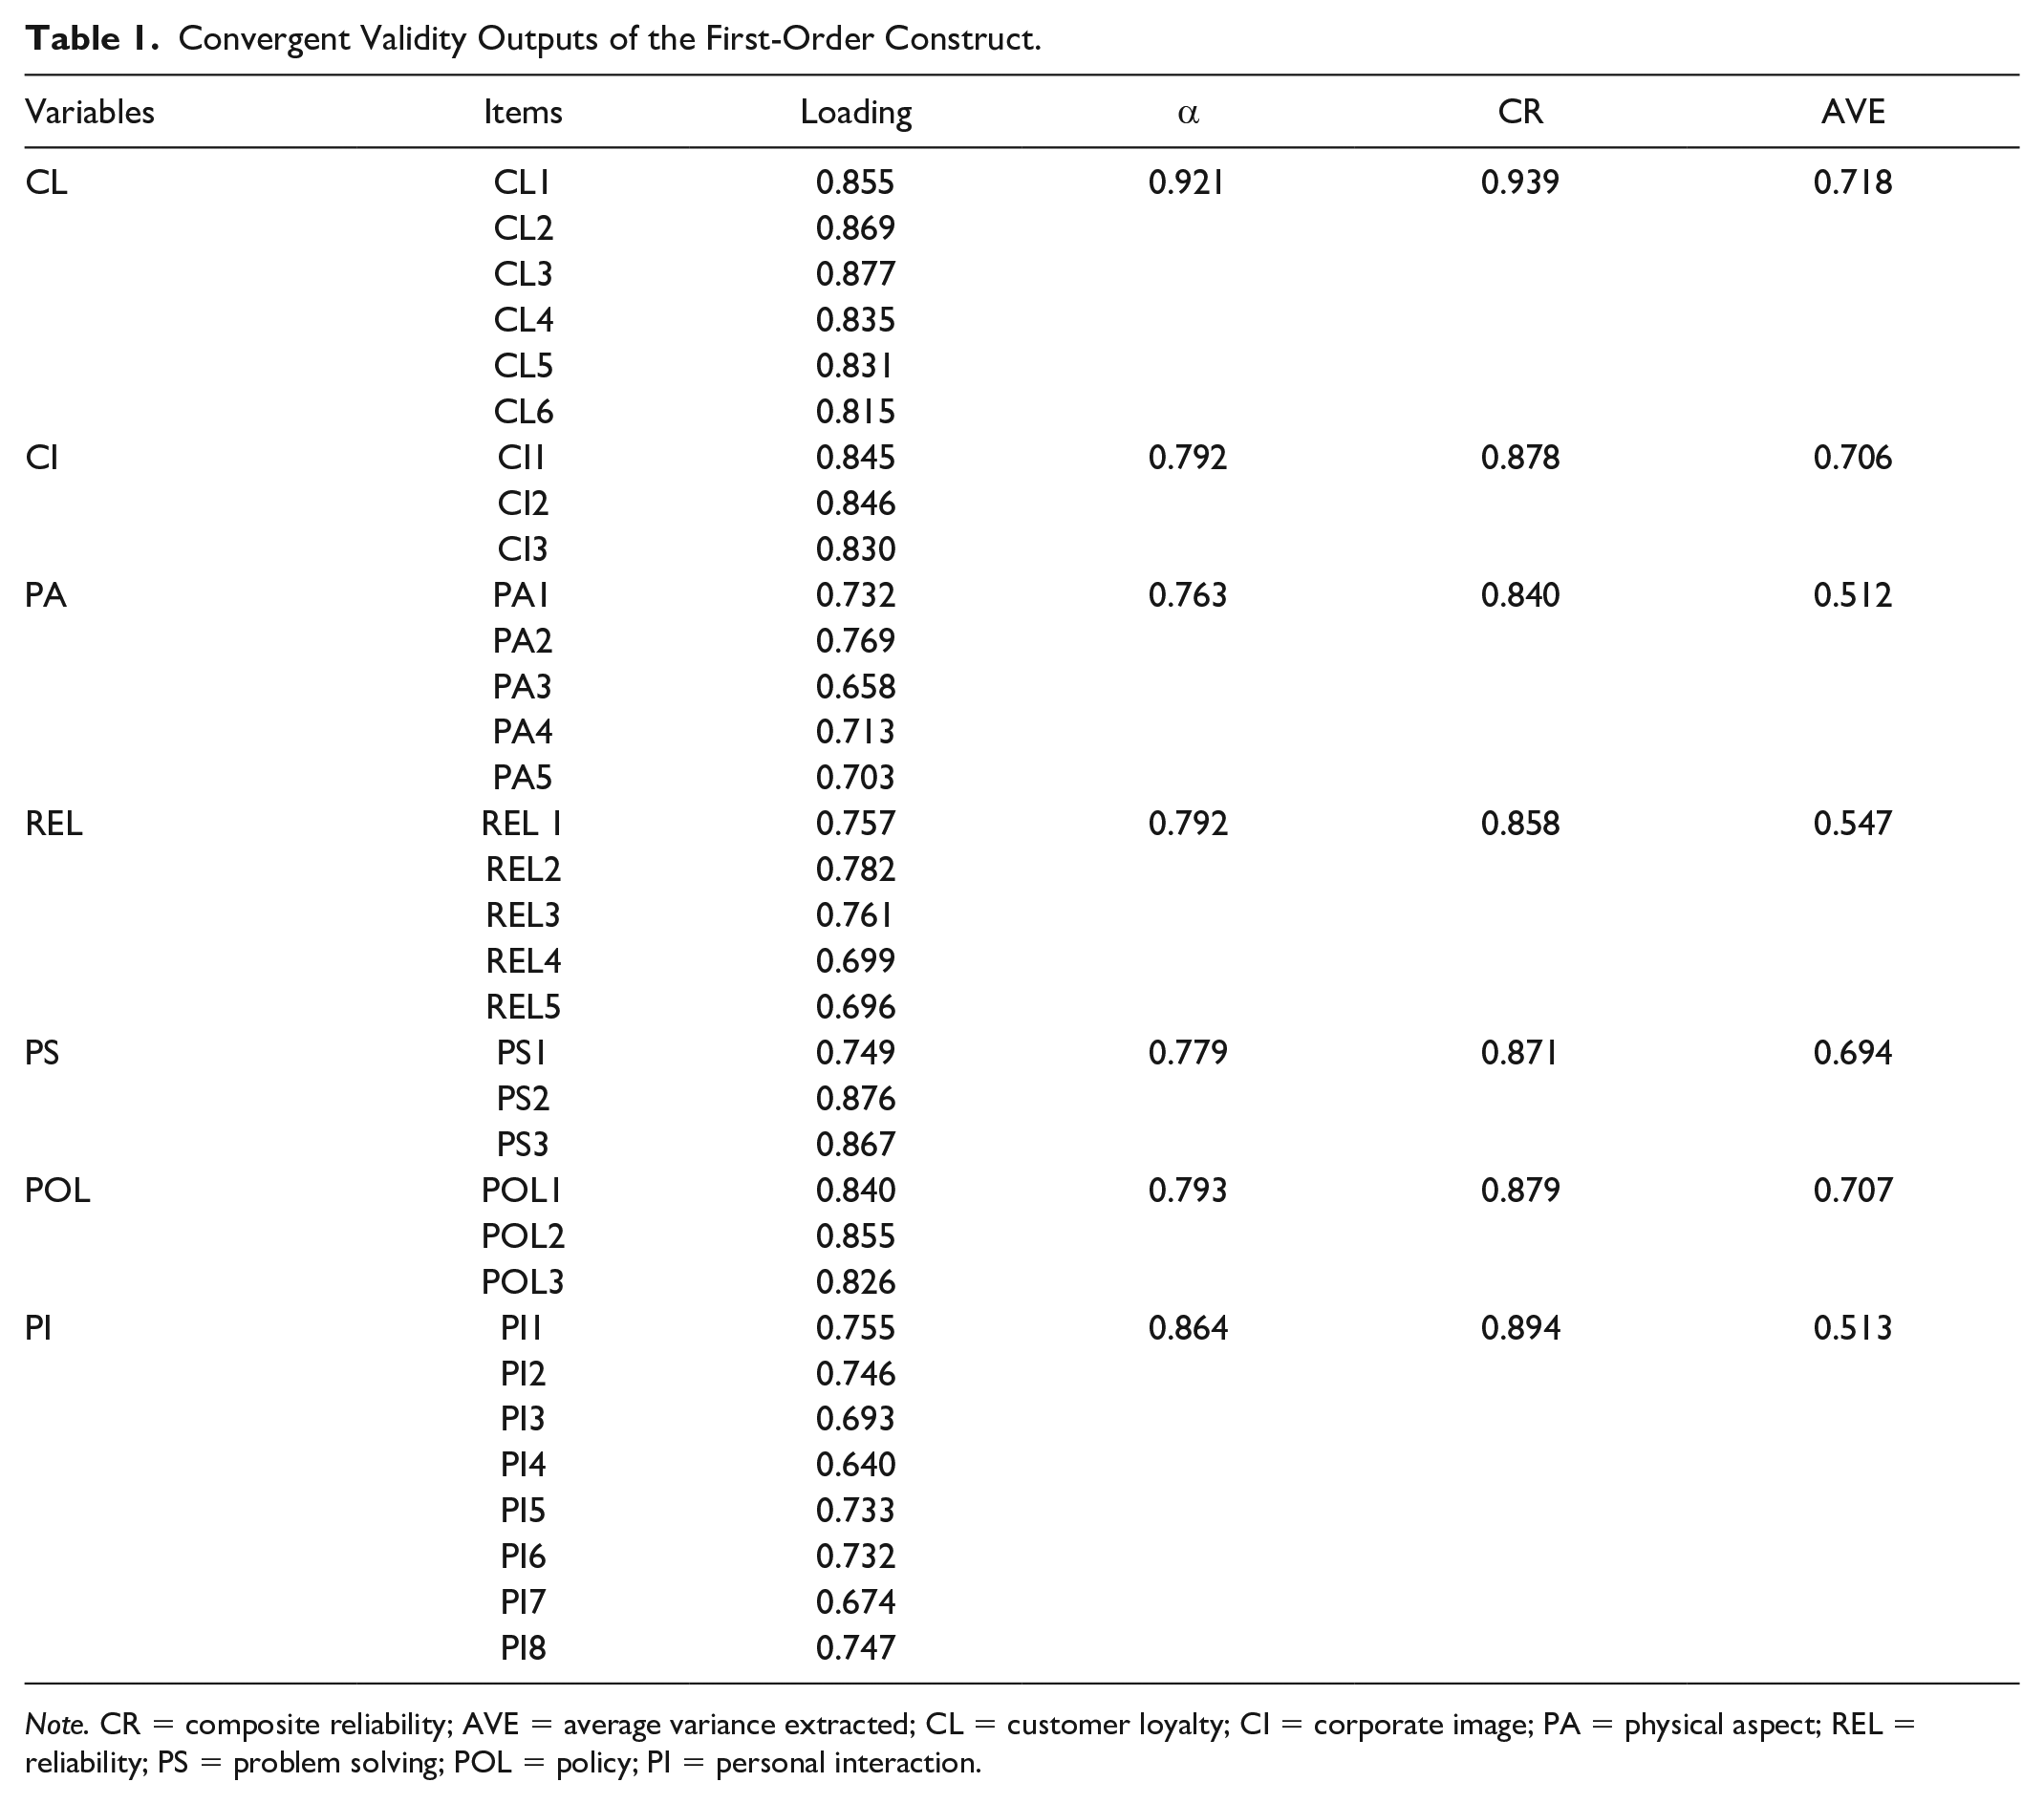
Note. CR = composite reliability; AVE = average variance extracted; CL = customer loyalty; CI = corporate image; PA = physical aspect; REL = reliability; PS = problem solving; POL = policy; PI = personal interaction.
Inherently, the RSQS instrument is a multidimensional hierarchical construct to evaluate the service quality of the superstore (Dabholkar et al., 1996). Aligned with the nature of the instrument, we also measured service quality as a reflective–reflective second-order component model. Moreover, in PLS analysis, it is recommended to consider higher order construct as it lessens the quantity of relationships and makes the structural model more parsimonious (Hair et al., 2017). The hierarchical service quality construct was estimated by five first-order constructs, namely, physical aspects, reliability, problem solving, policy, and personal interaction. Table 2 depicts the outputs of convergent validity of this construct showing factor loading of 0.673 (physical aspect), 0.760 (reliability), 0.667 (problem solving), 0.714 (policy), and 0.741 (personal interaction) with all statistically significant at p < 0.001. The Cronbach’s alpha value (0.892), CR value (0.906), and AVE value (0.507) of the service quality construct are surpassed the recommended threshold value, indicating that service quality as a second-order construct is a reliable and valid one.
Convergent Validity of the Second-Order Construct.

Note. CR = composite reliability; AVE = average variance extracted.
p < .001.
To justify the discriminant validity of the study constructs, both Fornell and Larcker (1981) criterion and Henseler et al. (2015) recommended Heterotrait–Monotrait (HTMT) ratio of correlations were applied. As shown in Table 3, the square roots of all AVE values of the constructs are greater than the off-diagonal correlation values of their corresponding each row and column. As a result, the requirement for discriminant validity of the outer model is confirmed (Fornell & Larcker, 1981). Moreover, under the HTMT approach, if the observed HTMT value is higher than 0.85 (Kline, 2015), then the validity of the constructs with respect to discrimination is questionable. In addition, it is required to confirm the statistical significance of null hypothesis (H0: HTMT ≥ 1) as opposed to alternative hypothesis (H1: HTMT < 1). As a token of assessment, if the confidence interval encompasses the value of 1 (i.e., H0 holds), this is the indication of the nonexistence of discrimination among the constructs (Henseler et al., 2015). Table 4 exemplifies that the observed HTMT values are lower than the suggested Kline standard (0.85). Besides, the HTMT inference reveals that the value of 1 does not take place in any confidence interval, confirming the discrimination of the constructs.
Discriminant Validity (Fornell and Larcker Criterion).
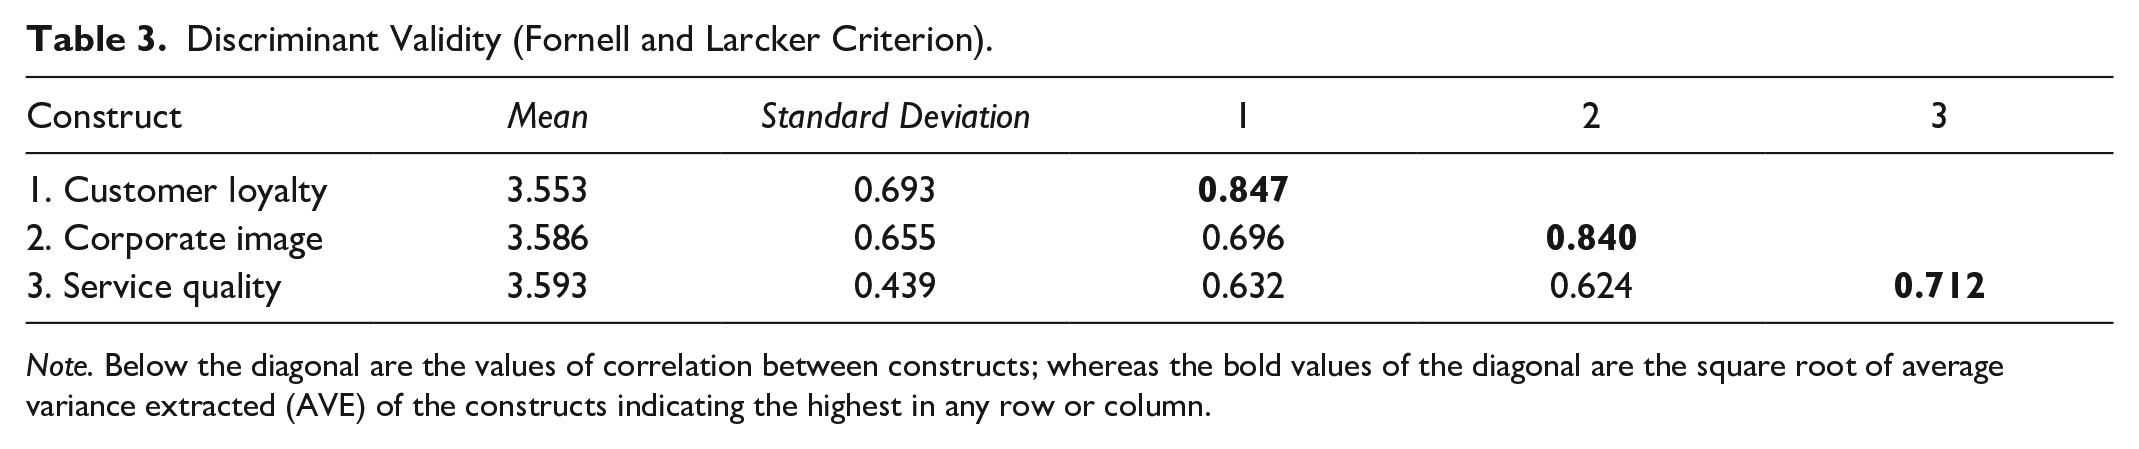
Note. Below the diagonal are the values of correlation between constructs; whereas the bold values of the diagonal are the square root of average variance extracted (AVE) of the constructs indicating the highest in any row or column.
Discriminant Validity (HTMT).

Note. HTMT = Heterotrait–Monotrait; CL = customer loyalty; CI = corporate image; SQ = service quality.
Inner Model Assessment
As recommended by the scholars, it is required to verify the existence of multicollinearity among the predictors of a criterion variable by inspecting the VIF (variance inflation factor) before assessing the inner model. As shown in Table 5, VIF values of both service quality (1.639) and CI (1.639) for criterion variable customer loyalty are below the maximum threshold value of 3.3 as suggested by Kock and Lynn (2012). Thus, for assessing structural model, multicollearity is not an issue.
Collinearity Assessment (VIF).

Note. VIF = variance inflation factor.
The prime criteria to examine the structural model are assessing the R2 values (coefficient of determination), path coefficient (beta) values, t values (with resample of 5,000 through bootstrap procedure), the values of effect size ( f2), and the Q2 values as recommended by Hair et al. (2017). Table 6 and Figure 2 represent the outputs of the structural model.
Outcomes of the Structural Model.

Note. H = hypothesis; BC = biased corrected; LL = lower limit; UL = upper limit; SQ = service quality; CL = customer loyalty; CI = corporate image.
p < .001.

Results of the structural model.
The path analysis was also investigated. The outputs demonstrate that both service quality (β = 0.324, t = 6.087, p < 0.001) and CI (β = 0.493, t = 8.348, p < 0.001) have meaningful effect on Gen Y customer loyalty. Hence, H1 and H3 are retained. Furthermore, CI is directly and meaningfully determined by service quality (β = 0.624, t = 15.684, p < 0.001), confirming H2. Moreover, the mediation effect was also assessed. Table 6 shows that service quality significantly affects customer loyalty with the mediation of CI (β = 0.308, t = 7.456, d p < 0.001). Hence, H4 is also supported.
The R2 value of CI is calculated as 0.390, which indicates that service quality has 39% explanatory power in determining the variation of CI. The value of R2 for customer loyalty is found as 0.548, demonstrating that 54.8% of the variation in customer loyalty is responsible for the variation in service quality and CI. In both cases, the explanatory power of the predictors over criterion variable is moderate (Chin et al., 2008). In addition to R2 value, the f2 value is also important to assess (Hair et al., 2017). The f2 value measures the influence of a particular independent variable on a dependent variable given that the omission of that exogenous variable has a substantial effect on that endogenous variable. Table 6 shows the generated f2 values of the studied model. The effect size of 0.02, 0.15, and 0.35 are considered as small, medium, and large in effect, respectively (Cohen, 1988). The outputs indicate that the effect of service quality on CI is large; whereas, in influencing customer loyalty, the effect size of service quality is medium and CI is large. As a final parameter, as suggested by Henseler et al. (2009), the value of Q2 is investigated. If the Q2 value of an endogenous construct is greater than the value of zero (0), then the model has a predictive relevancy for that endogenous variable (Hair et al., 2017; S. A. Rahman et al., 2017). A particular endogenous variable has a small, medium, and large predictive relevance if the Q2 value is 0.02, 0.15, and 0.35, respectively (Hair et al., 2017). The results demonstrate the large and medium predictive relevancy for customer loyalty and CI, respectively.
Discussion
This study investigates the association between service quality and Gen Y customer loyalty toward superstores in Bangladesh. This study further examines the mediation role of CI in explaining the path association between service quality and Gen Y customer loyalty. The investigated model is grounded on the S-O-R theory, where S stands for service quality, O for CI, and R for customer loyalty. The analyses outputs indicate that service quality was appeared as a significant predictor of customer loyalty. In the retailing context, this outcome is corroborated by several previous studies (Diallo et al., 2018; Yoon & Park, 2018). This study also confirmed the significant impact of image on customer loyalty in the retailing context, which is supported by earlier scholarly works (e.g., Burlison & Oe, 2018; Nesset et al., 2011). Besides, the significant intervening role of CI was appeared between service quality and customer loyalty. In fact, higher level of store service quality significantly enhances the totality of the store image (Yu & Ramanathan, 2012), which in turn expedites the loyalty of the shoppers.
Theoretical Contributions
In the retailing context, most of the previous studies considered CI as a predictor of service quality and view it from retailing perspective in the name of “store image” rather treating it as an outcome of service quality in the name of “corporate image” (Giovanis & Tsoukatos, 2017). By considering it from holistic view point, this study incorporates CI as an outcome variable of service quality as well as an intervening variable in explaining the impact of service quality on Gen Y customer loyalty toward superstore chains in Bangladesh. Besides, image can be used as a predictor of service quality if customers have no previous experience (Hu et al., 2009; Nguyen & LeBlanc, 2001); whereas, image is influenced by service quality if customers are somewhat experienced (Giovanis & Tsoukatos, 2017). As our research is concerned about Gen Y customers’ loyalty toward superstores, it is expected that customers are somehow experienced with the superstores. Thus, image as a consequence of service quality in our study context is justified. Hence, from theoretical perspective, the contribution of this scholarship is twofold. First, this study introduces image as an outcome variable of service quality by considering it from holistic viewpoint (American Marketing Association, 2019) which is very limited in the superstore context globally and rare from Bangladesh perspective. Second and most importantly, investigation of CI as a role of mediator in the relationship between service quality and customer loyalty in the context of superstore retailing allied with the S-O-R theory is a rare one. Thus, this study is expected to broaden the domain of S-O-R theory.
Practical Implications
This scholarship has also a number of managerial implications. The findings of this research initiative specify that service quality and CI play noteworthy roles in determining customer loyalty. In addition, this scholarship reveals the mediating role of CI in relation to the effect of service quality on customer loyalty. In this connection, some meaningful solutions are proposed for the owners of superstores in Bangladesh to develop and implement the strategies to sustain as well as uplift the loyalty of their customers, particularly Gen Y.
As this study illustrates that significant loyalty of Gen Y customers can be confirmed toward a superstore with the presence of better service quality, the store managements are required to be more cautious about availability of various aspects of service quality. Store managers should focus on better store atmospheric attributes with suitable layout design which is more appealing to the young customers. The superstore owners should focus on developing and implementing better human resources policies to recruit those in-store staffs having inclination to serve the customers with dedication and intimacy, on one hand, and to train them to upgrade their skills and knowledge for dealing with customer problems more satisfactorily, on the other hand. Superstore managers are required to strive for better improvement in their quality of services by collecting feedback from customers and other means of their service evaluations. It is also evident in the literature that rather than service recovery strategy taken against service failure, consistent service delivery can increase the image of the store as well as intentions of customer to patronage the store (Brown et al., 1996). Thus, to strengthen their customer base, superstore managers should concentrate on reliability aspect of their service delivery rather than fixing the problem upon service failures. The decision makers of the superstore should be careful in formulating store policies as fair policy is instrumental for better service quality which uplifts the image of the store and loyalty level of the customers. In this connection, policies such as the creation of facilities to accept the major debit/credit cards, the gathering of high-quality merchandises, the convenient operating hours of the stores throughout the weeks, exchange and return of merchandises, and so on are highly recommended to owners of the superstores to follow.
Kinley et al. (2010) pointed that placement and display of products at the retail store become important for the customers of Gen Y cohort. Besides, Gen Y customers are accustomed with experiential consumption and as a consequence, persuasive retailers need to be concerned with store atmospherics along with sensorial marketing activities (Chaney et al., 2017).
In addition, retailers should concern about developing their institutional image in building such loyal customer base. Specially, to attract and retain the profitable young segment, it is imperative for the superstore owners to gain a favorable image (overall impression) of their stores in the mind of consumers. The reason behind is that the Gen Y customers are more serious about the image of an object (e.g., product, store; Wang et al., 2018). A clear and consistent image of a store can create a distinctive place in the mind of shoppers which helps them to sort out their preferred store easily and encourage them to attach with that store more deeply (Burlison & Oe, 2018). As findings show that CI of the superstores mediates the influence of service quality on customer loyalty of Gen Y, the superstore management should look into a step forward to develop and retain a better image of the store. In this connection, the store management can try to comply with the required standards of several authoritative body such as Bangladesh Standard and Testing Institute (BSTI) and Bangladesh Food Safety Authority, and hence, by doing so, can gain the certificate of better performer. This kind of recognition and ranking will help the superstore managers to uplift their image perception among the customers in general and Gen Yers in particular.
Limitations and Directions for Future Research
Despite some important findings, this study is not free from limitations. First, this study considered service quality as reflective–reflective hierarchical construct to predict loyalty behavior of Gen Y customers. Recent scholars suggest that measuring second-order service quality construct should follow the reflective–formative format rather than reflective–reflective one. In the absence of global item for each dimension of the RSQS instrument, reflective–formative format was not followed for this study. Future study can collect data according to prescribed format and justify the reflective–formative format of the scale. Second, cross-sectional design was used for this study to gather necessary data. Causal relationships among the variables require to be assessed by undertaking longitudinal approach due to dynamic retail environment. Third, data were taken from Gen Y cohort regarding their perceptions of superstore retailing and hence, generalization of findings for other study context may be questionable. Incorporating customers from different cohorts and geographic locations might provide different insights. To make the research model more comprehensive, future research can consider other predictors of customer loyalty, such as customer education, customer participation, service fairness, and customer value along with the mediating variable of CI. In addition, socio-economic factors can be used as a moderating variable between the predictors and criterion variable of the future study model. Moreover, this study model can be expanded and integrated with the expectancy–confirmation theory (ECT) in future endeavors.
Conclusion
The study investigated the direct influence of service quality and CI on customer loyalty and indirect effect of service quality on customer loyalty through CI in the superstore context of a developing country, Bangladesh, focusing on the Gen Y customers’ perception. Facing immense competition, superstores in Bangladesh are now losing their customers (Alam, 2018). In this connection, it is required to heighten the focus of the store management to find out the influencing factors that will lead to ensure the strong customer base. The outcomes of this study reveal that service quality and CI of the superstore have positive and significant impact on customer loyalty of young cohort. This outcome will guide the superstore owners to concentrate more on improving their quality service delivery in terms of store physical aspects, service reliability, customers’ problem solving, attractive store policies, as well as cordial interaction of the store personnel to reap the financially lucrative market share of young generation most. Besides, the superstore authority should concentrate on the development of positive and holistic impression of the store in the mind of the young consumers as image plays a significant mediating role in the path association between service quality and Gen Y customer loyalty.
Footnotes
Appendix A
Measurement Items of the Constructs.

| Customer Loyalty (CL) (Chang & Yeh, 2017) | |
|---|---|
| CL | |
| CL1 | I am likely to say positive things about this store to other people. |
| CL2 | I will encourage my friends and relatives to purchase from this store. |
| CL3 | I will recommend this store to someone who seeks my advice. |
| CL4 | I am a loyal customer of this store. |
| CL5 | I am likely to continue purchasing from this store in the next few years. |
| CL6 | This store is my first choice when I want to buy appropriate products. |
| Corporate Image (CI) (Nguyen & LeBlanc, 2001) | |
| CI | |
| CI1 | I have always had a good impression about this store. |
| CI2 | In my opinion, this store has a good image in the minds of consumers. |
| CI3 | I believe that this store has a better image than its competitors. |
| Service Quality (RSQS; Dabholkar et al., 1996) | |
| PA | |
| PA1 | This store has modern-looking equipment and fixtures. |
| PA2 | The physical facilities at this store are visually appealing. |
| PA3 | Materials associated with this store’s service (such as shopping bags, catalogs, or statements) are visually appealing. |
| PA4 | The store layout at this store makes it easy for customers to find what they need. |
| PA5 | The store layout makes it easy for customers to move around in the store. |
| REL | |
| REL1 | When this store promises to do something by a certain time, it will do so. |
| REL2 | This store provides its services at the time it promises to do so. |
| REL3 | This store performs the service right from the first time. |
| REL4 | This store has merchandise available when the customers want it. |
| REL5 | This store insists on error-free sales transactions and records. |
| PS | |
| PS1 | This store willingly handles returns and exchanges. |
| PS2 | When a customer has a problem, this store shows a sincere interest in solving it. |
| PS3 | Employees of this store are able to handle customer complaints directly and immediately. |
| POL | |
| POL1 | This store offers high-quality merchandise. |
| POL2 | This store has operating hours convenient to all their customers. |
| POL3 | This store accepts most major credit cards. |
| PI | |
| PI1 | Employees in this store have the knowledge to answer customers’ questions. |
| PI2 | The behavior of employees in this store instill confidence in customers. |
| PI3 | Customers feel safe in their transactions with this store. |
| PI4 | Employees in this store give prompt service to customers. |
| PI5 | Employees in this store inform customers exactly when services will be performed. |
| PI6 | Employees in this store are never too busy to respond to customer’s requests. |
| PI7 | This store gives customers individual attention. |
| PI8 | Employees in this store are consistently courteous with customers. |
Note. CL = customer loyalty; CI = corporate image; RSQS = Retail Service Quality Scale; PA = physical aspect; REL = reliability; PS = problem solving; POL = policy; PI = personal interaction.
Appendix B
Independent Samples Test.
| Levene’s test for equality of variances | t test for equality of means | |||||||||
|---|---|---|---|---|---|---|---|---|---|---|
| F | Significance | t | df | Significance (two-tailed) | Mean difference | SE difference | 95% confidence interval of the difference | |||
| Lower | Upper | |||||||||
| PA | Equal variances assumed | 0.905 | .342 | −1.675 | 323 | .095 | −.101 | .060 | −.221 | .017 |
| Equal variances not assumed | −1.680 | 310.503 | .094 | −.101 | .060 | −.220 | .017 | |||
| REL | Equal variances assumed | 0.215 | .643 | −0.326 | 323 | .745 | −.019 | .058 | −.134 | .096 |
| Equal variances not assumed | −0.326 | 306.956 | .745 | −.019 | .058 | −.134 | .096 | |||
| PS | Equal variances assumed | 0.416 | .519 | −0.589 | 323 | .556 | −.053 | .091 | −.233 | .125 |
| Equal variances not assumed | −0.587 | 301.288 | .558 | −.053 | .091 | −.234 | .126 | |||
| POL | Equal variances assumed | 0.333 | .564 | −0.132 | 323 | .895 | −.009 | .069 | −.144 | .126 |
| Equal variances not assumed | −0.132 | 308.332 | .895 | −.009 | .068 | −.144 | .126 | |||
| PI | Equal variances assumed | 0.118 | .732 | −0.554 | 323 | .580 | −.036 | .066 | −.166 | .093 |
| Equal variances not assumed | −0.555 | 308.510 | .579 | −.036 | .065 | −.166 | .093 | |||
| CI | Equal variances assumed | 1.338 | .248 | −0.795 | 323 | .427 | −.058 | .073 | −.202 | .085 |
| Equal variances not assumed | −0.781 | 282.704 | .435 | −.058 | .074 | −.204 | .088 | |||
| CL | Equal variances assumed | 2.544 | .112 | 0.151 | 323 | .880 | .011 | .077 | −.140 | .164 |
| Equal variances not assumed | 0.149 | 282.918 | .882 | .011 | .078 | −.143 | .166 | |||
Note. PA = physical aspect; REL = reliability; PS = problem solving; PI = personal interaction; CI = corporate image; CL = customer loyalty; POL = policy.
Declaration of Conflicting Interests
The author(s) declared no potential conflicts of interest with respect to the research, authorship, and/or publication of this article.
Funding
The author(s) received no financial support for the research and/or authorship of this article.