
Abstract
This study targets problems in the risk assessment and control processes of letter of credit settlements for Chinese export enterprises. It applies the quantitative method of exploratory factor analysis to extract the main factors and uses a confirmatory factor analysis to test the validity these constructs. VENSIM software is used to design the system dynamics causal tree and flowchart of the letter of credit system. The equation sets of DANAMO parameters are then constructed using the software. Finally, through analysis of the system risk fluctuation diagram with system simulation, it offers enterprises advice on how to identify potential risk points to prevent and control letter of credit risks in advance.
Introduction
With globalization of the world economy and frequent exchanges of trade among countries, settlement tools have become increasingly advanced. A letter of credit (L/C) is one of the three traditional settlement instruments in international trade. Especially when trading for the first time, the import and export parties will generally prefer not to adopt more risky settlement tools such as Telegraphic Transfer (T/T) and document against payment (D/P). L/C will often be considered as the appropriate tool for processing “the first night right.” However, as L/C settlements are usually associated with complexity, professionality, and technicality, people often find it difficult to understand and control the associated systematic and dynamic risks, especially when facing the assessment and measurement problems of L/C settlements among different countries, different legalities, different people, and different financial institutions.
To resolve the challenge of preventing international settlement risks, we undertook the following steps to address this issue: first, common risk factors involved in L/C settlements were extracted via the method of exploratory factor analysis (EFA); second, the degree of fit of those factors was tested using a confirmatory factor analysis (CFA) model; third, the system dynamics (SD) causal tree of L/C risks was constructed according to the relationships among these factors, and thereafter, an SD simulation model was constructed through which the varied impacts of these factors in L/C risks under different conditions were studied; and finally, we observed the wave conditions of L/C settlement risks in simulation charts and identified the predicted timing of the peak risk values so that we could prevent or control those risk points in advance in the L/C international settlement process.
Literature Review
Researchers have carried out explorations beneficial to understanding L/C settlement risks. Studies of L/Cs locally and abroad are primarily carried out from the following perspectives:
A. Risks and payoffs impacting commercial banks. Yujue Wang (2012) studied the possible fraud risks and legal liability faced by commercial banks when adopting the L/C packing loan product. Qingxia Du (2014) suggests that L/Cs are a low-cost and high-yield business for commercial banks. Nevertheless, due to the independence principle of document examination, commercial banks need to mitigate the risks posed by asymmetric information. Huan Chen and Xiaohui Lin (2017) analyze how issuing and financing banks manage the opening and financing risks of L/Cs in bulk commodity transactions. Nanshu (2017) studied how the clearing banks use back-propagation (BP) neural network model to prevent L/C settlement risks. Rosmawani Chehashim and Nurul Shahnaz Mahdzan (2014) studied the L/C settlement business of commercial banks in Malaysia, showing how these banks generally follow the relevant provisions of the international Uniform Customs and Practice for Documentary Credits (UCP), and they will actively deal with the problems and risk events encountered by participants in these settlement processes. Friederike Niepmann and Tim Schmidt-Eisenlohr (2017a) indicate that L/C settlements can help reduce the risks posed by trade financing products of commercial banks.
B. Risks faced by importers and exporters in international trade.
Wenli Feng (2012) details the criteria for identifying soft clause risks in export L/Cs. Chuchu Wang et al. (2013) illustrate, with examples, how to mitigate risks in L/C settlements in international trade. Lingke Zhou et al. (2018) outline a simple method for the identification of soft clause risks from the viewpoint of export enterprises. Xuanhua Lin (2013) and Xiaolei Li (2018) analyze the various risks in L/C settlements faced by Chinese importers and exporters and propose possible solutions. Hamed Alavi (2016b) considers the many factors which can cause L/C settlement risk while proposing methods for preventing the risk of L/C fraud from the enterprise perspective. Friederike Niepmann and Tim Schmidt-Eisenlohr (2017b) prove empirically that L/C settlement methods have a positive effect on the export volumes of U.S. enterprises.
C. International practice and legal risk prevention. Aili Jiang and Jingjing Wang (2012) propose that the Chinese legislature should formulate relevant laws in accordance with UCP600 to resolve the problem of L/C fraud. Xingjun Dai (2012) studied the exceptions of L/C fraud based on the L/C independence principle. Xiaowei Zhang and Xinchao Yao (2016) based their study on the consultation response documents of the International Chamber of Commerce to clarify differences between the English and Chinese versions of the 31st and 32nd provisions of UCP600. Targeting L/C bill purchases, Sibao Shen and Qi Jiang (2018) distinguish between the legal nature of bill purchases and negotiations from the judicial perspective. Hamed Alavi (2016a, 2017) explains the limited autonomous power and responsibility boundaries of the participants (importers, exporters, commercial banks, and courts, among others) for documenting L/Cs from the perspective of the English legal system.
D. New methods and technologies: electronization, Bank Payment Obligation (BPO), and blockchain technology. Qiping Liao (2014) describes how commercial banks in China have already realized partial electronization in their L/C settlement operations. He furthermore analyzes the reasons, direction, feasibility, and process of adopting comprehensive electronic platforms in the future. Turker Susmus and S. Ozgur Baslangic (2015) compare traditional settlement methods and highlight their shortcomings while discussing the advantages of the new BPO method in international settlement. Yongmei Wang (2016) and Y. Y. Cheng (2017) studied the characteristics, processes, and current problems banks experience with e-delivery. She also describes how CITIC Bank launched its Blockchain-Based L/C System (BCLC) in China in 2017, which changed the opening, transmitting, and negotiating mechanisms of traditional L/Cs. Peng Zhang (2017) outlined the positive and negative effects exerted by blockchain technology on traditional settlement services such as L/C, whereas Lichong Li (2017) forecasted the evolutionary path of future L/Cs under the impetus of block chain technology.
Scholars worldwide have conducted substantial research on L/C settlements, although most of their studies are qualitative rather than quantitative. This research, based on quantitative methods and an EFA, identifies the main risk factors which affect the settlement of L/Cs. In addition, an SD causal tree, which describes the transfer function between risk factors, is constructed. Furthermore, dynamo equations and SD simulations are set up to assist with the assessment and control of the dynamic risks of L/C settlement.
L/C Settlement Risk Factors Based on EFA and CFA
Research Principles, Methods, and Models
The factors affecting L/C settlements are complex, and there is often a correlation between the observation variables. These closely related variables can make up a common factor which can be mined using an EFA.
The analytical model is as follows:
A. Assumptions: (a) The number of common factors is less than or equal to the number of observed variables. (b) There is no correlation between the common factors and error terms, with variances of special terms possibly being different. (c) There is no correlation among the common factors, and their variance is 1.
B. Mathematical principle model (a) X = AF + ε
(b) Observation variables: X = (X1, X2, X3 . . . Xi); common variables: F = (F1, F2, F3, . . . Fn); special terms: ε = (ε1, ε2, ε3 . . . εn).

C. Extraction of the common factors
The contribution rates of the common factors are calculated with SPSS software, and the common factors are extracted according to their eigenvalues.
Analysis of the Factors Influencing L/C Risks
Gan Ming (2017) identifies the following L/C risks: contract, soft clause, forged L/C, bank credit, and documentation. Shouhong Zhang (2008) groups the L/C risks into credit, documentation, market, legal, and fraud. In Zhi Ling (2008), L/C risks fall into the categories of documentation, price, soft clause, legal, and operational. Yunping Li (2009) divides the L/C risks into soft clause, operational, price, market, capital, exchange rate, political, and forged documentation. Nan Li (2010) groups the L/C risks into risks caused by the external macro environment (exchange rate, trade friction, international practice, national policy) and those caused by the internal micro environment (participants’ credit status, contract terms, documentation, and operational process).
After consulting with the relevant business operators, the summary of the above research and other information is compiled in Table 1. This was validated by foreign trade managers and theoretical researchers.
Selection of L/C Risk Parameters.

Note. L/C = letter of credit; B/L = Bill of Lading; IT = information technology; WTO = World Trade Organization; UPC = Universal Product Code.
Many researchers believe that there is a high degree of correlation and overlap among the parameters X13 (influences of external incidents), X12 (changes in economic environment), and X11 (changes in legal environment). Both X14 (risks caused by changes in political environment) and X15 (risks caused by changes in cultural environment) affect the L/C settlement by influencing X11 (risks caused by changes in legal environment) and X12 (risks caused by changes in economic environment). By secret ballot and several repeated tests using the Delphi method, we canceled these three parameters (X13, X14, and X15).
EFA of L/C Risks
In the questionnaire design phase we adopted the Likert-type scale to design our questionnaires. Table 2 indicates the 5-point scale used by experts to note how important they thought each parameter was for L/C settlement risks.
Measure Scales of L/C Risk Parameters.

L/C = letter of credit.
In the questionnaire survey phase, a total of 300 questionnaires was distributed via emails or directly, and 220 questionnaires were returned. This represents a 73% recovery rate, which is greater than the required rate of 30%, and thus falls in the range of valid values.
A. Kaiser–Meyer–Olkin Measure of Sampling Adequacy (KMO) and Bartlett’s spherical test: KMO was used to test the simple and partial correlation coefficients, whereas Bartlett’s spherical test examined the distribution characteristics and independence of the sample data. SPSS statistical software was used to analyze the data (see Table 3). (a) All values of the anti-image correlation matrix are above .5, which indicates sampling adequacy among the data of the questionnaires. (b) The KMO value is .781, which is greater than .5 specified by Kaiser, indicating that the factorial analysis can be carried out. (c) The chi-square value is 1,737.927, 66 degrees of freedom, with 0 (smaller than .0001) concomitant probability.
Results of KMO and Bartlett’s Spherical Test.
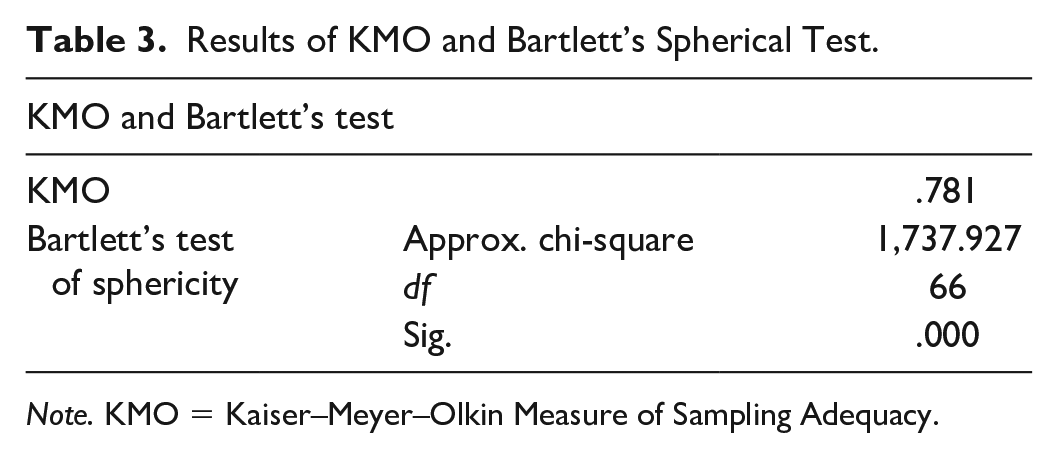
Note. KMO = Kaiser–Meyer–Olkin Measure of Sampling Adequacy.
These values reject the hypothesis of variables being the identity matrix, indicating that they are suitable for factor analysis.
B. Effect of common factor extraction: By analyzing the interrelation between variables and factors with SPSS, we can obtain the loading of each variable on each factor, which indicates the degree of correlation between the two. A larger factor loading indicates a higher degree of correlation, and if it is less than .5, then the degree of correlation is not significant and the related factor can be eliminated. In this empirical study, by constructing a correlation matrix and doing the eigenvalue extraction while rotating with the maximum variance method, a factor loading matrix (Table 4) was obtained. The loading values of the variables X1, X2, X3, X4, X5, X6, and X7 on the factor F1 are greater than .7, those of the variables X10, X11, and X12 on the factor F2 are greater than .6, and those of the variables X8 and X9 on the factor F3 are greater than .7.
C. Extraction and nomenclature of the common factors
Matrix of Factor Variance Loading.

Note. B/L = Bill of Lading.
In Table 5, the eigenvalue of the first common factor is 6.756 and it transforms into 5.434 after rotation. Its variance contribution rate is 56.296% before rotation and 45.286% after rotation. The variables covered by the first common factor include L/C risks originating from the following clauses: B/L, signature and seal affixation, insurance, inspection, shipment, taking-effect, and contradictory. The eigenvalue of the second common factor is 1.667 and it transforms into 2.406 after rotation. Its variance contribution rate is 13.893% before rotation and 20.054% after rotation. The variables covered by the second common factor include risks caused by operational personnel and systems, which reflect those of the bank, and import and export enterprise personnel in the L/C operation.
Eigenvalues and Variance Contributions of the Factors.

Note. Extraction method: principal component analysis.
The eigenvalue of 1.397 and the variance contribution of 11.639% of the third common factor transform after rotation into 1.979 and 16.488%, respectively. The variables covered by the third common factor, which indicates the micro- and the macro- environmental risk factors in L/C settlement, include changes to the clients’ credit and to the legal and economic environment. The eigenvalues of the three common factors are all greater than 1, and the cumulative contribution rate is 81.828, which indicates that F1, F2, and F3 reflect the information of all the parameters, and the results are in accordance with the preformulated factor analysis model.
Nomenclature of the common factors: variables include F1 (clause), F2 (operational), and F3 (environmental, including enterprise credit or national) risk areas.
CFA of L/C Risks
Through EFA, we constructed the evaluation model of the influencing factors of L/C settlements (see Table 4). We then tested the degree of fit of the factor structure model through a CFA. From the 300 questionnaires completed by experts, 192 were randomly selected for this study.
Table 6 indicates that the comparative fit index (CFI) is .901 and the incremental fit index (IFI) is .911, hence both are greater than .90, and the normed fit index (NFI) is .806. It can be concluded that the data fit is fundamentally sound, the fitting effect is good, and the reference significance of the path coefficient is evident. The path analysis chart indicates that the relative factor load of each observation variable is large, whereas the residual value is small, which meets the basic hypothesis and experimental requirements of the CFA.
Baseline Comparisons.

Note. NFI = normed fit index; RFI = relative fit index; IFI = incremental fit index; TLI = Tucker–Lewis index; CFI = comparative fit index.
In Figure 1, the correlation coefficients among factors F1, F2, and F3 indicate small values both between F1 and F2 and between F2 and F3, whereas the value between F1 and F3 is slightly larger. In contrast, most coefficient values between F1 and (V1 V2 V3 V4 V5 V6 V7), F2 and (V10 V11 V12), and F3 and (V13 V14) are large.

The structure of confirmatory factor analysis.
Table 7 indicates correlation coefficient estimation values between F3 and F2 as .09, between F3 and F1 as .22, and between F1 and F2 as −.02, which clearly explains the independence of those factors.
Correlations: (Group Number).

SD Simulation Analysis of the L/C Risks
The extant research on risks in the L/C system mainly evaluates these from the perspective of a single system, by choosing, for example, the document, import and export, commercial banking, or environmental system from those available. Very few studies have combined them to form a system modeling this complexity, which this research achieves using SD studies.
In Figure 2, the general process of SD simulation, as a multilayer information feedback system, is outlined. Researchers first conduct an in-depth analysis of the system, which is then deconstructed into different factor sets. These factor sets will subsequently be linked to establish the causal feedback tree. The system flowchart will then be set up using VENSIM software (including the establishment and input of the dynamo equation). Finally, simulation experiments of the real system structure will be conducted to determine the optimal system structure.

System dynamics (SD) flowchart.
Model Design and Parameter Setting
A. Design of causal tree for L/C settlement risks in international trade. (i) First, the problem is clarified. The assessment system of L/C settlement risks is a complex system which, in accordance with the results of the EFA, can be divided into four risk subsystems: national, enterprise credit, operational, and clause risks. Each of these subsystems can be further divided into further subsubsystems, including primarily the risk systems of country state, political, economic, investment, bilateral, operational process, operator, operational system, external events, moral hazards, liabilities, assets, validity period, document presentation date, shipment time, inspection, B/L, take-effect condition, and the terms of payment risk systems, among others.
Figures 3 and 4 describe the relationships among these various factors.

Relationship among factors on Hierarchies A to C.

Relationships among factors on Hierarchies A to C (using clause risks as an example).
Figure 3 clearly presents the logical relationships among the L/C risks on Hierarchies A to C, whereas the factors on different hierarchies are related by functions.
(ii) Second, the causal tree of L/C settlement risks is constructed based on the cause-and-effect relationships of the problem, paying attention to the interaction between factors and the polarity characteristics of the positive and negative poles.
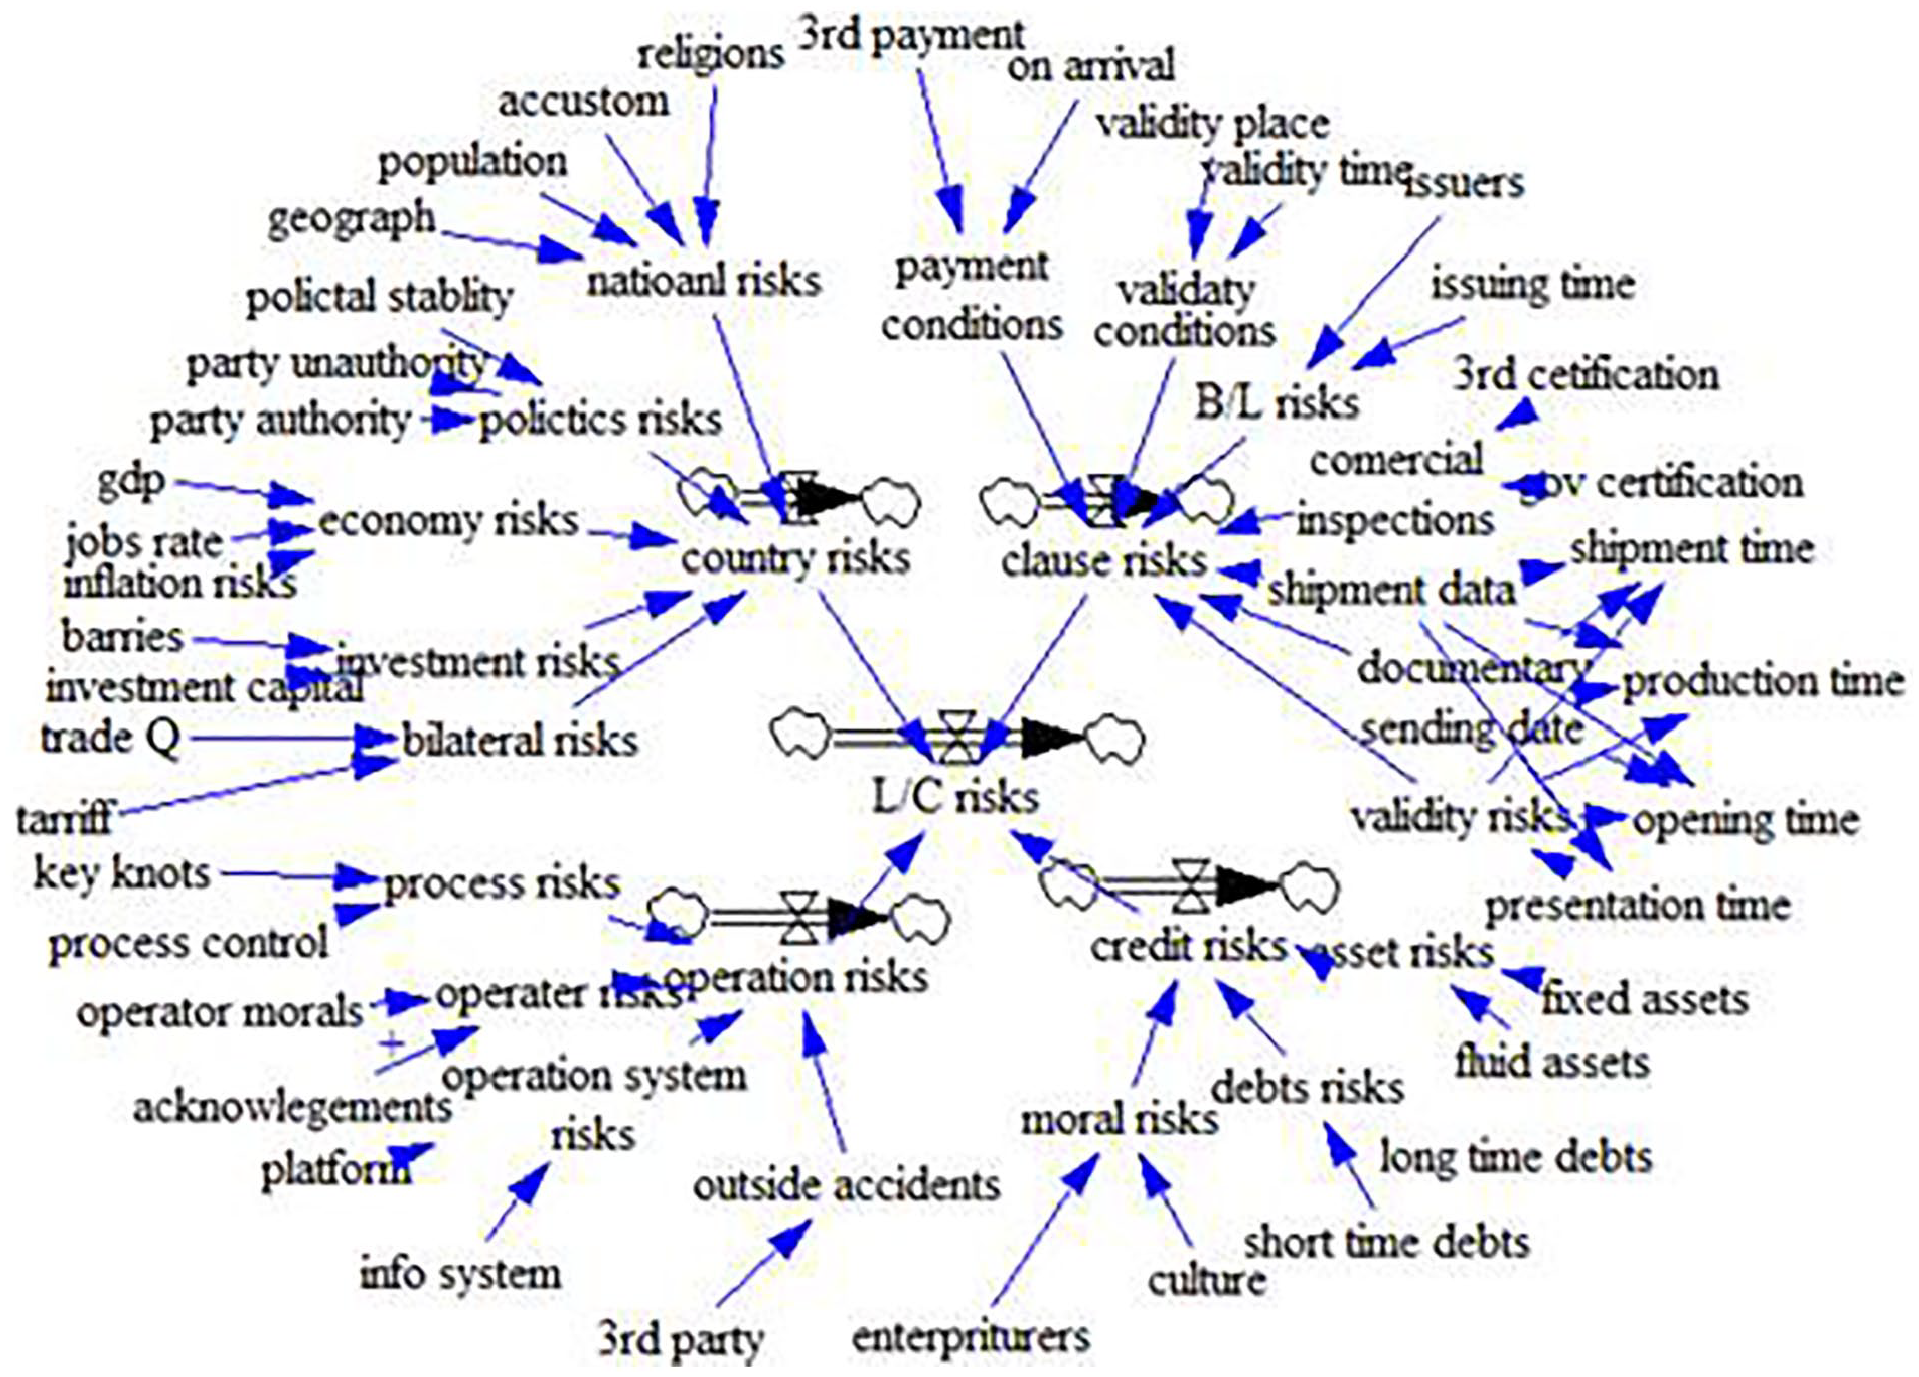
Figure 5 clearly shows the construction characteristics of the entire factor system of L/C settlement risks. Furthermore, the interaction principle and the polar relationship among the factors are illustrated.

Causes tree of the L/C risk system.
B. Drawing the system flowchart based on the causal tree of L/C settlement risks using VENSIM.
Using the causal tree, the relationships between variables are resolved, and the risk factors are organically linked up through holes, flow variables, variables, and auxiliary variables, among others.
Figure 6 clearly maps the relationships among the holes, flow variables, variables, and auxiliary variables in the flowchart of the L/C risk system, and thus lays the foundation for writing the DANAMO equation and carrying out the system simulation in the next step.
System flowchart of L/C risks.
C. Simplified names of the parameters in the VENIM system flowchart: country state risks—GJK, custom risks—XSR, population risks—RKR, religion risks—ZJR, political state risks—ZZR, risks caused by the state of the ruling party—ZZD, risks caused by state of the out-of-the-power party—ZYD, political stability risks—ZZW, economical state risks—JJR, employment rate risks—JYR, gross domestic growth (GDP) growth rate risks—GDPR, inflation rate risks—THR, investment state risks—TZZ, investment barrier risks—TZB, bilateral investment amount risks—SBT, trade risks—JMG, trade barrier risks—MYB, bilateral trade amount risks—SBM, asset risks—ZCR, fixed asset risks—GDR, current asset risks—LDR, liability risks—FZR, long-term liability risks—CQR, short-term liability risks—DQR, moral hazards—DDR, enterprise culture risks—QYW, entrepreneur quality risks—QQJ, terms of payment risks—FKT, risks caused by the requirement of being on the third party’s payment—DSF, risks caused by the arrival of cargo requirement—HDF, take-effect condition risks—SXT, take-effect place requirement risks—SXD, take-effect time requirement risks—SXS, B/L risks—TDF, B/L issuing date risks—TDR, B/L issuer risks—TDC, inspection risks—SJF, official inspection certificate risks—GFS, the third-party inspection certificate risks——DSF, shipment preparation period risks—ZCQ, validity period risks—YXQ, document preparation period risks—JDQ, production time risks—SCR, opening risks—KZR, shipment date risks—ZCR, document presentation date risks—JDR, operation process risks—CZL, process control risks—LCK, process node risks—LCJ, operator risks—CZR, moral quality risks—DDP, professional quality risks—YWS, external event risks—WBS, the third-party event risks—DSS, operation system risks—CZX, operation platform risks—CZP, information system risks—XXX, national risks—GJR, enterprise credit risks—QYC, clause risks—TKR, operation risks—CZR, and L/C risks—XYZ.
D. Writing the corresponding DYNAMO equations based on the quantitative relationship of the system flowchart


(其中 e1, e2, e3 . . .; f1, f2, f3 . . .; g1, g2, g3 . . .; h1, h2, h3 . . .; i1, i2, i3 . . .; j1, j2, j3 . . .; k1, k2, k3 . . .)
Simulation Analysis of System Model
A. Assumptions of the system model.
To directly understand the fluctuations of the L/C settlement risk system, we simplify the system and formulate various assumptions:
(i) It is assumed that all participants in the L/C settlement system are rational, economic persons, in the pursuit of payoff maximization under equal risk conditions.
(ii) The initial target values for the parameters in the L/C settlement subsystems and their corresponding lower levels are all 0 and except for the fluctuations of three factors (risks of ruling party state, political stability, and the short-term liability) conform to different distributions.
B. Simulation analysis of the L/C settlement risk system.
The simulation analysis is conducted by computing:
Initial settings:
Units: Month
The final time for the simulation
INITIAL TIME=0
Units: Month
The final time for the simulation
SAVEPER=TIME STEP
Units: Month [0,100]
The frequency with which output is stored
Time STEP=1
Units: Month [0,100]
The time step for simulation
Figures 7 to 10 display the fluctuations of risk factors on Hierarchy D—fluctuation of the ruling party state risk (Figure 7) and fluctuation of the political stability risks (Figure 8)—that conform to different distributions, and their interaction will result in the fluctuation of the risk factor on Hierarchy C—fluctuation of political state risks (Figure 9). Furthermore, the fluctuation patterns of the risk factor on Hierarchy B—the national risk (Figure 10), the risk factor on hierarchy C—political state risks (Figure 9), and the risk factors on hierarchy D—the ruling party state risks (Figure 7) and the political stability risks (Figure 8), are, to a limited extent, similar in that they have some internal connections; however, they also present differing fluctuation amplitudes and peaks. This indicates that the system risks are influenced by both the agglomeration and the dispersion effect.
Fluctuations of the ruling party state risks.
Fluctuations of the political stability risks.

Fluctuations of political state risks.

Fluctuations of national risks.
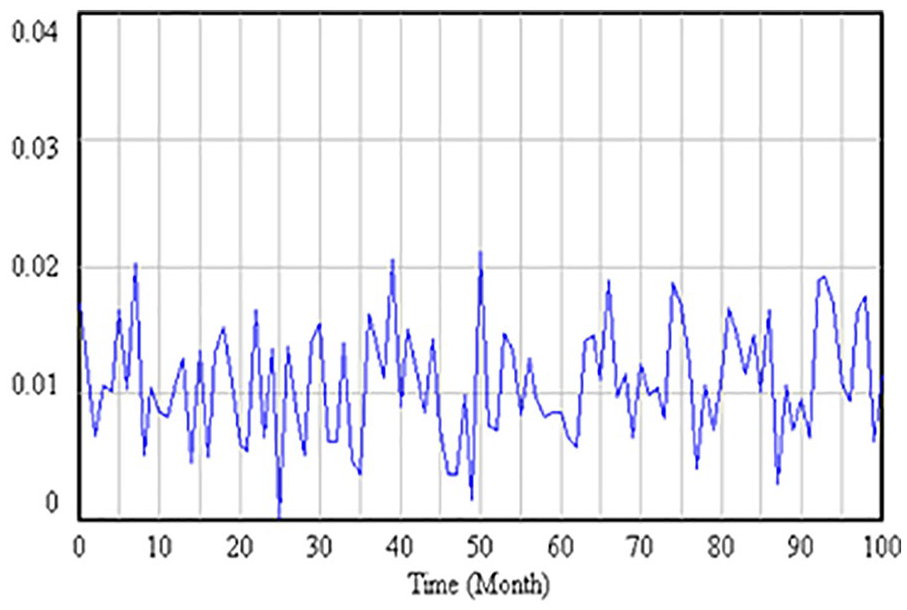
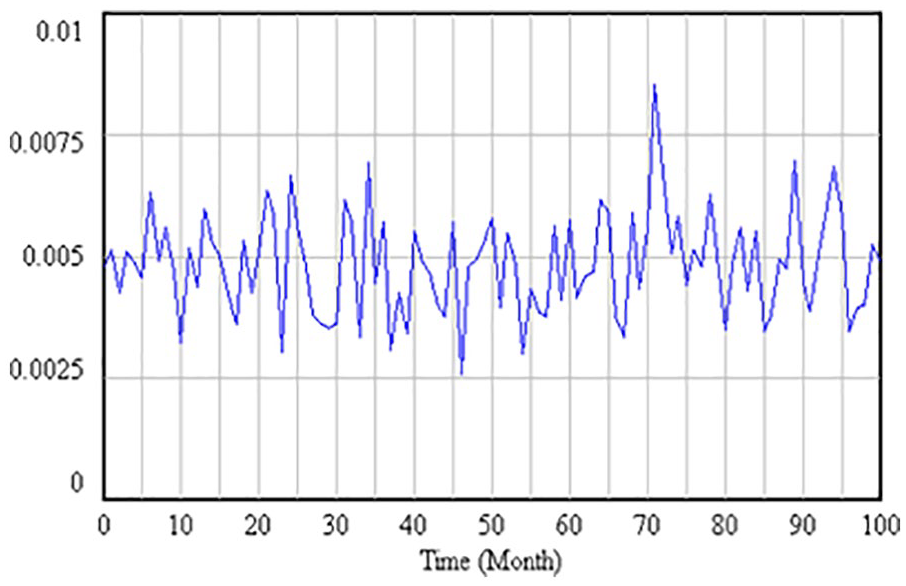
Figures 11 to 14 display the fluctuations of the Hierarchy D risk factor—short-term liability risks will affect fluctuations of the enterprise credit risks, which will, in turn, affect the fluctuation of the Hierarchy A risk factor—L/C risks. Their fluctuation patterns are at times similar while at others different (especially in the fluctuation amplitude and peak, where they have obvious differences). Based on the fluctuation of the Hierarchy A risk factor—L/C risks (Figure 14), system risk analysts can determine the timing of risk controls by observing the peak areas of the system. For example, the peak values may appear at the seventh month, the 20th month, the 27th month, the 37th month, the 43rd month, the 60th month, the 68th month, the 76th month, the 82nd month, the 89th month, the 92nd month, the 95th month, and so on. Thus, on these nodes, the enterprises, or financial institutions, should be prepared in advance to take risk prevention measures.

Fluctuations of short-term liability risks.

Fluctuations of liability risks.

Fluctuations of enterprise credit risks.

Fluctuations of L/C risks.
Through the simulation results of L/C settlement system risk fluctuations, it is evident that these can be caused by changes in any tiny risk factor on each system hierarchy. The final risk fluctuations present differences in their magnitudes and directions only because these reaction functions and conduction mechanisms differ. Therefore, when assessing the L/C settlement risk system, it is important that attention is paid to the changes of the risk factors on each hierarchy together with the risks among subsystems. When the L/C risk is about to reach a peak, a variety of prevention and control measures should be implemented. For instance, export credit insurance–based methods to prevent L/C settlement risks can be instituted to ensure that the systemic risks are effectively controlled when they occur.
Conclusion
Clearly, L/Cs have many advantages. In international settlements, however, they also have the drawback of being relatively complex to apply, with differing risk assessment techniques and high-risk control requirements. Based on, yet distinct from, previous qualitative research, this quantitative research method was developed. Through introducing an innovative method for dealing with the challenges of L/C risks in a visible and quantitative manner, the current findings may serve to promote more successful discussion between parties engaged in international business activities.
The methods used in this study, nonetheless, do have their limitations, involving the selection of the common risk factors and building of DANAMO functions based on a finite set of groups, as defined by a limited range of experts. These two methods might also be combined with the effective Decision-making Support System (DSS) online, and thus yield more accurate results. The sole use of the methods described in this study may not yield their full potential. Therefore, in future studies, it is suggested that multiple connections of EFA, SD with DSS, should be built, and further reputable L/C experts worldwide are invited to contribute via the internet. According to the contributions of those experts, companies who need to assess, judge, and control L/C would incur appropriate fees for use of this platform of EFA and SD with DSS. This may yield multiple win-win solutions for international business practice.
Footnotes
Declaration of Conflicting Interests
The author(s) declared no potential conflicts of interest with respect to the research, authorship, and/or publication of this article.
Funding
The author(s) disclosed receipt of the following financial support for the research, authorship, and/or publication of this article: This research was supported by the (1) National Social Science Fund (No. 20FJYB063) and (2) Yangtze Normal University Research Fund (No. 20170037).