
Abstract
This work aims to describe how the insolvency of a firm affects other business creditors. Through a sample of small and medium entities in Catalonia for the biennium 2004–2005, the situation of creditors before and after the legal event (insolvency proceedings) has been studied. The results confirm the existence of a substantial change in the composition of the financial structure of these firms (substitution of long-term debt by short-term debt; decrease in solvency and profitability, increase in financial charge, among others) and, therefore, the contagion of liquidity problems. The study covers 2 years before and after the insolvency and is dynamic in the sense that it highlights how the creditors change their source of finance and the ending situation. The main contributions of the object are the effect of insolvency on other companies closely related and also the technique used—multidimensional scaling.
Introduction
This study deals with the contagion effect that occurs due to insolvency. In our case, we examine the bankruptcies of debtors that do not repay their debts. The financial statements of the creditor companies affected by the insolvency situation are analyzed.
Companies are constantly evolving in an environment of business risk. Part of this risk consists of the credit risk and uncertainty about the possibility of collecting a future commercial debt. This default in payment, which is understood as delinquency, is intrinsically associated with a probable loss (García & Gutiérrez, 2005), with the consequent damage to the company’s results.
Brachfield (2006) argues that delinquency can have disastrous consequences for the good performances of those creditors that have been surprised by the entry into bankruptcy of any of their debtors. The reason is that this event limits the regular financing of a creditor’s currency and results in important changes to its profitability, liquidity, and degree of indebtedness (to name a few examples).
The Statistical Institute of Catalonia (IDESCAT) (2007) established that in recent years, 50.8% of the companies that were born in Spain did not last 5 years. Late payments and lack of business training are two main threats. In turn, the Plataforma Multisectorial de Lucha contra la Morosidad (2010) adds that the first cause of insolvency between companies (67% of business closures that have occurred since 2007) is a late payment that has left them without liquidity and with treasury problems.
Therefore, the main objective pursued in this work is to determine whether there is a deterioration in the economic-financial situation for a sample of companies that are all part of the list of creditors of others who have undergone a bankruptcy at a certain time. We consider companies in Catalonia that submitted a creditors’ file during the 2004–2005 biennium. To observe the desired impact, we constructed a database (309 companies) to conduct an analysis of the annual accounts of five consecutive periods: the year of entry in tender, the two previous years, and the two subsequent years.
The main contribution of this work lies in showing empirical evidence of the economic-financial deterioration of creditors caused by insolvency of some clients who have entered bankruptcy. The sample of companies used in this research are commercial creditors of the insolvent clients from 2004 to 2005.
The rest of this article is structured as follows: In section “Literature Review,” we give a review of the previous literature that addresses the problem of the domino effect to frame our research; section “Data and Method” describes the methodology applied to the analysis of the data. In section “Results,” the results are presented. Sections “Discussion” and “Conclusion” develop the discussion and finally the conclusions on the research and the topic studied.
Literature Review
To establish the theoretical framework for our research, it is important to highlight a series of extremely interlinked concepts. The first concept is the domino effect in the economic-financial field; it entails a series of situations that occur in a chain in which one is usually a consequence of the other. We refer especially to the credit risk that we assume when we sell or make a provision of services, and because we do not charge cash, the insolvency situation that a debtor may enter could end in business failure. The scientific literature already points to a close relationship between these concepts and the economic-financial costs associated with them (Box et al., 2018; García-Apendini, 2014; Schönfeld et al., 2018).
In terms of the credit risk, Schmalenbach (1953) argued that credit sales revenues are associated with presumed loss due to insolvency that is derived from the loans granted without any indication of default. This author describes the experience accumulated by the same company from the loss ratio of commercial loans. Cea (1995) adds that this debt deferral is intrinsically associated with credit risk, and a potential loss suggests a priori a negative financial impact on the financial statements of the creditor companies. Calvo and Bonilla (1999) define credit risk as the possible loss assumed by an economic agent due to a breach of the contractual obligations of the relevant parties. Along the same lines, Garrido (2000) states that a customer credit policy involves quantifying the cost of financing sales and taking on the risk of possible losses due to the final insolvency of one or more of the customers. García and Gutiérrez (2005) maintain that a nonpayment originates a loss for the creditor company that includes not only the amount not recovered but also the expenses incurred in the process. Jiménez and Saurina (2006) offer evidence of a positive relationship between the rapid growth of credit and future delinquency ratios. Jacobson and von Schedvin (2015) explore the importance of commercial credit chains for the propagation of corporate failures. As a database, they used commercial creditors on debtors who have gone bankrupt in Sweden. The study shows losses caused by the contagion effect. These losses resulting from financial restrictions imply greater indebtedness, especially in the short term. Lamieri and Sangalli (2019) study commercial credit as the key source of the contagion effects in the 2009–2013 post-economic crisis period for a sample of 12,000 Italian manufacturing companies. The study shows financial and liquidity imbalances of the sample. This evidence sheds light on the importance of moving away from a static view of the commercial credit phenomenon and integrating solvency models with specific information on business-to-business transactions increasingly available through the compilation of large databases.
Regarding insolvency and business failure: To the already seminal works of Altman (1968, 1977) and Beaver (1966) of the 1960s–1970s, we can mention, among others, Edminster (1972), Blum (1974), and Deakin (1977). These three contributions compose the classic compilations in the literature on business insolvency prediction, whose main contribution is to diagnose in good time the state of economic-financial health of companies and show the consequent negative repercussions for their creditors. These works compose the formal basis of this article.
From the 1980s–1990s, many authors, including Ohlson (1980), Altman et al. (1981), Zavgren (1983), Theodossiou (1996), Lizarraga (1998), and González Pérez et al. (1999), have used previously published works in prediction models to delve into some aspects of this topic and give new perspectives. These more recent articles incorporate new models of prediction, comparisons of models, or methods and definitions without abandoning the adverse effect that the insolvency or business failure of the debtor company produces for its creditors.
More recently, with the new era of information and the greater ability to collect data, works of this type have been further refined in the study of insolvency prediction, business failure, and associated costs. González and González (2000) directly assume the insolvency costs for the creditors in the insolvency proceedings when comparing companies that resolve their financial difficulties under judicial supervision, as opposed to those that reach private agreements with their creditors. García and Gutiérrez (2005) incorporate the concepts of cost and loss associated with the risk of insolvency or failure. The default causes a credit loss or expected loss for the entity, which includes not only the unrecovered capital but also the expenses incurred in the process, which induces this economic-financial contagion that reverberates negatively in the financial statements.
From our review of the scientific literature, it can be deduced that the majority of researchers do not differentiate greatly between insolvency and business failure. However, researchers do point out the administrative costs associated with both events, that is, the time and resources used in judicial proceedings when a bankruptcy situation occurs and the negative repercussions these events have for the creditors in the debtor businesses’ financial statements (Čámská, 2016). In this line, Eklund et al (2018) research on protecting creditors who have been surprised by a bankruptcy of one of their clients. The study raises the problem that government institutions, when managing bankruptcies, have to protect the economy. For this reason, it is as much as saying that creditors could see their loans recovered to continue investing in new businesses and to continue creating added value to the economy. In this case, the vision of bankruptcy is understood as a natural component of the life of the company and the market. Gavurova et al (2017) have investigated the same issue in Slovak companies. Thus, a latent domino effect is uncovered.
Finally, the use of traditional financial statements (balance sheets and income statements) is an essential requirement for our objective. Despite this, no less important will be the use of tools to homogenize all this information, such as economic-financial ratios.
In our case, 14 ratios are selected to carry out the study. All of these ratios provide us with the necessary information to explain the evolution of liquidity, indebtedness, and profitability. We derive explanatory variables that will help us explain the phenomena studied following the example of Lev (1974), Foster (1986), Bernstein (1989), Downes (1991), Cañibano (1991), Altman (1993), Rees (1995), De Andrés (2001), and Rivero Torre (2002).
To deepen the study of the economic-financial evolution of these companies 10 years later, we incorporate some additional variables: the size effect measured through the turnover volume (Chuliá, 1993; García Pérez de Lema et al., 2000; García Vaquero and Maza, 1996; Hernández de Cos and Hernando, 1999) and the credit risk through the rights pending collection (García & Gutiérrez, 2005; Jiménez & Saurina, 2006) and investments (Bayldon et al., 1984; Courtis, 1978; Gallizo, 2005; Laurent, 1979). In addition, we employ all of the variables commonly used in the Balance Scorecard of Kaplan and Norton (1992) to analyze the strategies of companies from a financial perspective.
However, despite the numerous scientific works carried out in this field, it has not yet been possible to establish a theory on business failure or on the factors that determine it. Although there is a relative consensus in the scientific community on the predominant role of accounting information and especially economic-financial ratios as more efficient explanatory variables, there is no clear agreement as to what these ratios are (Becchetti & Sierra, 2003).
If we examine the monitoring of the economic structure indicators of the Statistical Institute of Catalonia (IDESCAT) (2015) with regard to the evolution of companies that have entered into competition in recent years, there is a considerable increase. However, it is true that the emergence of the financial crisis has directly contributed to this boom (Table 1).
Evolution of Companies That Have Entered Into a Bankruptcy Situation in Catalonia During the Period 2004–2015.

Data and Method
Data
The data set is based on the information contained in the Mercantile Courts of Catalonia. From this source, it was found that 173 companies (100% of the population) faced a bankruptcy situation in the 2004–2005 biennium.
The study focuses on a database prepared by the authors who analyzed using the creditors of these 173 bankrupt companies. The file of each 173 bankrupt companies was observed and focuses on the list of creditors.
Thus, the sample that meets two requirements was obtained: Each company must be a commercial company (not financial entities, public institutions, or foreign companies) (Jacobson & von Schedvin, 2015; Lamieri & Sangalli, 2019) and must have an outstanding balance of more than €50,000. With these criteria, we obtain 309 companies. The reason for establishing this lies in the fact that 77% of the sample of 309 companies (i.e., 238 companies) had a debt pending collection of €50,000 to €100,000.
The selection of the 2004–2005 biennium is justified by the limitations for the years prior to 2004 as well as for the years after 2005. Regarding the years prior to 2004, it is difficult to compile a solid database with sufficient guarantees, as the information on the bankrupt companies was disseminated by different courts without a centralized file. The bankruptcy law (22/2003 of July 9) appeared in mid-2003, and with it came the creation of the courts of the mercantile to rule on these issues. It was not until fiscal year 2004 that real and concentrated information on the bankruptcy situations was presented. To analyze the financial situation for the 2 years after the contest, there is a barrier based on the difficulty of obtaining comparable information due to the appearance of the new general accounting plans (Royal Decrees 1514/2007 and 1515/2007), which came into force on January 1, 2008.
The data used to carry out the economic-financial valuation for the five periods have been calculated from the information included in the balance sheets and the profit and loss accounts. We obtained these records through publications in different Commercial Registries, and they were prepared through the Iberian Balance Sheet Analysis System (SABI) database.
The variables liquidity, profitability, and indebtedness are the objects of study in the 14 economic-financial ratios chosen in this research article (Table 2).
Economic-Financial Ratios Used in This Research Work.

Source. Self-made.
In the realization of this work, we have encountered some limitations in the database: We obtained 100% of the companies in Catalonia that faced a bankruptcy situation during the 2004–2005 biennium. When we analyzed all of their files individually, we found 552 that met the requirement to maintain a collection right with the common debtor of over €50,000. Only 309 companies out of 552 (i.e., 56%) fulfilled their obligation to deposit annual accounts during the 5 years in question. The other 243 companies (the remaining 44%) either did not meet this obligation in any of the 5 years requested or did not have any records.
The majority of companies in the sample (89%) were not required to submit to an audit, which affects the reliability of the published data.
Empirical Strategy
Therefore, the proposed hypothesis is as follows:
We use positional multivariate statistical techniques to order, analyze, and represent a set of data; the goal is to properly describe the characteristics of the 309 companies through 14 economic-financial ratios and in five consecutive periods. We selected the technique of multidimensional scaling (MDS), which has been widely applied to accounting science (Garcia Ayuso, 1994; Green & Maheshwari, 1969; Kruskal, 1976, Kruskal & Wish, 1978; Libby, 1979; Mar Molinero & Serrano Cinca, 2001; Neophytou & Mar Molinero, 2004; Pratt, 1982; and, more recently, Padhi et al., 2012; Sagarra et al., 2013; Sarlin, 2013; Tenreiro & Mata, 2013).
The graphical representation we obtained shows the similarity of the observations we analyzed (i.e., the companies) according to their representative variables (i.e., the ratios). The observations are located on the map in the form of points. When the distance between the points is small in the representation obtained from the MDS, the structures of their data are similar (Fernández Gómez, 2006).
The MDS technique is combined with the application of the Property Fitting (PROFIT) methodology. The background of the application of this technique together with the MDS in the accounting field is found in the works of Carroll and Chang (1970), Carroll (1972), Green and Rao (1972), Davison (1983), Mora and González (2009), Serrano Cinca et al. (2010), and Sarlin (2013). Through formalized regressions for each ratio and for each period, this technique collects the scores regarding the ratios of each company; with these scores, it finds the best correspondence between each ratio and the perceptual space occupied by them. For this purpose, management vectors that help to interpret the results at an economic level are incorporated.
We cannot focus on the signs because that would lead to error, as the ratios and dimensions can rotate freely without affecting the relative positions of the companies. Instead, we must concentrate only on the following (Hair et al., 2004): (a) the vectors drawn that have an acceptable level of significance in the two mapped dimensions; (b) the different angles shown by these vectors to determine the degree of independence between the variables; and (3) the lengths of these vectors, which will provide information on their importance. The mobility and variability of these vectors throughout the five time periods studied will provide relevant information on the evolution of companies through their economic-financial ratios by illuminating the determining variables that explain the potential economic-financial deterioration during the biennium studied. Therefore, we obtain answers to the stated question.
After describing the characteristics of these 309 companies through 14 economic-financial ratios and analyzing their evolution over the five periods studied, we created a pseudo-panel basis. Through linear regressions, we will determine whether there are signs of contagion and whether these signs are significant among the companies studied. To measure whether there truly is a structural change in the ratios of these credit companies over the five periods, the Chow test is introduced (Cameron & Trivedi, 2010).
Finally, after 10 years with the 309 companies used in the sample, a new panel-type database was prepared. This database complements the data of the 2004–2005 biennium with data of the ratios obtained 10 years later for the 2014–2015 biennium. Through a t test of the means between the two periods, we ascertain whether there were significant changes over time in the main economic-financial ratios chosen.
Results
Multivariable Analysis Descriptive
The combination of dimensions (1,2) is chosen as an example to show the mapped vectors.
In period T1 (Figure 1), which is 2 years before the entry into bankruptcy by one of our main customer-debtors, in terms of the solvency/liquidity ratios, only the vector of the R3 ratio (the technical solvency) associated with the DIM_2 dimension is significant.

Graphical representation of the PROFIT analysis for the combination of dimensions (1,2) in period T1.
The debt ratios R4 and R6 show a positive relationship. From now on, when we refer to a “positive relationship,” we mean vectors with the same direction and the same interpretation. On the contrary, when we refer to a “negative relationship,” we are referring to vectors with the same direction and the opposite interpretation. The vector of R4 (the short-term debt) is much longer than the vector of R5 (the long-term debt), which shows a greater weight of short-term financing with respect to the total indebtedness.
We see that whereas R3 (the technical solvency), R4 (the short-term indebtedness), and R6 (the total indebtedness) are associated with the DIM_2 dimension, we have a positive direction for R3 and negative directions for R4 and R6. This causes the vectors to show a negative relationship. Therefore, liquidity and indebtedness follow opposite paths as we go into debt. Furthermore, in the short and long terms, this indebtedness does not translate into liquidity for the company, as it serves to pay the current debt.
Because the profitability ratios are orthogonal with respect to the liquidity and indebtedness ratios, they are independent, that is, they follow their own evolution regardless of the level of treasury and financial leverage.
In period T2 (Figure 2), 1 year before the entry into tender, the vector of the technical solvency ratio R3 disappears (the technical solvency) and no liquidity ratio is shown. Therefore, this variable is not significant in the space we are analyzing (DIM 1,2) for period T2 and has no economic significance with respect to the other ratios.
Graphical representation of the PROFIT analysis for the combination of dimensions (1,2) in period T2.
Regarding the debt ratios, ratios R4 (the short-term debt) and R6 (the total debt) continue to show a positive relationship with very long vectors. Companies need financing to deal with their debts, and they will seek it quickly, as short-term financing lines tend to be smaller and easier to obtain than long-term financing. Therefore, this increase in short-term financing increases the total debt ratio (R6).
It should be noted that in this second period, the vector of R8 (the weight of the financial burden on sales) appears with a segment of short size and is currently insignificant.
In period T3 (Figure 3), the year of the contest, the vector of R1 (the short-term liquidity of the company) appears for the first time, and the vector of R3 reappears again (the technical solvency); both vectors are associated with the dimension DIM_2. The two previous ratios have this feature: In their calculation, they incorporate the outstanding debt in their numerator. In addition, the vector of R2 (the immediate availability) that only and exclusively measures the availability of cash in the company still does not appear.

Graphic representation of the PROFIT analysis for the combination of dimensions (1,2) in period T3.
It should be noted that the vector of the R7 ratio (the quality of debt) appears for the first time, which indicates the growing evolution of short-term debt for the group of companies studied. The lack of liquidity has resulted in an increase in the short-term debt, which is mainly motivated by the imperative need for companies to satisfy their short-term debts to continue operating.
The problem of a lack of liquidity due to the failure to collect part of the clients’ debt does not translate into a negative effect on the profitability because the firms remain intact.
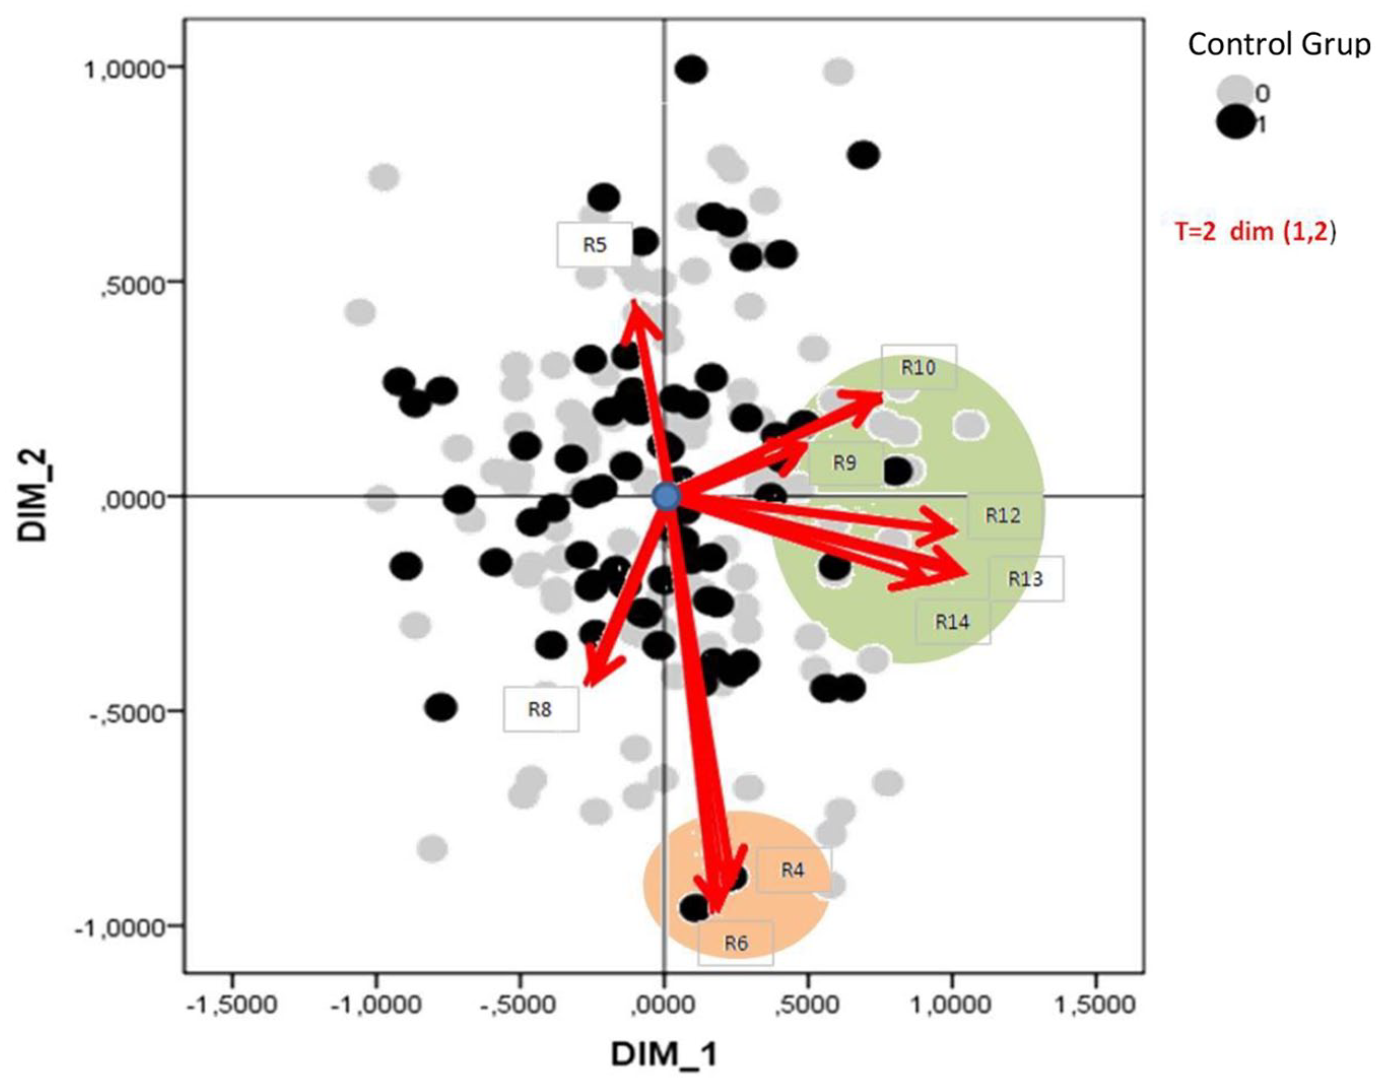
In period T4 (Figure 4), which is 1 year after the contest, all of the indebtedness ratios continue to appear, just as they appeared in the previous period. In addition, these ratios show greater activity, which is the result of this constant need for financing for firms to be able to face their debts.

Graphical representation of the PROFIT analysis for the combination of dimensions (1,2) in period T4.
However, it is important to emphasize that the vector of R8 (the percentage of the financial burden on sales) has considerably decreased its size with respect to the previous periods. We interpret this change in the sense that the weight of the financial burden has reached its maximum point and companies do not need additional financing beyond their operational needs.
In this period (Q4), significant differences are detected for the first time between the profitability ratios affected by the financial burden due to external financing with respect to the same quantity calculated before interest. Still, all of the ratios show margins and positive results.
Finally, in period T5 (Figure 5), 2 years after the contest, an especially significant event occurs: All of the vectors associated with the solvency/liquidity ratios appear again. The three ratios R1 (the short-term liquidity), R2 (the immediate availability), which is drawn for the first time, and R3 (the technical solvency) have very extensive and significant vectors. The fact that the R2 ratio’s vector appears for the first time is particularly relevant. This ratio measures the immediate availability of treasury resources, and it indicates that after 2 years of having passed a bankruptcy to their client-debtors, companies return to normal with respect to the availability of treasury resources.
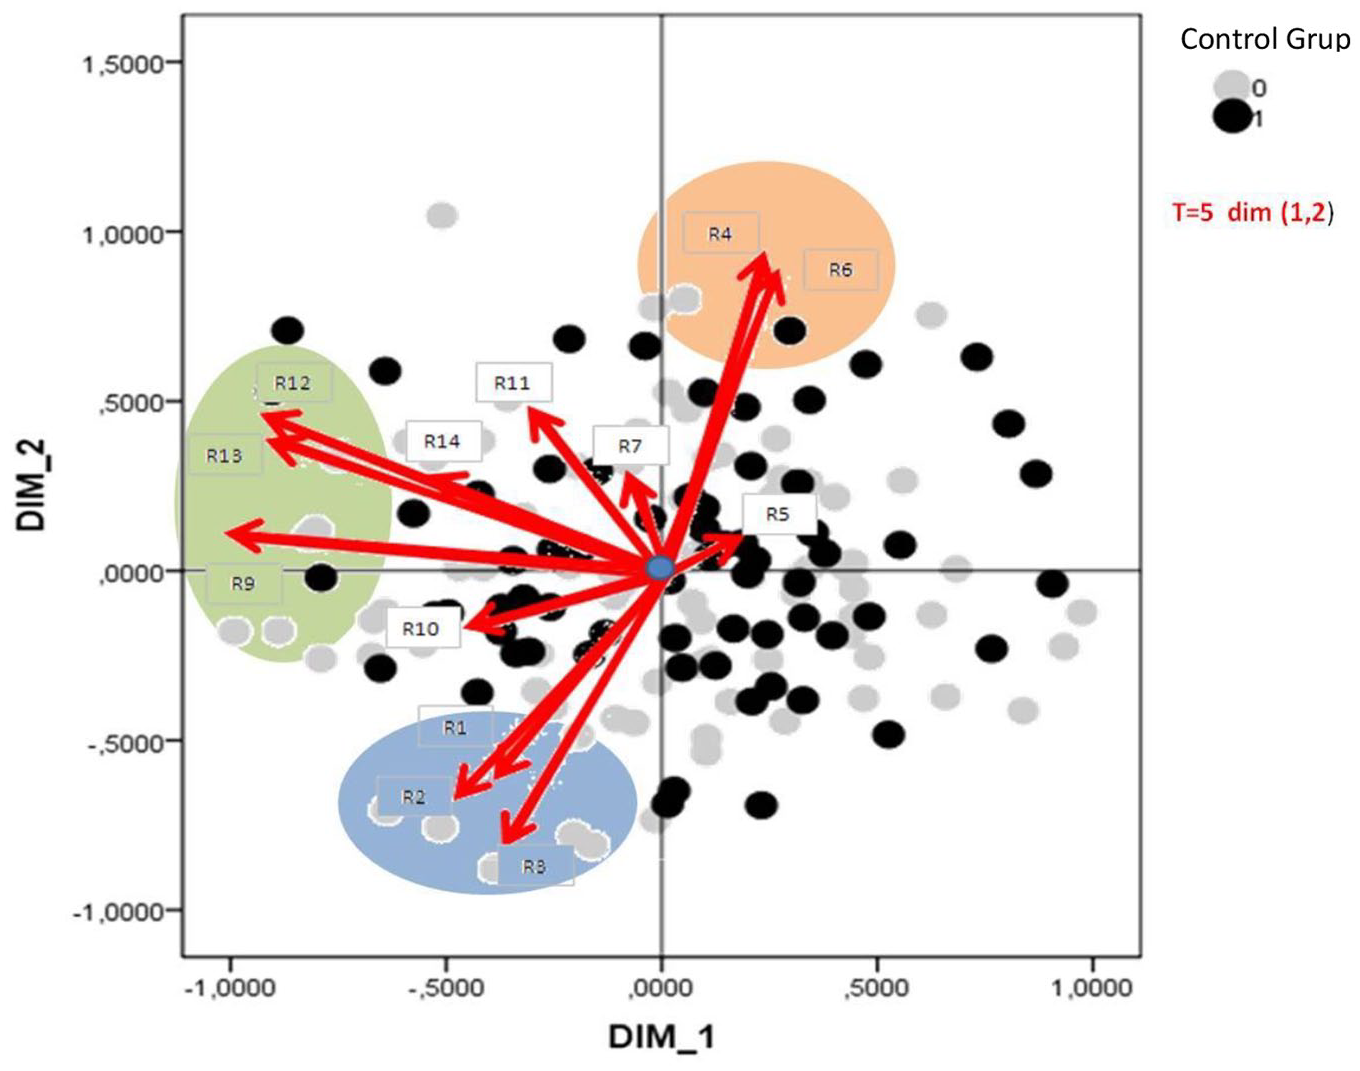
Graphical representation of the PROFIT analysis for the combination of dimensions (1,2) in period T5.
In terms of the debt ratios, the disappearance of the graph of the vector for R8 (the percentage of the financial burden on sales) is particularly significant. This alteration corroborates the fact pointed out in the previous period where a significant reduction in the mapped vector was already envisaged, which we interpreted as this burden having reached its peak.
To conclude this section, and as a summary, we incorporate Figure 6. In this figure, the combination of dimensions (1,2) are grouped in a single graph for the set of five periods (Ti), where “i” is a number between 1 and 5 that depends on the period represented. Moreover, the displacements suffered by the set of three groups of ratios are shown to highlight the changes of relative position among them. We observe that the liquidity ratios (Trajectory 1) and the indebtedness ratios (Trajectory 2) follow opposite trajectories, as has been described in the individual graphs by period. In contrast, profitability (Trajectory 3) moves in circles and independently of the other ratios. It should be noted that for period T3 (with the contest year and highlighted circles in bold), all of the vectors are located in the quadrants to the left of DIM_1.

Graphical representation of the PROFIT analysis for the combination of dimensions (1,2) for the set of five periods.
We would like to clarify that the trajectories are drawn as a guideline but without specific meaning; inasmuch as we have not defined the dimensions, we cannot give an economic sense to the results. Nevertheless, the trajectories reinforce the coherence of the study, validate the conclusions we obtained, and could help in the future to begin new lines of research in locating new companies with similar characteristics.
Econometric Analysis
Through the MDS analysis, we select the most significant ratios that explain the general behavior of the family of ratios to a greater extent. These ratios are R2 (the solvency/liquidity), R7 (the indebtedness), and R12 (the profitability). With these ratios, we analyze through a panel of companies the relationships that exist with respect to the other ratios, and we take as references those relationships that have shown significant data in the linear regression analysis. The objective is to determine whether there are structural changes in the given time within the set of 309 companies we have analyzed. Specifically, we examine whether there is a structural change in the two post-contest periods (Periods 4 and 5) with respect to the three previous periods (the year of the contest and the two previous ones).
In Table 3, as there are a large amount of data (309 companies, 14 economic-financial ratios, and five studied periods), a pseudo-panel basis is created. Through linear regressions, the authors analyzed whether there are signs of contagion and whether these are significant among the companies studied. In the Chow test, the authors analyze the dependent variable of the R2 ratio, and this will indicate whether there is structural change (Cameron & Trivedi, 2010) in the 309 creditor companies throughout the five periods. The significant results explain the evolution of the ratio largely, which present a confidence level of 99% (***) or 95% (**). The same criteria have been established in Table 4 for the R7 ratio and in Table 5 for the R12 ratio.
Chow Test for the R2 Ratio Immediate Availability (Solvency/Liquidity).

Note. t statistics in parentheses. Tests R44, R45, R54, R55, R64, R65, R74, R75, R84, and R85: (1) R44 = 0; (2) R45 = 0; (3) R54 = 0; (4) R55 = 0; (5) R64 = 0; (6) R65 = 0; (7) R74 = 0; (8) R75 = 0; (9) R84 = 0; (10) R85 = 0. Constraint 5 dropped. Constraint 6 dropped. F(8, 1159) = 1.85. Prob. > F = 0.0641.
Source. Self-made.
p < .1. **p < .05. ***p < .01.
Chow Test for the Ratio R7 Quality of Indebtedness (Indebtedness).
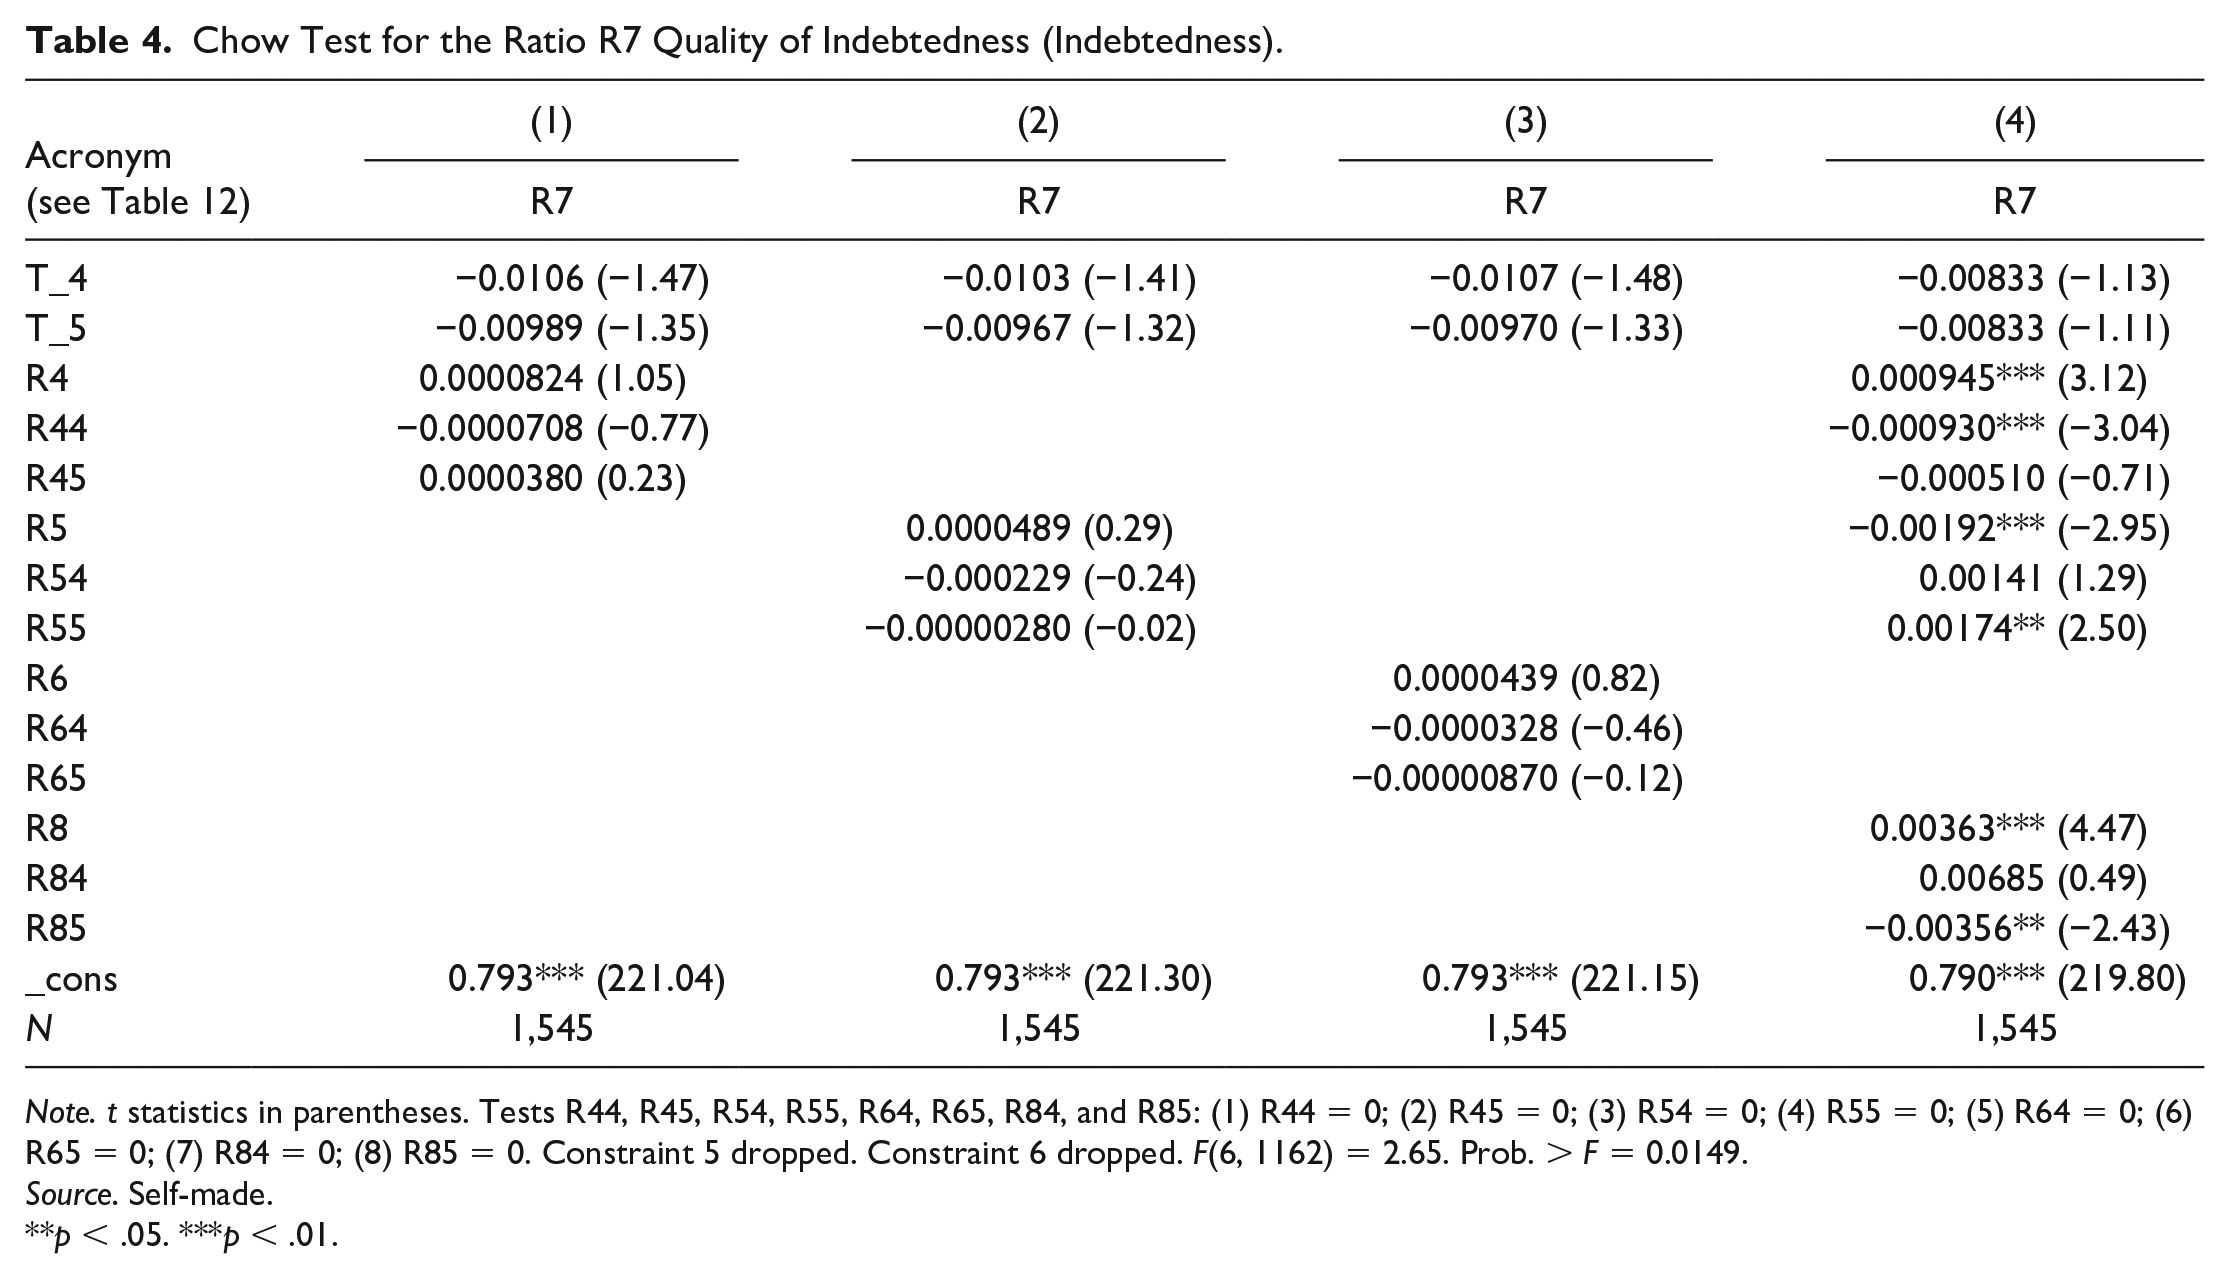
Note. t statistics in parentheses. Tests R44, R45, R54, R55, R64, R65, R84, and R85: (1) R44 = 0; (2) R45 = 0; (3) R54 = 0; (4) R55 = 0; (5) R64 = 0; (6) R65 = 0; (7) R84 = 0; (8) R85 = 0. Constraint 5 dropped. Constraint 6 dropped. F(6, 1162) = 2.65. Prob. > F = 0.0149.
Source. Self-made.
**p < .05. ***p < .01.
Chow Test for the R12 Ratio Profitability of Ordinary Result (Profitability).

Note. t statistics in parentheses. Tests R24, R25, R44, R45, R54, R55, R64, R65, R74, R75, R84, and R85: (1) R24 = 0; (2) R25 = 0; (3) R44 = 0; (4) R45 = 0; (5) R54 = 0; (6) R55 = 0; (7) R64 = 0; (8) R65 = 0; (9) R74 = 0; (10) R75 = 0; (11) R84 = 0; (12) R85 = 0. Constraint 7 dropped. Constraint 8 dropped. F(10, 1156) = 744.43. Prob. > F = 0.0000.
Source. Self-made.
p < .1. **p < .05. ***p < .01.
Ratio R7 (the quality of indebtedness) is significant for periods T1, T2, and T3 and maintains a negative correlation with respect to the dependent variable, namely, ratio R2; as R7 increases, R2 decreases, that is, when the short-term debt increases, the availability of companies decreases. In addition, ratio R8 (the financial burden on sales) is also significant, as it maintains a negative correlation with ratio R2. By increasing the financial burden in the form of the interest that the company has to pay, the availability of companies decreases.
Through the Chow test, we observed the following for the dependent variable: For the R2 ratio, there is a structural change in periods T4 and T5 (the 2 years after the contest) with respect to period T3 (the year of the contest) and the two previous ones T1 and T2.
Ratio R4 (the short-term debt) shows a meaningful level of significance in the five periods studied. Still, a positive correlation is observed for the first three periods: As the short-term debt increases, the quality of our total indebtedness worsens. In addition, for Periods 4 and 5, a negative correlation with respect to the dependent variable R7, or the short-term indebtedness, loses prominence and no longer has significant influence on the quality of indebtedness.
In addition, ratio R8 (the financial burden on sales) maintains a positive relationship in the first three periods with ratio R7 (the quality of indebtedness). During this time, as firms increase their debt and their corresponding financial burden, they worsen their debt quality because it occurs in the short term. This relationship is reversed for Period 5, where the debt moves from the short term to the long term.
As with the previous ratio, through the Chow test we also observe that for the dependent variable of the R7 ratio, there is a structural change in periods T4 and T5 (2 years after the contest) with respect to the previous periods.
During the first three periods, R4 ratio (the short-term debt) maintains a negative relationship with the R12 ratio, that is, by increasing the short-term debt, the financial burden has a negative effect on the ordinary results. In contrast, for R4 (the short-term debt) in Periods 4 and 5, the relationship with R12 changes sign because companies react to the higher cost of short-term debt by replacing their short-term financing for the long term. It is well known in the financial world that the cost of short-term debt is usually higher than the cost of long-term debt; hence, the latter does not penalize the operating account as much. This observation is in line with what ratio R5 (the long-term indebtedness) shows in Periods 4 and 5.
In turn, ratio R7 (the quality of indebtedness) is decisive and significant in Period 4, which is the year following the entry into bankruptcy: As R7 increases, R12 decreases. The increase in the quality of indebtedness causes a negative effect on the economic results.
Finally, as occurred with the previous ratios, through the Chow test we observe again that for the dependent variable of the R12 ratio, there is a structural change.
Robustness Analysis 10 Years Later
In this section, a statistical analysis is carried out in two stages. First, a symmetrical t test of means is used to compare the arithmetic means of the economic-financial ratios with a period of 10 years of difference (biennium 2014–2015 with respect to the 2004–2005 biennium). Then, by means of a regression model we try to explain the causes of the uncovered differences. As explanatory variables, we use the ratios, the outstanding debt, the investment in assets, and the turnover figure.
In the database of 309 companies that we use in the sample for the 2004–2005 biennium, 10 years later in the 2014–2015 biennium only 186 companies present annual accounts in the respective mercantile registers. This decline represents a loss of 123 companies, which is equivalent to 39.8% of the sample. This change is a real limitation, and the reason for the nonrepresentation is unknown.
Following the criteria used in the previous point, we continue to use and analyze the most significant ratios that explain the general feeling of the selected family of ratios to a greater extent.
The R2 ratio shows that the difference in means after 10 years is not statistically significant (Table 6). Note that when we performed regressions of the variables incorporating the explanatory variables, we found that the “Debt Total” represents significant data for the 2004–2005 biennium with a result of −0.119 and a confidence level of 95%. We interpret this result in the sense that as the outstanding debt increases, the R2 ratio of the immediate availability decreases significantly.
R2: Symmetric t Test for Two Means.

Source. Self-made.
In turn, the variable “Billing” has a result of 0.090 (Table 7) and a level of confidence of 95%. Therefore, those companies that have the highest turnover are those that have improved their availability ratio.
R2: Regressions of the Ratios 10 Years Later and Considering the Explanatory Variables.

Source. Self-made.
**p < .05. ***p < .01.
The R7 ratio shows significant changes between the means (Table 8), which indicates that the average of the ratio for the 2004–2005 biennium is higher than the average of the ratio for the period 2014–2015. Thus, companies were more indebted in the short term 10 years ago when they were in the bankruptcy period, which corroborates the data obtained through the MDS analysis. In that analysis, it was observed that it would take 2 years after the contest for the companies to begin to replace short-term debt with long-term debt.
R7: Symmetric t Test for Two Means.
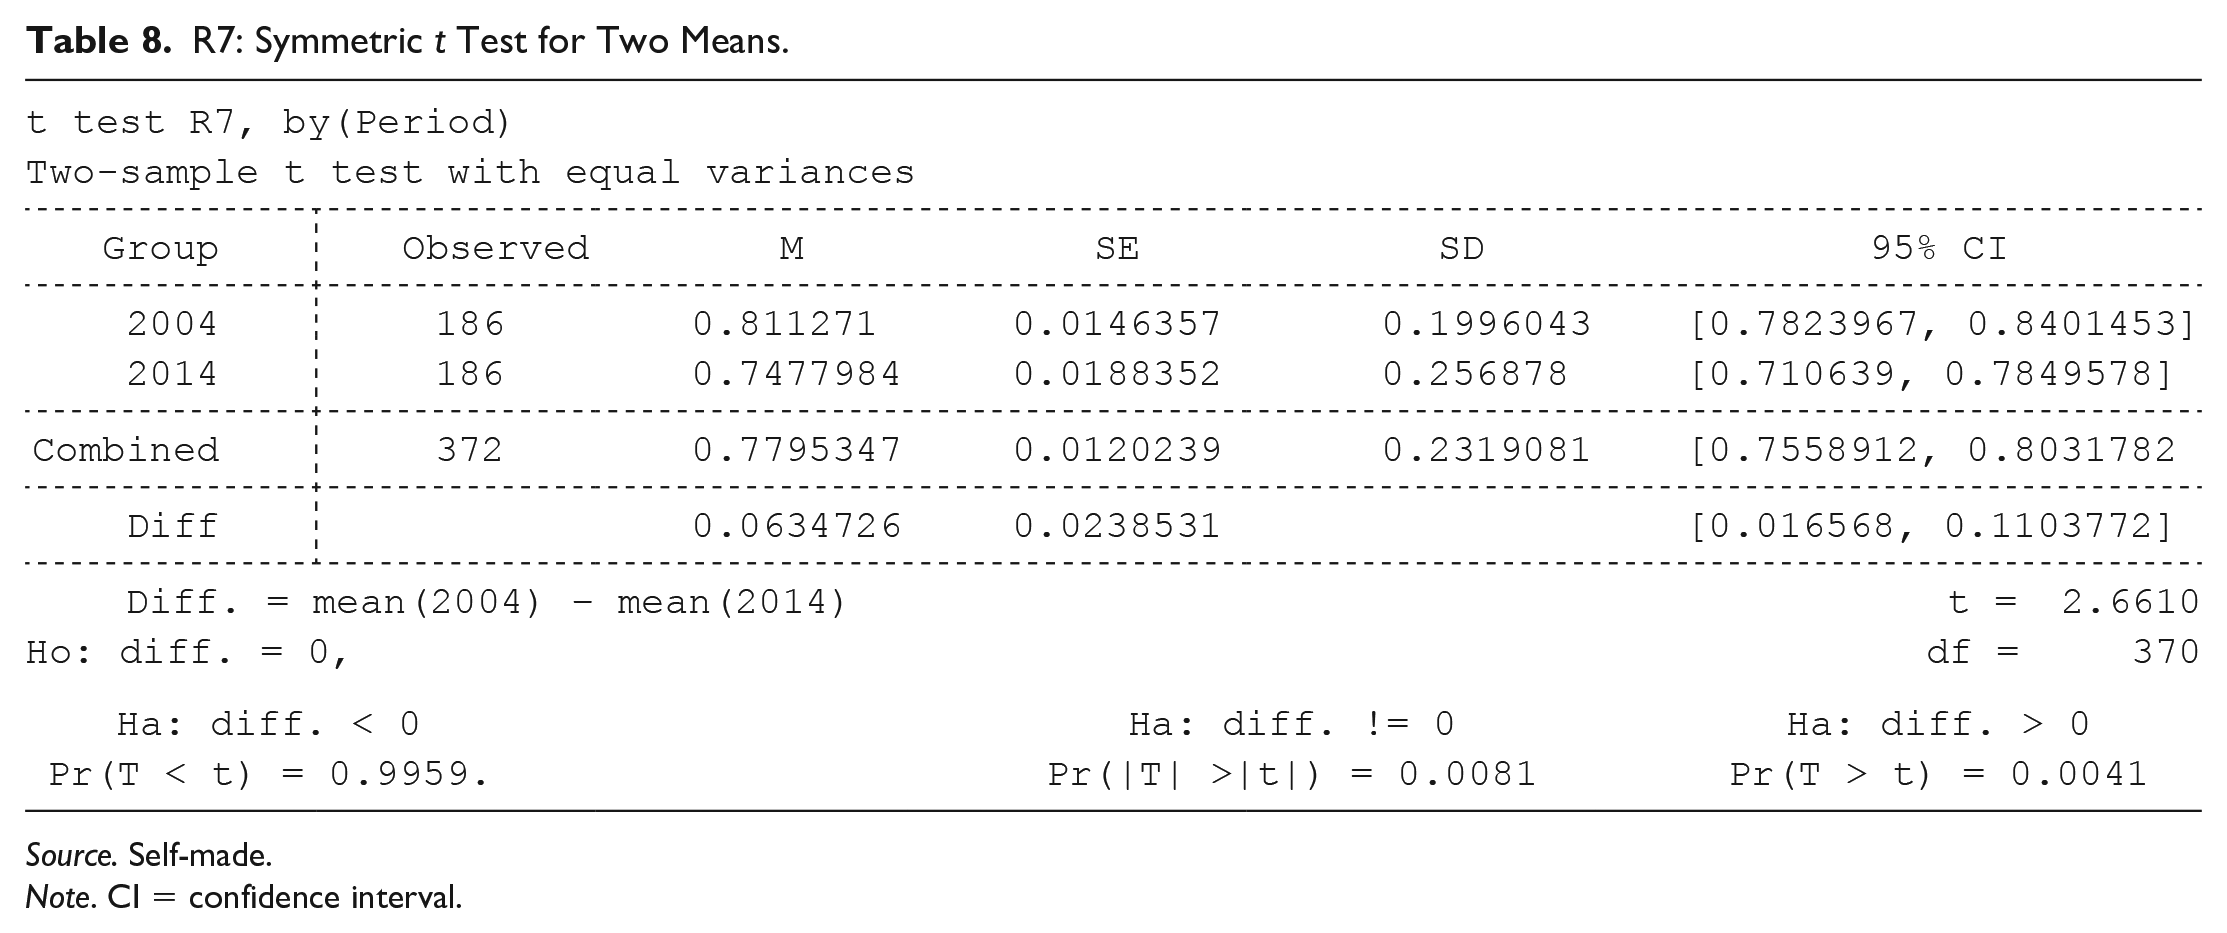
Source. Self-made.
Note. CI = confidence interval.
By incorporating some variables that explain the reason for this variation (Table 9), the variable “Debt total” (0.292) has a confidence level of 99%. That is, the outstanding balance has a positive relationship with the R7 ratio, as the number of companies in the sample increases as we increase our outstanding balance of debt collection.
R7: Regressions of the Ratios 10 Years Later and Considering the Explanatory Variables.
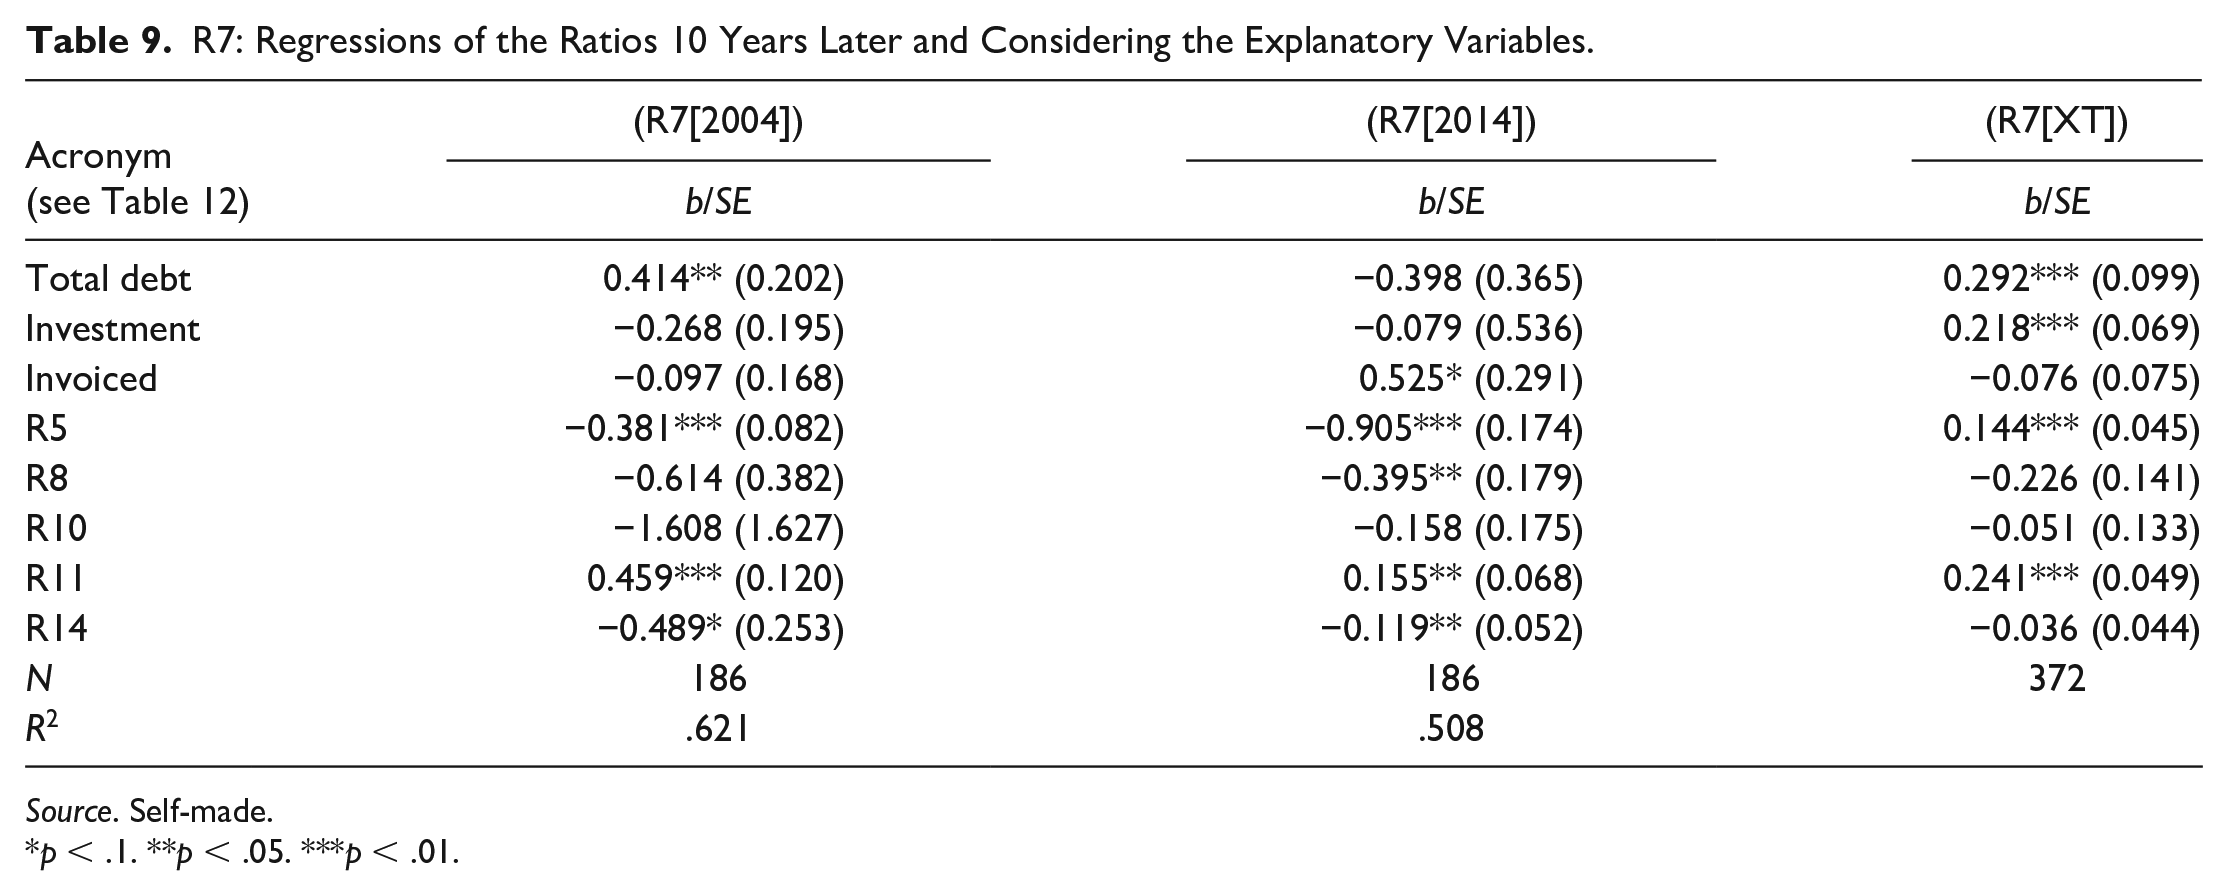
Source. Self-made.
p < .1. **p < .05. ***p < .01.
In addition, the variable “Investment” is also significant with an inverse relationship (−0.218) and the same confidence level of 99%. The higher the level of investment required by companies, the lower the level of short-term debt they present will be.
Two ratios used in the study appear as explanatory factors of these changes. The ratio R5 for the long-term indebtedness explains significantly and with a level of confidence of 99% (−0.144) this difference of means between the two periods. As the long-term debt increases, it is replaced by short-term debt, as we showed in the MDS analysis. The regressions of the ratios already show a level of significance of 1% both for the 2004–2005 biennium (−0.381) and for the 2014–2015 biennium (−0.905).
In turn, the ratio R11 for the sales rotation, which uses the investment in assets for its calculation, indicates with a confidence level of 99% (0.241) that there is a significant difference between the averages of the two periods. We interpret this difference as a higher level of investment and a lower level of short-term indebtedness shown by the companies in the sample, as indicated by the variable “Investment.” This pattern is because smaller companies have greater exposure to risk because they have a more unfavorable debt structure. The regressions of the ratios show a level of significance of 1% for the 2004–2005 biennium (0.459) and a significance level of 5% for the 2014–2015 biennium (0.155).
The R12 profitability ratio does not show at a statistical level (Table 10) any significant differences 10 years later in the sample of the 186 companies that present annual accounts, nor are there significant differences in any of the explanatory variables used to complement the analysis (Table 11).
R12: Symmetric t Test for Two Means.
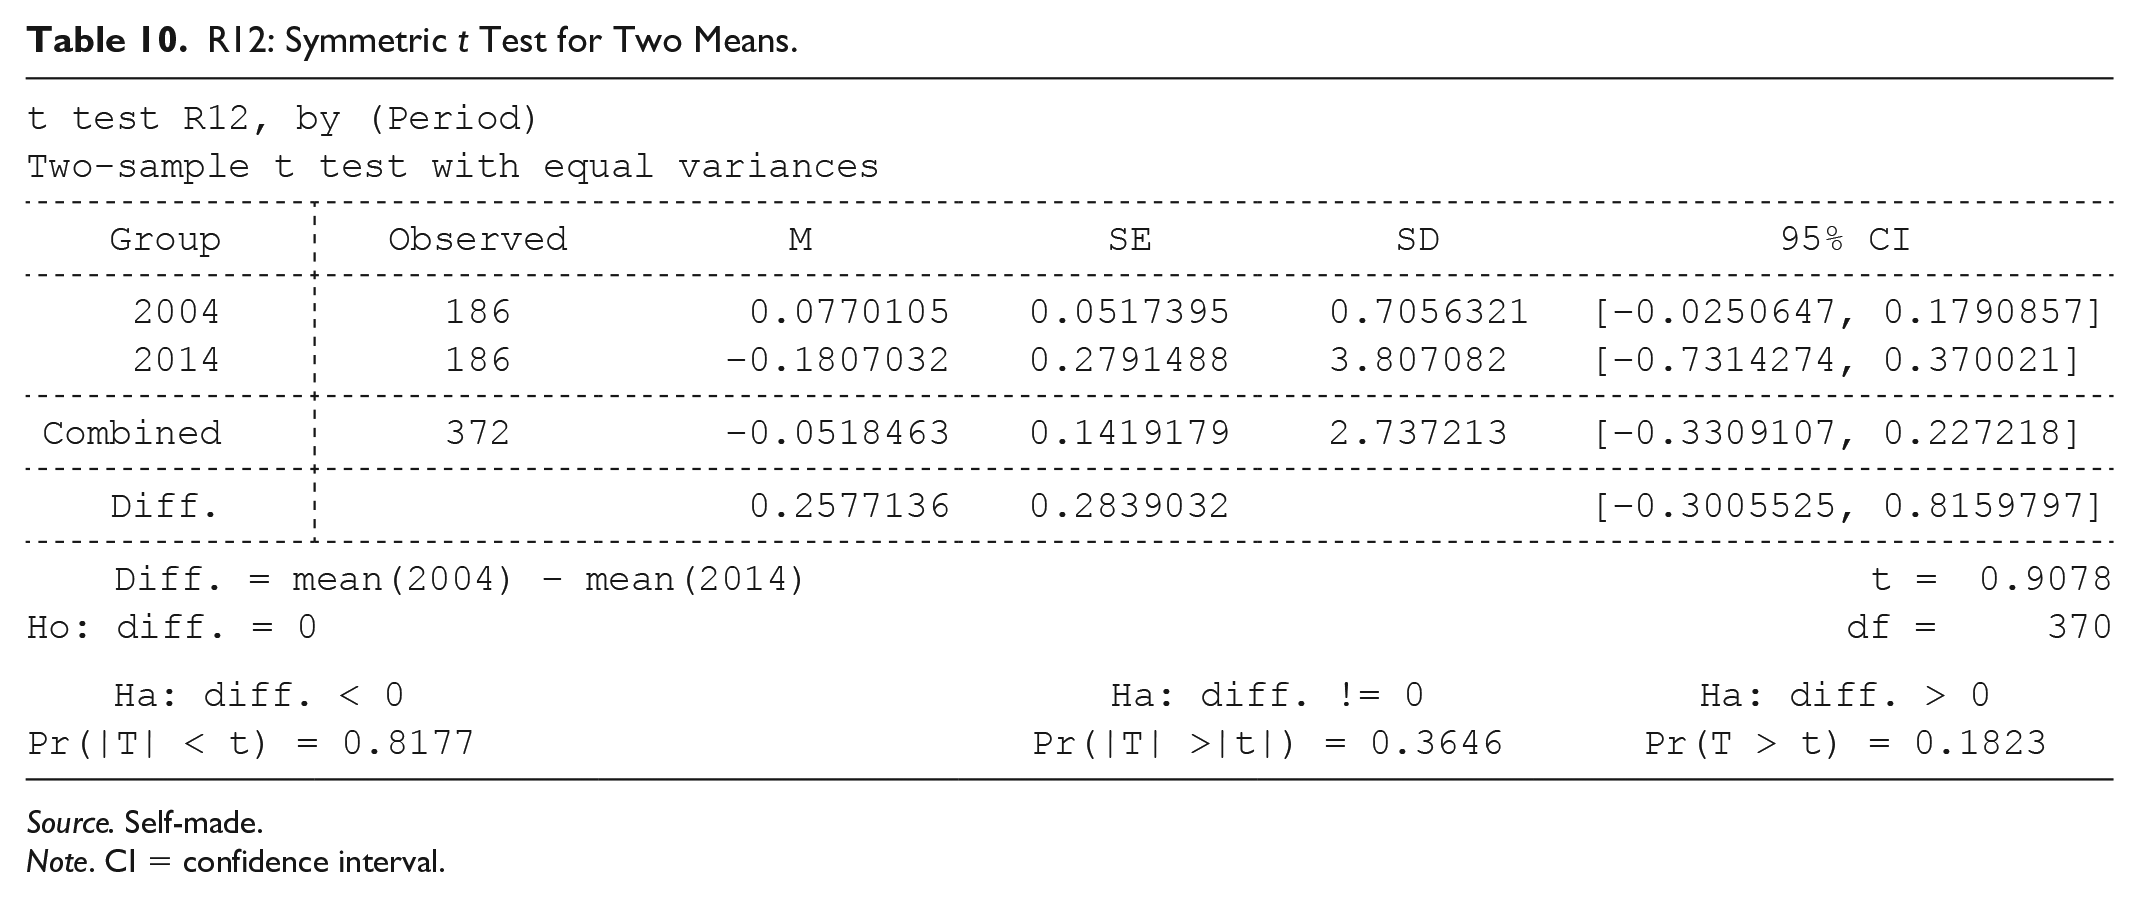
Source. Self-made.
Note. CI = confidence interval.
R12: Regressions of the Ratios 10 Years Later and Considering the Explanatory Variables.

Source. Self-made.
p < .1. **p < .05.
Definitions of the Main Variables.

Discussion
In general, and for the set of different combinations of dimensions reinforced by the statistical test, we conclude that for period T1, which is 2 years before the entry into competition by some of the main clients, the liquidity levels and the solvency of the companies were not worrisome. There was enough treasury to deal with the short-term debts. Moreover, the financial leverage showed a balance between the level of short-term and long-term indebtedness with a volume of indebtedness according to the productive activity. That is, these companies were allocating long-term financing for investments and short-term financing for their current activities.
In period T2, which was the year before the tender, the first signs of something occurred: The short-term debt increased because firms’ short-term debts were acquiring more volume than their long-term debts, which worsened the quality of indebtedness.
In period T3, the year of the contest, there was an alteration and a structural change in the composition of the financial statements. The short-term debt increased considerably because companies needed cash to meet their current debts and went to the financial market in search of short-term financing, which is quicker to obtain. This excessive indebtedness was motivated to a great extent by the pending collections of delinquent clients that entered bankruptcy situations and did not materialize the fulfillment of their debt. In short, the companies initially reacted by seeking short-term financing that allowed them to cover their immediate debts, and thus not break their normal productive functioning. This behavior makes the quality of indebtedness worse: The proportion of short-term debt was gaining ground relative to the proportion of long-term debt.
The solvency and liquidity ratios were directly affected by the debt pending collection from delinquent clients, which reached their worst levels. The liquidity was diminished, and this lack of available cash sent companies into a dangerous spiral, as if they sought to meet their obligations to third parties in the short term, and they had to borrow.
In this period (T3), the financial burden of companies appeared clearly and forcefully. This burden directly and negatively affected the profitability of the ordinary result, which is calculated by the result or operating margin minus the interest on the debt.
Although until this point the profitability of the companies had been independent of the levels of liquidity and indebtedness, in this third period (the year of the contest) a small correlation between profitability and indebtedness began to emerge. This short-term debt, which in the usual practice of financial markets is typically more expensive than long-term debt, caused an increase in the proportion of the financial burden borne by companies. This burden affected slightly the firms’ results, although we must not forget that these results were still very positive.
Upon reaching period T4, which was 1 year after the tender, the increase in short-term debt stabilized. Companies reacted and begin to replace short-term debt for the long term, as they were aware that this financial maneuver will cause better financial results in the future. The cost of the debt will be lower yearly. Thus, firms will avoid treasury tensions by having to return long-term debt; in addition, it is possible to stop the growth of the financial burden in this way.
The immediate consequence was the improvement in the debt quality ratio. The weight of the long-term debt began to grow to the detriment of the short-term debt, which balanced the financial leverage, as in the years before the competition.
Subsequently, in the T5 period, which was 2 years after the entry into competition, companies showed a general stabilization at the economic-financial level and returned slightly to the origins of the years before the entry into the contest. As the final consequence, this domino effect translated into greater long-term debt. This debt would not exist without the entry into bankruptcy of the client-debtors.
Conclusions
The basic conclusion of the research we have carried out is the contrast of the domino effect where the non-fulfillment of the payment obligations of the customers-debtors and the lack of liquidity translate into greater external financing needs. Companies remain indebted, lose financial autonomy, pay additional costs for interest, and end up with greater treasury pressure because they have to repay a much larger debt. The reachability is not affected by the domino effect, as it passes independently of this effect.
It is worth highlighting the statistical evidence of a structural change in the composition of the solvency/liquidity, indebtedness, and profitability ratios for Periods 4 and 5 with respect to the first three periods, which includes the year of the contest. Thus, we demonstrate that the differences that explain the evolution of the ratios over the five periods studied are statistically significant and that an entry into bankruptcy on the part of a major client causes significant damages in the creditor companies. Therefore, the study demonstrates a contagious effect that affects the business fabric, which can be extrapolated to other regions and to other countries. This conclusion has been also demonstrated by other studies such as Cuñat and García-Appendini (2012) and Jacobson and von Schedvin (2015). This event could help the economic policies of countries when they seek to avoid or reduce the burden of this economic-financial contagion.
Finally, we analyzed the ratios of these companies 10 years later, although we have the limitation that 123 companies are no longer present in the data for unknown reasons. The results indicated by the 186 remaining companies show that the ratios of liquidity were maintained statistically over time. This finding represents an improvement in the level of indebtedness in the short term and an unaffected profitability, which continues to evolve regardless of whether the company was subjected to a bankruptcy situation by one of its clients.
The research presents some limitations. First, when analyzing the financial statements of a sample of companies, not all of them have to be damaged because of the entry into bankruptcy of one of their clients. There are an infinite number of attributable and variable causes, both internal and external, which can influence this entire process. Internal factors include, among others, poor management of the management team, wrong decision-making, lack of knowledge to understand the evolution of the market, and failures in R&D + I processes (Research + Development + Innovation), which place a product on the market without the desired success. External causes include the evolution of the market, competition, the entry of foreign competitors with better conditions and qualities, the sectoral crisis, and a long etcetera. These circumstances have an important intrinsic bias, which are very difficult to control. Therefore, these circumstances are presented as a limitation in this research. One possible explanation to solve this limitation could be the consideration that all companies have a common characteristic: the fact of appearing on the list of creditors of a client-debtor who has entered bankruptcy.
A second limitation is that many of the analyzed companies assumed risk contracting an insurance specialized in risk. Companies contract a surety or guarantee insurance which assumes their commercial credit. Its objective is to establish preventive measures that help avoid defaulters and filter to rule out bad payers and unpaid debts.
In this case, the limitation is that the economic-financial impact that these companies may suffer will be moderate. This is because once the expected deadlines and the urocratic aspects of the event have been met, the insured company will normally cover 80% of the debt. This cover could have a temporary impact of deterioration on the financial statements of the company. To get an idea of the scope of this procedure, the insurance company Unespa-Unión Española de Entidades Aseguradoras y Reaseguradoras (2009) considers that the indicator that best expresses the socioeconomic importance of surety or guarantee insurance is the insured capital, that is, the operations’ total economic that is protected by the insurance guarantee, €137,000 million (almost 14% of the Spanish gross domestic product [GDP]).
A third limitation of this study is the selection of the 2004–2005 biennium. Regarding the restrictions found with respect to the years prior to 2004, these focus on the difficulty of making a solid database with sufficient guarantees, given that the information on the companies competed was disseminated by different courts without having a centralized file. The Insolvency Law (22/2003 of July 9) appeared in mid-2003, and with it, the commercial courts were created to discern on these issues. It was not until 2004 that real and concentrated information was available on the bankruptcy situations presented. Regarding the restrictions found after 2005, when wanting to analyze the financial situation of the selected companies for 2 years after the bankruptcy, there is a barrier that comes from the difficulty of obtaining comparable information. This difficulty is because of the appearance of the new general accounting plans (Royal Decrees 1514/2007 and 1515/2007) starting on January 1, 2008. For this reason, the configuration and valuation in the balance sheets, as well as the profit and loss account show significant differences between the old plan (PGC 1990, effective until December 31, 2007) and the new one (PGC 2007, effective from January 1, 2008). This makes their comparability more difficult, and the contribution to the research would be scarce. Moreover, to reinforce the reason of difficulty to compare these periods, there exists a commercial legal regulation in the new general accounting plan (PGC 2007, effective from January 1, 2008). This regulation is the third transitory provision of the accounting plans (Royal Decree 1514/2007 of the General Accounting Plan of November 16 and Royal Decree 1515/2007 of the General Accounting Plan for SMEs of November 16), which indicates it is not possible to compare accounting plans before and after January 1, 2008. Concretely, the third transitory provision states, For the purposes of the obligation established in article 35.6 of the Commercial Code, and for the purposes derived from the application of the principle of uniformity and the requirement of comparability, the annual accounts corresponding to the year that begins from the entry into force of the General Accounting Plan, considers initial annual accounts, so it does not reflect comparative figures in the referred accounts.
Some future research lines are proposed to continue with the research topic. First, it could be interesting to compare financial statements of companies through economic-financial ratios between Spain and other European countries. In Spain, this is possible since 2008 due to the International Financial Reporting Standards (IFRS). Second, use the MDS to carry out a positional analysis together with the PROFIT procedure. This will create a database with two clearly differentiated control groups: (a) companies that have entered into bankruptcy and (b) companies that have not entered into bankruptcy. Finally, given that financial institutions have not been included in this analysis, a future research proposed is to include the financial institutions in the study of bankruptcy situation of companies. This future research line will reinforce previous studies as García-Apendini (2014), who assures companies that are with a low level of leverage are less affected than those that require a higher level of indebtedness, and therefore depend more on external financing.
Footnotes
Declaration of Conflicting Interests
The author(s) declared no potential conflicts of interest with respect to the research, authorship, and/or publication of this article.
Funding
The author(s) received no financial support for the research, authorship, and/or publication of this article.