
Abstract
The Multidimensional Test Anxiety Scale is a self-report instrument designed to assess the cognitive, affective, and physiological manifestations of test anxiety. To date, researchers have provided evidence of the instrument’s psychometric properties when administered in K–12 and university samples in institutions in England and Wales. Thus, the current study was designed to investigate the latent structure of the instrument within a sample of United States university students using a novel statistical technique. University students (N = 412,
Keywords
Introduction
Test anxiety is a pervasive achievement emotion with distinct cognitive and affective symptoms that differ in terms of their eliciting factors, time course, stability, and relationship to important academic outcomes (Cassady, 2001, 2004; Cassady et al., 2023; Morris & Liebert, 1970; von der Embse et al., 2018; Zeidner, 1998). The cognitive dimension of test anxiety is characterized by self-deprecating thoughts, worry focused on the potential negative outcomes of poor test performance, and distracting cognitions unrelated to testing events (Cassady & Johnson, 2002; Putwain, 2008; Zeidner, 1998). These cognitive symptoms are relatively stable across time and learning situations and are more prevalent among learners who value the outcomes of evaluative events but struggle with self-regulatory skills (e.g., time management, effective studying), emotional regulation, and academic self-efficacy (Cassady, 2004; Thomas & Cassady, 2019; Putwain, 2019). The physiological dimension of test anxiety is characterized by the experience of heightened autonomic arousal (e.g., increased heart rate, sweaty palms, nausea) and the maladaptive interpretation of physiological symptoms (e.g., tension). These physiological symptoms often manifest when learners are exposed to environmental cues that signal the onset of an evaluative event and quickly dissipate (Zeidner, 1998). Unfortunately, a large number of studies have shown that test anxiety negatively affects the academic performance, motivation, and well-being of child, adolescent, and adult learners (Liu et al., 2024; Putwain & Daly, 2014; Putwain et al., 2021; Robson et al., 2023; Steinmayr et al., 2016; Thomas et al., 2018; von der Embse et al., 2018).
Effective assessment is a critical component of efforts to support test-anxious learners. Educators must be able to identify students with elevated test anxiety, as well as their unique constellation of cognitive and affective symptoms, to direct them to learning supports aligned with the characteristics of their test anxiety profile (Cassady et al., 2023; Thomas & Ozer, 2024). For instance, students reporting primarily physiological symptoms might benefit from relaxation technique training (Manansingh et al., 2019), whereas students reporting self-deprecating thoughts and concerns aboutacademic ability might benefit from efforts to increase awareness of prior academic successes and improve self-talk (Cassady et al., 2023). To that end, educational and psychological researchers have developed numerous self-report measures aligned with a multidimensional representation of test anxiety to support intervention and research efforts (Putwain, 2008).
A recent addition to the suite of test anxiety assessments is the Multidimensional Test Anxiety Scale (MTAS; Putwain et al., 2020; von der Embse et al., 2021). This self-report instrument includes items designed to assess four distinct facets of test anxiety, including worry, cognitive interference, physiological indicators, and tension. The developers of the instrument define worry as a cognitive aspect of test anxiety characterized by negative self-talk associated with anticipated test failure and a focus on the negative implications of poor test performance. Cognitive interference is a cognitive manifestation of test anxiety that refers to information-processing challenges experienced by test-anxious students such as difficulties with concentration, recalling previously learned information, and organizing thoughts. The physiological indicators component of the MTAS refers to students’ awareness of signs of increased physiological arousal, such as a faster heartbeat or an upset stomach (Putwain et al., 2020; von der Embse et al., 2021). Finally, tension is considered to be an affective-physiological dimension of test anxiety that refers to feelings of tension, anxiousness, panic, or nervousness.
The developers of the instrument have provided preliminary evidence of its psychometric qualities across multiple studies using data collected from secondary and sixth-form college students in England and Wales (Putwain et al., 2020; von der Embse et al., 2021). Specifically, psychometric analyses provided evidence supporting the structural validity, concurrent validity, predictive validity, internal consistency, and test-retest reliability of the Multidimensional Test Anxiety Scale when applied to adolescent and young adult learners (Putwain et al., 2020; von der Embse et al., 2021). Although the reliability and validity of the instrument have been established among secondary and postsecondary learners, the Multidimensional Test Anxiety Scale has not been validated in U.S. higher education institutions, leaving a clear gap in the literature regarding its psychometric performance in this context. As noted in the literature, validity is not an inherent characteristic of an assessment tool and can vary across individuals as well as cultural and educational contexts (Messick, 1996). Therefore, empirical investigations are needed to establish validity evidence when using assessment tools in new contexts and among different participant groups (Bornstein, 2011; DeVellis, 2017; Messick, 1996). The current study was designed to address this gap in the literature by investigating the dimensionality, internal consistency, and concurrent validity of the instrument in a sample of U.S. university students.
Based on prior psychometric research (Putwain et al., 2020; von der Embse et al., 2021), the current study aimed to evaluate several theory-driven expectations. Specifically, we anticipated that the latent structure of the MTAS would include dimensions representing worry, cognitive interference, physiological indicators, and tension. Additionally, we expected these dimensions to show acceptable internal consistency. Further, it was expected that the identified MTAS dimensions would exhibit concurrent validity through positive associations with conceptually related constructs assessed via an established test anxiety instrument and negative correlationswith self-reported measures of student well-being.
Methods
Participants
Participants (N = 415) were undergraduate and graduate students attending a small public university in Texas. 84.95% of participants identified as female (n = 350), and 13.01% identified as male (n = 54). The majority of participants self-identified as White (n = 270, 65.06%) with the remaining participants identifying as Hispanic/Latino or Spanish origin (n = 85, 20.48%), Black/African American (n = 33, 7.95%), Asian/Asian American (n = 5, 1.21%), American Indian or Alaska Native (n = 4, 0.96%), Native Hawaiian or Other Pacific Islander (n = 1, 0.24%), two or more ethnicities (n = 6, 1.45%), and Middle Eastern (n = 1, 0.24%). A small number of participants did not report their gender (n = 11) or ethnicity (n = 10). The mean age of participants was 26.97 years with a standard deviation of 8.76.
Measures
Multidimensional Test Anxiety Scale
The Multidimensional Test Anxiety Scale (MTAS) is a 16-item self-report instrument designed to assess cognitive and affective manifestations of test anxiety across the learning-testing cycle (Putwain et al., 2021). Responses are used to generate estimates of worry (four items; e.g., “Before a test/exam, I am worried I will fail”), which represents negative self-oriented cognitions focused on the consequences of test failure; cognitive interference (four items; e.g., “I forget previously known material before taking a test/exam”), which captures information processing and retrieval difficulties resulting from intrusive thoughts during evaluative situations; tension (four items; e.g., “I feel tense before taking a test/exam”), which reflects individuals’ interpretations of physiological arousal; and physiological indicators (four items; e.g., “My heart races when I take a test/exam”), which reflect individuals’ awareness of physiological stress responses. Participants reported their level of agreement with each statement using a 5-point Likert-type scale (1 = strongly disagree to 5 = strongly agree). Prior investigations have provided preliminary validity and reliability evidence supporting the use of the instrument with adolescent and young adult learners (Putwain et al., 2021; von der Embse et al., 2021).
Reactions to Tests – Reduced
Participants completed a reduced version of Sarason’s (1984) Reactions to Tests (RTT-R; Benson & Bandalos, 1992). This 20-item instrument is designed to provide estimates of four conceptually distinct aspects of test anxiety including worry (e.g., “During tests I think of how poorly I am doing”), test-irrelevant thinking (e.g., “While taking tests, I sometimes think about being somewhere else”), tension (e.g., “I feel distressed and uneasy before a test”), and bodily symptoms (e.g., “I get a headache before a test”). Participants reported how well each statement described them using a 4-point Likert-type scale (1 = not typical at all of me, 2 = somewhat typical of me, 3 = quite typical of me, 4 = very typical of me). Prior investigations have provided evidence of the structural validity of the reduced version of the instrument using exploratory and confirmatory analytic methods. In the present study, the worry (McDonald’s ω = .86), test-irrelevant thinking (McDonald’s ω = .90), tension (McDonald’s ω = .92), and bodily symptoms (McDonald’s ω = .79) subscales demonstrated acceptable internal consistency.
The Well-Being Profile – Short-Form
Participants completed the Well-Being Profile – Short-Form (WB-Pro-SF; Marsh et al., 2020). The full WB-Pro instrument is designed to provide estimates of 15 conceptually distinct constructs believed to contribute to an individual’s sense of well-being. Specifically, the instrument assesses autonomy, clear thinking, competence, emotional stability, empathy, engagement, meaning, optimism, positive emotions, prosocial behavior, resilience, and self-acceptance, self-esteem, and vitality. Using a genetic algorithm-based approach, WB-Pro developers identified a short-form of the instrument containing five items that provide researchers with a global assessment of respondents’ well-being. Participants reported their level of agreement with each item using a 9-point Likert-type scale (1 = completely disagree, 2 = strongly disagree, 3 = disagree, 4 = somewhat disagree, 5 = neither agree nor disagree, 6 = somewhat agree, 7 = agree, 8 = strongly agree, 9 = completely agree). Sample items include “I am always optimistic about my future,” and “I feel that I have a number of good qualities.” Prior investigations have provided evidence of the convergent validity of the measure (Marsh et al., 2020). The results of a reliability analysis indicated that the WB-Pro-SF demonstrated acceptable internal consistency in the current investigation (McDonald’s ω = .62).
Procedure
The current study used a convenience sampling approach, recruiting participants enrolled in courses associated with a departmental research pool. This research pool allows undergraduate and graduate students in select education courses to participate in faculty research – or complete alternative assignments equal in time and effort – in exchange for course credit. Participants completed the study materials at a time and location of their choosing using the Qualtrics (Qualtrics, Provo, UT) online survey management platform. The University of Texas at Tyler Institutional Review Board approved the study materials and recruitment plan. All participants provided informed consent prior to their involvement in the investigation.
Analytic Plan
Exploratory Graph Analysis
We used Exploratory Graph Analysis (EGA) to investigate the dimensionality of the Multidimensional Test Anxiety Scale. EGA uses regularized partial correlations to estimate the relationship among questionnaire items, which are then presented graphically as an interconnected network consisting of nodes (i.e., circles) and edges (i.e., lines; Golino & Epskamp, 2017). In psychometric analyses, nodes represent questionnaire items, and edges represent the strength of the relationship between item pairs (Christensen et al., 2019; Golino & Epskamp, 2017). Further, EGA can be used to identify clusters – or communities – of nodes representing collections of items that are strongly associated with one another and weakly related to other indicators in the network (Golino & Epskamp, 2017). Communities identified using EGA are conceptually similar to “factors” in factor analysis and provide information regarding the number and composition of latent factors underlying questionnaire items (Golino & Epskamp, 2017). Critically, recent work has suggested that EGA provides more accurate estimates of the number of latent variables underlying collected data than more traditional methods, such as parallel analysis, acceleration factor, optimal coordinates, and Kaiser’s Little Jiffy (Cosemans et al., 2022; Golino et al., 2017, 2020). Additionally, unlike traditional EFA, EGA offers both statistical estimation of dimensionality and a visual, interpretable network structure, which may aid in theory development and scale refinement (Christensen et al., 2019; Golino & Epskamp, 2017). The EGA analysis was conducted using R 4.3.2 (R Core Team, 2024) and the EGAnet package (version 2.0.5; Golino & Christensen, 2024). The initial latent structure was identified using the GLASSO (with gamma = .05) and Walktrap algorithms. To evaluate the stability of the identified dimensions, Bootstrapped EGA was conducted, as described in the following section.
Bootstrapped Exploratory Graph Analysis
Prior research has suggested that sample-specific characteristics may undermine the generalizability of dimensional structures identified using EGA (Christensen et al., 2018). This concern led to the development of bootstrap exploratory graph analysis (BEGA) – a variation of the technique that allows researchers to directly evaluate the stability of EGA dimensions using bootstrap resampling methods. Specifically, this analytic method provides insight into both structural and item stability. In the context of BEGA, structural stability refers to the proportion of times particular dimensional structures appear across bootstrapped samples. Item stability in BEGA refers to the proportion of times a particular node (i.e., item) is associated with communities identified in the original EGA solution dataset across bootstrapped samples (Golino et al., 2020). An item stability value below .75 was considered to be evidence that an item may be problematic and a low-quality indicator of the latent constructs assessed by the instrument (Golino et al., 2020). In the current investigation, we applied a parametric bootstrapping method with 500 iterations. As with the standard EGA, relationships between questionnaire items and distinct communities were identified using the GLASSO (with gamma = .05) and Walktrap algorithms.
Concurrent Validity and Internal Consistency
We examined the concurrent validity of the instrument by estimating Pearson product moment-correlation coefficients to evaluate the relationship between MTAS and Reactions to Tests – Reduced (Benson & Bandalos, 1992) scores. The reduced version of the Reactions to Test instrument was included in our validity analyses because of past research demonstrating the reliability and validity of the instrument when applied in university settings and the conceptual overlap between the proposed MTAS dimensions and RTT-R subscales. Additionally, we evaluated the concurrent validity by estimating Pearson product-moment correlation coefficients to evaluate the relationship between MTAS and WB-Pro-SF scores. The WB-Pro-SF was chosen because it acknowledges the complex and multidimensional nature of well-being and has demonstrated strong psychometric properties in previous research. Our focus on well-being in our validation efforts is guided by recent empirical evidence suggesting that cognitive test anxiety manifestations undermine learners’ subjective well-being (Steinmayr et al., 2016). Finally, Cronbach’s (1951) alpha and McDonald’s (1999) omega values were used to evaluate the internal consistency of MTAS dimensions identified in the EGA analysis.
Results
Exploratory Graph Analysis Findings
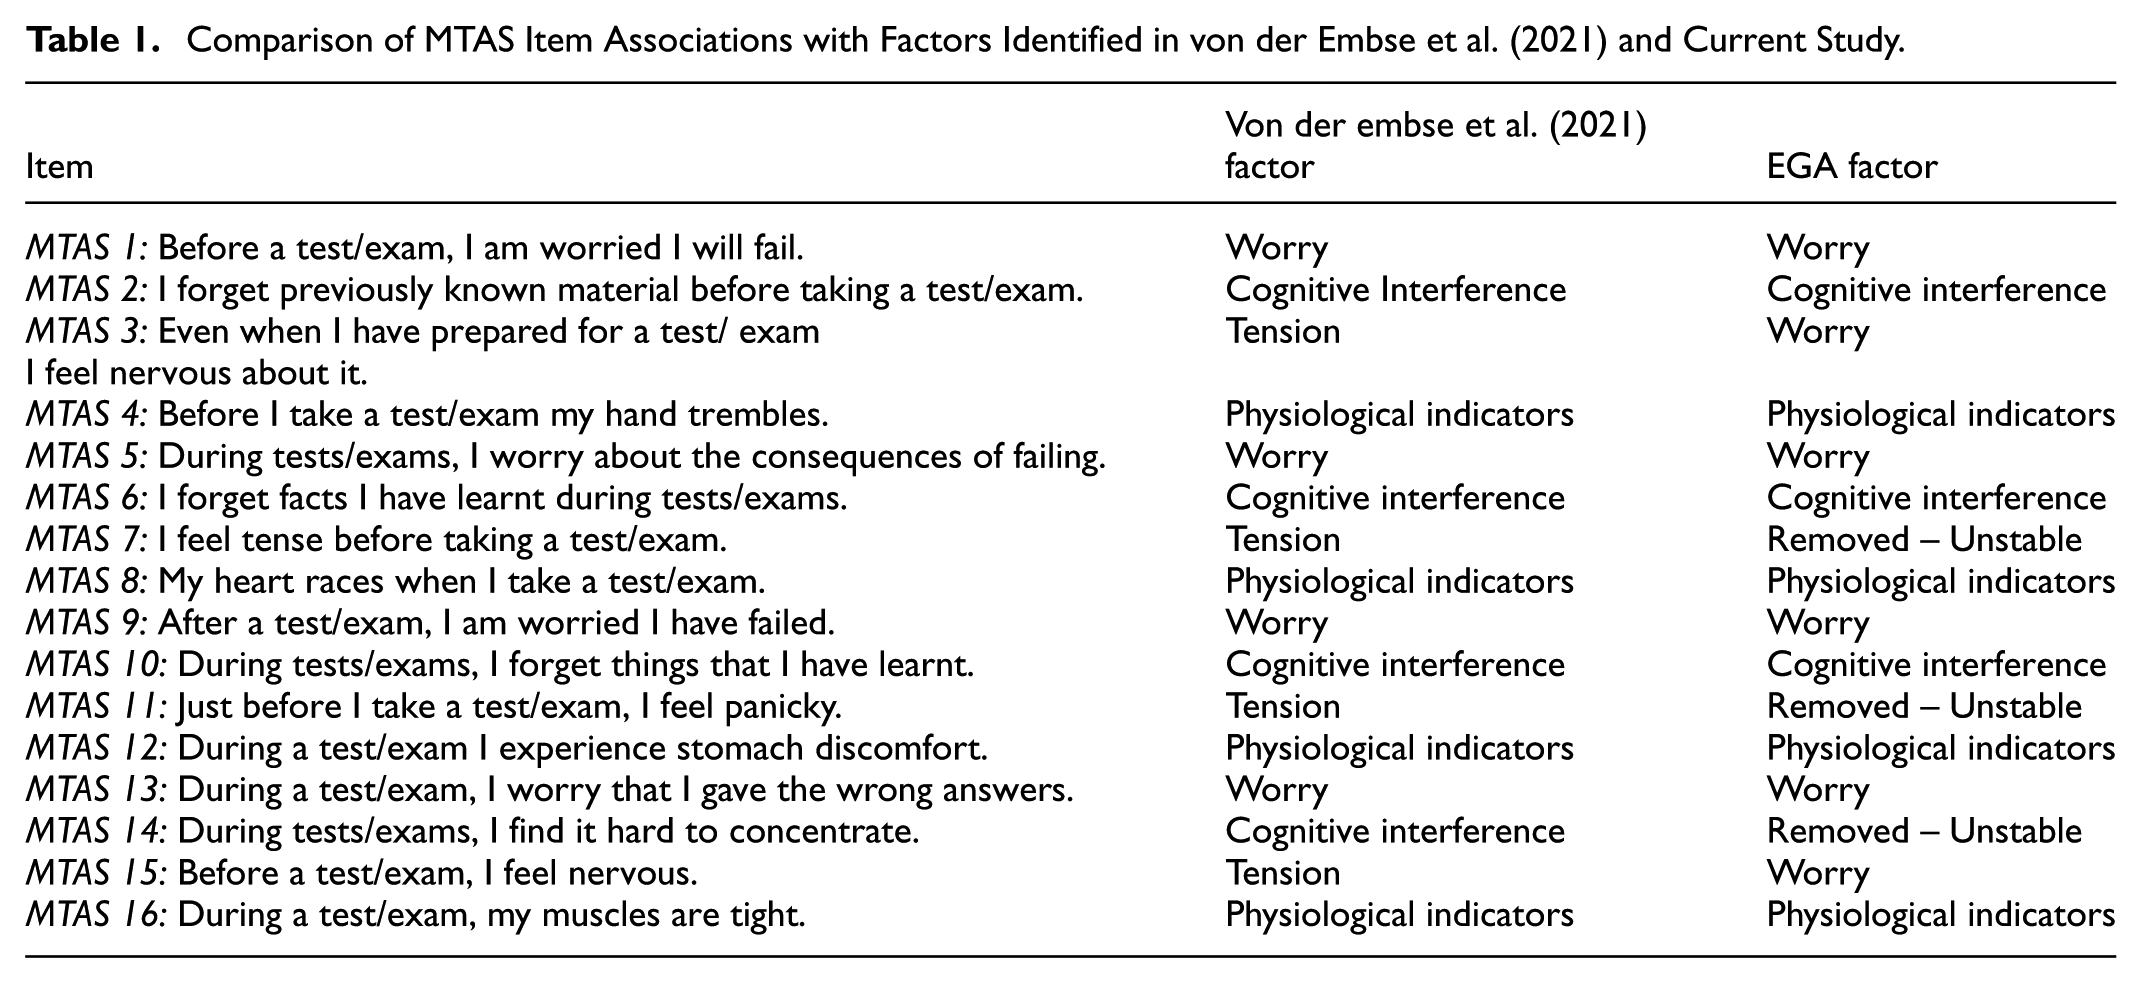
The EGA results suggested that the latent structure of the MTAS is best represented by three distinct dimensions. Dimension 1 included items that are consistent with theoretical descriptions of worry, reflecting test takers’ preoccupation with the perceived consequences of test failure and anticipation of poor performance (MTAS Items 1, 5, 9, and 13). Additionally, dimension 1 included items originally intended to assess tension (MTAS Items 3 and 15). Dimension 2 consisted of items intended to assess cognitive interference associated with evaluative events, including MTAS items 2, 6, 10, and 14. These items focus on disruptions in memory retrieval and attentional control, which are key indicators of cognitive interference in the test anxiety literature (Putwain & Symes, 2020; Wine, 1971). Finally, dimension 3 consisted of items designed to assess awareness of common physiological sensations experienced by test-anxious students (MTAS Items 4, 8, 12, and 16). Additionally, dimension 3 contained MTAS Items 7 and 11, which were originally intended to provide estimates of tension.
Thus, our EGA results suggest the MTAS instrument is capable of assessing several distinct manifestations of test anxiety including worry (i.e., dimension 1), cognitive interference (dimension 2) and awareness of physiological symptoms (dimension 3). The full wording of MTAS items is provided in Table 1. A graphical depiction of the EGA results is presented in Figure 1.
Comparison of MTAS Item Associations with Factors Identified in von der Embse et al. (2021) and Current Study.

Graphical depiction of EGA results.
Bootstrapped Exploratory Graph Analysis Findings
BEGA results indicated that the three-dimensional structure described above was replicated in 63% of the bootstrapped samples, whereasone- and four-dimensional solutions appeared in 22.4% and 14.6% of samples, respectively. Evaluation of item stability revealed that MTAS items 7, 11, and 14 had stability values below .75, indicating that these items were inconsistently assigned to the same community across bootstrapped samples. The low item stability suggests these itemsmay be poor indicators of their intended constructs. Item stability estimates from this phase of the analysis are provided in Figure 2.

Bootstrapped exploratory graph analysis item stability estimates.
To improve the structural stability of the dominant solution, we removed these problematic items and re-conducted BEGA with the remaining 13 items. The removal of the problematic MTAS items increased the stability of the three-dimensional structure to 86% while reducing the occurrence of the one-dimensional (12%) and four-dimensional (1%) solutions. Further, item stability estimates indicated that the remaining MTAS items exceeded the .75 threshold, indicating they were consistently associated with communities identified in the original three-dimensional solution (see Figure 3).

Bootstrapped exploratory graph analysis item stability estimates for the reduced MTAS.
Consistent with the traditional EGA, the final BEGA indicated that the latent structure of the MTAS is best represented by three distinct latent constructs including Worry, Cognitive Interference, and Physiological Indicators. A graphical depiction of the final three-dimensional BEGA network structure is presented in Figure 4. Additionally, Table 1 provides a summary of item assignments based on the original MTAS design and the current EGA/BEGA results.

Graphical depiction of median BEGA results for the reduced MTAS.
Evidence of Concurrent Validity and Internal Consistency
Pearson product-moment correlation coefficients indicated that the MTAS Worry, Cognitive Interference, and Physiological Indicators dimensions were positively associated with the RTT-R Worry, Test-Irrelevant Thinking, Tension, and Bodily Symptoms subscales. The correlation coefficients are presented in Table 2.
Intercorrelations Among MTAS Dimensions and Reactions to Tests–Reduced (RTT-R) Subscales.

p < .05.
Analyses revealed statistically significant negative relationships between WB-Pro-SF scores and both MTAS Cognitive Interference (r = −.11, p = .01), Physiological Indicators (r = −.10, p = .04) scores. Additionally, the correlational analyses revealed a negative correlation between MTAS Worry and WB-Pro-SF scores that approached statistical significance (r = −.09, p = .057).
Finally, reliability analyses indicated that the MTAS Worry (Cronbach’s α = .93, McDonald’s ω = .93), Cognitive Interference (Cronbach’s α = .93, McDonald’s ω = .93), and Physiological Indicators (Cronbach’s α = .86, McDonald’s ω = .86) dimensions demonstrated acceptable levels of internal consistency.
Discussion
The purpose of the current investigation was to validate the Multidimensional Test Anxiety Scale (MTAS) in a sample of American university students . Based on findings from prior validation efforts (Putwain et al., 2021; von der Embse et al., 2021), we predicted that our analyses would identify four unique test anxiety dimensions, including Worry, Cognitive Interference, Tension, and Physiological Indicators. Contrary to expectations, the exploratory graph analysis results indicated that the latent structure of the instrument is best represented by three distinct dimensions: Worry, Cognitive Interference, and Physiological Indicators. Notably, the bootstrapped exploratory graph analysis results revealed that two items associated with the proposed tension dimension– assessing feelings of panic and tension before an exam– demonstrated low item stability, suggesting they are poor indicators of the test anxiety construct. Additionally, the results showed that the remaining two items assessing “nervousness” were associated with the “worry” dimension as opposed to a “tension” construct, as proposed during the development of the MTAS.
We believe there are several potential reasons why the analyses did notsupport the existence of a distinct Tension dimension. Prior research has shown that the dimensional structure of test anxiety instruments can be influenced by the severity of students’ test anxiety. For instance, Cassady and Finch (2015) used factor mixture modeling techniques to demonstrate that the latent structure of the Cognitive Test Anxiety Scale is best represented as a unidimensional construct among students with low levels of test anxiety and as two distinct latent constructs among students with high levels of test anxiety. This finding may help explain the differences in latent structure noted between earlier MTAS validation efforts and the current study.
Within the educational context of England and Wales, secondary education students and those enrolled in sixth-form colleges take the General Certificate of Secondary Education (GCSE) and A-level examinations, respectively – high-stakes assessments that have implications for future educational and vocational opportunities (Putwain et al., 2010). Reviewing the characteristics of participants involved in research validating the MTAS (Putwain et al., 2020; von der Embse et al., 2021), GCSE and A-level exams were an immediate concern for some students, andlikely remained a salientconsideration among those who would be taking the exams laterin their educational career. A consistent finding in the literature is that students experience elevated test anxiety when confronted with high-stakes examinations (Segool et al., 2013; von der Embse & Witmer, 2014). With this in mind, the presence ofhigh-stakes examinations in those educational contexts may have contributed to elevated anxiety among participants involved in earlierMTAS validation efforts, and by extension, to a factor structure that may not generalize to an American university setting with different testing demands.
We also believe our inability to reliably detect a distinct tension factor is a reflection of the ongoing debate surrounding the nature of test anxiety. As noted in the literature (Putwain, 2008; Putwain et al., 2021), there continues to be considerable disagreement regarding both the number and composition of test anxiety dimensions. One such area of disagreement involves how nervousness aligns with the specific test anxiety dimensions assessed by different self-report instruments. For instance, various iterations of the Cognitive Test Anxiety Scale (Cassady & Finch, 2014; Cassady & Johnson, 2002; Thomas et al., 2018) and the Test Anxiety Measure for College Students (Lowe, 2018) include nervousness as an indicator of the cognitive dimension of test anxiety. However, the FRIEDBEN Test Anxiety Scale (Friedman & Bendas-Jacobs, 1997) and the Revised Worry-Emotionality Scale (Morris et al., 1981) treat items assessing learner nervousness as a reflection of tension.
Similar disagreements can be found in the composition of measures, including items designed to assess the affective and physiological manifestations of test anxiety – broad domains aligned with the proposed MTAS physiological indicators and tension dimensions. For instance, the FRIEDBEN Test Anxiety Scale (Friedman & Bendas-Jacobs, 1997) and the Children’s Test Anxiety Scale (Wren & Benson, 2004) combine the affective and physiological symptoms into a single, unified dimension while the Reactions to Tests (Sarason, 1984) includes distinct dimensions corresponding to learners’ awareness of psychological responses experienced during testing events and their interpretation of physiological arousal.
Although questions about the placement of nervousness or the viability of a tension dimension may seem minor, these issues have important implications for efforts designed to support test-anxious learners. In recent years, there has been a growing consensus in the literature that test-anxious learners experience unique constellations of cognitive and affective symptoms before, during, and after evaluative events (Cassady et al., 2023; Thomas & Ozer, 2024). Practically, this means that the efficacy of anxiety-reduction efforts is maximized when they acknowledge the multidimensional nature of the construct and are tailored to address the unique challenges experienced by test-anxious learners (Putwain & Pescod, 2018; Zeidner & Matthews, 2005). Unfortunately, the lack of consensus on the dimensionality of test anxiety and inconsistencies across measurement tools limit our ability to accurately assess test anxiety and create supports aligned with learners’ unique symptoms. At the same time, the lack of consensus on the dimensionality of test anxiety – and how symptoms like nervousness are classified – can lead to inconsistencies in how scores are interpreted across instruments and educational contexts. For those using the MTAS, it is important to interpret scores in light of the psychometric evidence available for the specific context in which the instrument is being used. Thus, there is a clear need to continue and expand upon recent efforts (Putwain et al., 2021) to critically evaluate existing literature in the hope of creating a standardized framework for understanding test anxiety that will lead to consistency in how the construct is discussed and measured across studies and contexts. We believe this work will require a combination of systematic reviews of historical and contemporary theoretical frameworks and measurement tools, expert consensus-building efforts (e.g., Delphi panels), and additional psychometric investigations that evaluate the generalizability of test anxiety dimensions across age groups, cultural contexts, and educational settings. A key challenge will be reconciling competing theoretical perspectives, which may complicate efforts to adopt shared definitions or more standardized assessment tools and approaches.
In addition to providing insight into the dimensionality of the MTAS, the current examination provided information about the reliability and concurrent validity of the instrument. Specifically, the reliability analyses demonstrated the internal consistency of the Worry, Cognitive Interference, and Physiological Indicators subscales in our sample. Additionally, correlational analyses examining the association between MTAS and RTT subscales provided evidence of the concurrent validity of the instrument, with results revealing positive, theoretically consistent correlations between the cognitive-, affective-, and physiological- oriented subscales of the MTAS and RTT-R. However, it is important to acknowledge the large, positive correlation between MTAS Worry and RTT-R tension scores. Discussions of test anxiety components acknowledge that learners’ interpretations of their physiological states during an evaluation event fundamentally involves cognitive processing (Zeidner, 1998). Thus, the association observed in the current examination could be the result of the conceptual overlap between worry and tension dimensions in theoretical frameworks that have guided the development of self-report tests and instruments.
The results of the current examination also provide additional support for the concurrent validity of the MTAS. Specifically, our results indicated that the MTAS Worry, Cognitive Interference, and Physiological Indicators subscale scores were negatively associated with student well-being. These results are consistent with prior literature suggesting that cognitive and affective test anxiety symptoms can undermine both school-related (Putwain et al., 2021) and general well-being (Hembree, 1988). Given prior research suggesting that student well-being is a robust predictor of academic performance and student retention decisions, we encourage researchers to continue to explore the short- and long-term influences of test anxiety on mental health outcomes and students’ overall well-being.
Although the results of the current examination provide evidence of the psychometric qualities of the MTAS, several important limitations must be acknowledged. First, the data used for the primary analyses were collected from a single public university in the southern United States. Therefore, the findings of the examination might not be generalizable to other populations or educational contexts. Second, our efforts to provide concurrent validity evidence for the MTAS relied solely on self-report data, which could be influenced by social desirability and common method bias. Therefore, we encourage future validation efforts to incorporate more objective indicators of test anxiety collected before orduring exams (e.g., heart rate, blood pressure; Roos et al., 2021) and peer- orteacher-report data for test anxiety dimensions, antecedents, and outcomes. Finally, it is important to acknowledge that the current study did not evaluate the divergent validity of the MTAS. Thus, we encourage future researchers to evaluate the extent to which MTAS dimensions are distinct from related but theoretically overlappingconstructs.
Conclusion
This study provides insight into the latent structure of the Multidimensional Test Anxiety Scale within a university sample using exploratory graph analysis and bootstrapped exploratory graph analysis. The results support a three-dimensional structure comprising Worry, Cognitive Interference, and Physiological Indicators. The three-dimensional structure identified in this research diverges from the initially expected four-dimensional model reported in previous validation studies. Furthermore, the MTAS demonstrated acceptable internal consistency and concurrent validity. The findings support the use of a modified MTAS with United States university students and underscore the need for continued refinement of the test anxiety construct to ensure consistency in its description and assessment across contexts.
Footnotes
Ethical Considerations
All participants provided informed consent before completing the survey materials. Further, the study materials and procedure were approved by the University of Texas at Tyler Institutional Review Board. The review by the local IRB ensured that the study procedures and protections for participants complied with U.S. Federal Law (Department of Health and Human Services Common rule).
Author Contributions
C.L.T. conceived the study and was responsible for study design, securing ethical approval, and data collection. C.L.T. performed the statistical analyses and interpreted the primary findings. C.L.T. and S.F. drafted the manuscript. C.L.T. and S.F. read and approved the final version of the manuscript.
Funding
The authors received no financial support for the research, authorship, and/or publication of this article.
Declaration of Conflicting Interests
The authors declared no potential conflicts of interest with respect to the research, authorship, and/or publication of this article.
Data Availability Statement
The data that support the findings of this study are available from the corresponding author, upon reasonable request.
Generative AI in Scientific Writing
During the preparation of this work the author(s) used Open AI’s ChatGPT generative AI tool in order to proofread the manuscript and improve readability. After using this tool/service, the author(s) reviewed and edited the content as needed and take(s) full responsibility for the content of the published article.