
Abstract
Multisource data, spatial density analysis, and a gravity model were used to evaluate and analyze differentiation and controls of human settlement locations in Jinan, China. The results indicate the following. (a) The spatial distribution of human settlements follows a block-style, is axially extended, and has a multicenter development pattern with a significant circular structure. (b) The distributions of many settlement types are similar to the total settlement distribution. Residential space exhibits the highest correlation with public space, whereas financial space has the smallest correlation with business space. A high matching value for human settlement is found at the junction of the five districts in Jinan, whereas the Pingyin and Shanghe counties exhibit the lowest value. (c) Areas with human settlement exhibit typical hierarchies. Performance is dominated by the five districts, Zhangqiu is subdominant, and other districts represent an edge-dependent hierarchical system. Radial spatial settlement structures are centered on the five districts, with a centripetal and multicentric “western dense, eastern sparse” regional pattern. (d) Topography is the main factor that generates differentiation. Road network density affects the distribution and grade of human settlement areas, gross domestic factor is a key factor that affects the formation of human settlement structures, and population aggregation is a prerequisite for human settlement distribution, as well as a catalytic factor for differentiation of human settlements.
Introduction
Since China’s “reform and liberalization,” the processes of industrialization and urbanization have not only led to unprecedented growth in China’s economy but have also caused a series of problems related to excessive consumption of natural resources and continuous deterioration of the ecological and human living environments. These problems have manifested in the uneven distribution of facility resources, including infrastructure resources (Zhong et al., 2016). There are large differences in the level of basic public services within cities and between urban and rural areas (Han et al., 2015; Shi, 2015), imbalances in housing security and supporting facilities (Huang et al., 2018; B. Wu & Xu, 2018), and other issues. Human habitats and environmental issues, including pollution (Tong et al., 2018), ecological damage (H. H. Liu et al., 2016), urban heat island effect (A. D. Guo et al., 2019), and native urban wind environment effects, have been on the rise (Yang, Guo et al., 2019). Strengthening assessment methods to inform how to improve human settlements is one path for addressing such problems.
In the human settlements, the settlement environment conforms to classical theories such as the central place and core edge. The central place theory is the scientific basis for describing the order, spatial organization, and distribution of things geographically (S. J. Wang et al., 2012). Core edge theory is the basic theory of urban space interaction. While affirming the uneven development of regions, it also points out that a certain city or economic area can be divided into central and peripheral areas with different attributes (Odell, 1967). Thus, the differentiation between human settlements has a theoretical basis.
Human settlements involve not only the physical characteristics of housing, cities, towns, or villages but also the integration of human activities, including residence, work, education, health, culture, and entertainment (L. Y. Wu, 1996). Human settlement research focuses on the study of man-made living spaces, with a focus on providing comfortable accommodation for humans and facilities that are in concert with the surrounding environment (X. M. Li et al., 2000). In the West, academics tend to focus on the study of public facility spaces and residential spaces. For the former, the theory of settlement layout was developed in the 1960s, which addressed both efficiency and fairness, and provided a new perspective on human settlement research (DeVerteuil, 2000). The relationships between different facility resources (Ravensbergen et al., 2016), differences in facility accessibility demands (Novignon & Nonvignon, 2017), balance of facility supply and service capacity (Setyono et al., 2016), and equal allocation of facility space (Song et al., 2018) all affect the layout and development of human settlements. For residential spaces, different subjects form heterogeneous residential areas (Sander, 2017). The percentage of green space in residential areas is an important factor in social security (Cruz-Cardenas & Oleas, 2018) as it affects social interactions, especially in the elderly population (Kemperman & Timmermans, 2014), and living space by providing ecological services (Ciftcioglu & Aydin, 2018; Hlahla & Hill, 2018). Moreover, residential space affects the mental health of residents (Hu & Coulter, 2017). And its distribution and evolution are affected by land-use efficiency, production factor efficiency, urban expansion, and land-use policies (Yue et al., 2019). In China, there are substantial concerns about the formation and evolution of human settlements. In the early stages, humans gathered to create basic human settlements (L. Y. Wu, 2001). However, as this process evolved, the scale of the settlements expanded dramatically (Yue et al., 2013) and led to hierarchical differentiation between human settlements (Gu, 1990). The heterogeneity of human activity results in different human settlements (Li, Liang et al., 2018), which can be categorized into multiple types (Yang, Wang et al., 2019), and the quality of these settlements can be affected by many factors (H. Li et al., 2017; Yang et al., 2016). Current and future refinement of the research on human settlements includes further study of different aspects, such as the thermal environment (Qiao et al., 2019), the wind environment (Chao et al., 2014), the application of multisource data such as big data (Zhen et al., 2017), and the construction of high-quality human settlements (B. J. He et al., 2014, 2018).
In our review of the current available research on human settlements, we found that human settlements are made up of ecological, economic, technological, social, and cultural strata as the basic aspects for understanding the construction and development of human settlements (L. Y. Wu, 2001). Corresponding evaluation principles for different research areas should be established to better address or mitigate corresponding human environmental problems. Corresponding evaluation principles include comprehensiveness, hierarchy, systemicity, scientificity, comparability, and maneuverability.
On September 4, 2008, the Nature magazine launched a “Big Data” special issue, highlighting the research value of big data in various fields (Lynch, 2008). At the same time, big data that included geospatial information had begun to attract the attention of geographers (Wilson & Graham, 2013). Geographic big data include Earth observation big data and human behavior big data. To explore the spatial differentiation between human settlements, appropriate data should be selected. It is difficult for remote sensing data to effectively perceive the socioeconomic attributes that are of interest for research. Obtaining mobile phone signals and GPS data is difficult and costly; there are limitations and gaps in bus swipe data and Weibo data samples. To describe travel and social relations, it is difficult to capture the differentiation of human settlements. Compared with other big data, these data increase the ability to describe geographic entities and can reflect the spatial distribution of different types of human settlements. It is also an excellent choice in the field of urban space research, but is still rarely used in the field of human settlement research. Point-of-interest (POI) data can characterize the spatial differentiation of human settlements. Breakthroughs in big data analysis technology and the development of massive data collection technologies have made research results based on large samples of human settlement environments more accurate.
The differences of this study are (a) it explores human settlement differentiation from a facility resource perspective; (b) it employs the use of POI to divide human settlements; and (c) there is a mixed phenomenon of human settlements in reality. Previous studies lacked a horizontal comparison of different types of human settlements. Multiple factors cause differences in the external radiation capacity of human settlements of different sizes, and exploring the relationship between the two is conducive to the rational construction of human settlements.
This study aims to evaluate and analyze the patterns and influence of factors on human settlements and their space differentiation. First, we used a Python program to obtain POI data from a map of Jinan, China, which were collected in September 2018. Second, using the geographic information system (GIS) spatial analysis, the improved criteria importance though intercrieria correlation (CRITIC) method, and a gravity model combined with multisource data, such as socioeconomic statistics, we analyze the spatial distribution and interactions between human settlements. Finally, from a nature and society perspective, we analyze the factors that affect human settlement differentiation and obtain the differentiation trends.
Data and Method
Research Area
China’s Jinan City, capital of the Shandong Province, has accumulated many resources, making it the best developed city in the province. However, in practice, there are non-normal economic distributions in Jinan City, just as there are in the other five provincial capitals. Shandong’s Jinan City connects the Capital Economic Circle to the north, the Yangtze River Delta Economic Zone to the south, and the Shandong Peninsula and Central China from east to west. It is an important meeting point on the Bohai Rim Economic Zone and the Beijing–Shanghai economic axis, and it is also the central city in the Bohai Rim and the middle and lower reaches of the Yellow River one. Therefore, this study takes Jinan as the research object and strives to provide reference for other capital cities with non-normal distribution of economy (Figure 1).
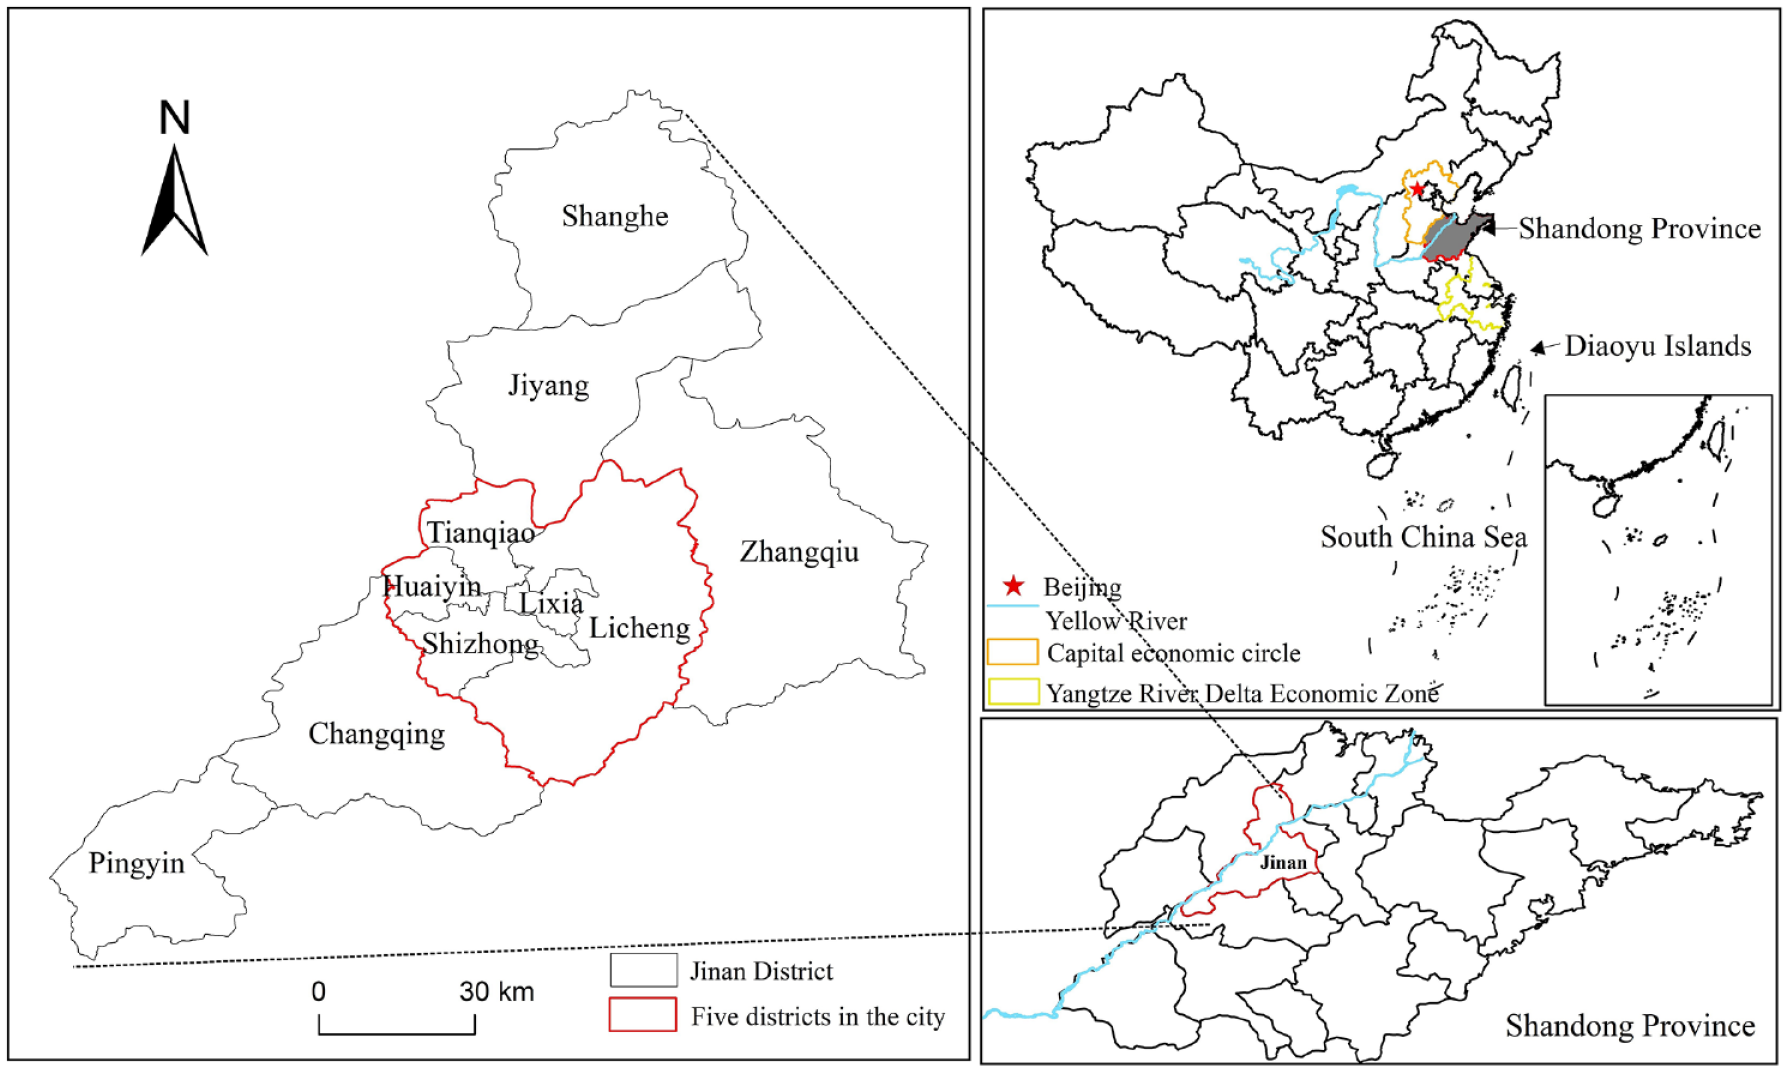
Location of the study area.
Data Sources
POI data abstract the geospatial entity into points whose attributes can effectively reflect the facility resources and, therefore, the spatial distributions of human settlements. In addition to POI, we used digital elevation model (DEM), road network data, nighttime light data, and statistical data as auxiliary data in this study (Table 1).
Sources of Data.

Note. POI = point of interest; DEM = digital elevation model; NPP-VIRS = National Polar-orbiting Partnership Visible Infrared Imager Radiometer Suite.
The number of original POI data sets was 425,503. After processing, which included de-duplication and deviation correction, we obtained 367,727 effective POI data sets. Facility resources are the basis of human settlements, that is, different types form various types of spatial settlement structures (Table 2). We also used the POI data classification standard to divide the human settlements into six categories.
POI Data Types.

Research Methods
Spatial density analysis
Kernel density can be used to perform high-quality density estimation on point data without being affected by the size and position of the grid. The GIS spatial density analysis is widely used in urban spatial research. As a type of urban space, human settlements can also be analyzed with this method. Using the kernel density estimation (KDE) method, we simulated the changes in density values with the ArcGIS platform and, with the density of each raster pixel, were able to obtain the spatial distribution characteristics of the elements in question. The specific formulas used are reported in the literature (Sun et al., 2017).
The key to the application of kernel density analysis is the setting of “search radius.” A larger radius is helpful to make the hotspot area more obvious at the global scale. The bandwidth was determined according to the research of Ker and Goodwin (2000). The specific steps are as follows: (a) construct a 1000 m × 1000 m (Chen et al., 2016) grid to obtain 7,664 regular grids, connect the POI points to the grid, calculate the point value on the unit grid, and calculate the variance of the POI sample points; and (b) the radius is calculated using the formula

In the formula, h is the bandwidth, σ is the sample variance, and 4.3 km is taken after the bandwidth calculation. The kernel density classification method uses the natural breakpoint method.
The number of levels is set to four levels according to the needs of the research area and research content.
Correlation analysis
Correlation analysis was used to measure multivariate similarities, where the correlation coefficient is the ratio of the multivariate covariance to the standard deviation product. The correlation analysis was performed after normalizing the pixel symbol density to eliminate density deviation caused by the difference in the number of point elements (Y. Q. Shi et al., 2014). Using the correlation analysis and the methods described in section “Gravitational model,” we measured the matching degree between different living spaces.
Improved CRITIC method
The amount of different types of living space has an impact on the whole, and the proportion of various types of living space needs to be considered. The CRITIC method is a method that uses the degree of internal dispersion of the data to measure the overall characteristic weight (Diakoulaki et al., 1995). This study uses the average and correlation to improve the CRITIC method (the normalized average reflects all types of human settlements). The density of human settlement space in the study area is distributed. The correlation coefficient is used to measure the relevance of various types of living space. Calculate the weight of different types of living space to get the matching degree of living space:

where Wq is the weight of the q-type human settlement, Mq is the average pixel value of the qth personal space, and Corr pq is the correlation coefficient between human settlement area type p and human settlement area type q. The comprehensive equation to calculate the matching degree of the human settlement space is as follows:

where Vqk represents the pixel value of the kth pixel of the q-type human settlement.
Gravitational model
The human settlement environment system is a collection of interactions between different physical human settlement environments. The spatial interaction is a geographical concept that exists before the human settlement structure system. It is widely used in spatial layout (C. Li & Jin, 2016), tourism (S. Li et al., 2012), and trade (Li, Sun et al., 2018). Using this quantification of the interaction of different levels of human settlements, Jinan’s human settlement environment system can be visualized.
Using the POI density value, nighttime light, road network data, and statistical data, we developed a gravitation model to obtain the degree of interaction between different human settlements. The comprehensive intensity of nighttime lights indicates the scale of the human settlements:

where Pi is the size of the living space, SLi is the total amount of light in study area i, DNi is the gray value of the ith level, and Ci is the number of grids in the ith gray level.
Time network data were then established by converting the road network distance into time distance. First, the mountain points were extracted from the human settlement area, which were set as the center of the human settlement area. The road network data topology was modified, and the speeds corresponding to different road grades were obtained (i.e., highway = 75 km/h, provincial road = 60 km/h, national highway = 60 km/h, and county road = 40 km/h) using the ArcGIS10.2 to build a time network data set.
The gravity model was then based on the time distance, which was used to measure the interaction between human settlements at different scales:
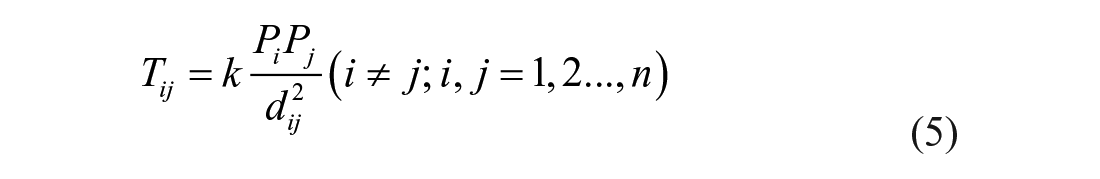
where Tij is the interaction intensity between i-human space and j-human space, n is the number of living spaces in the study area, and Pi and Pj are the size of the human settlement spaces. In the existing research, it is generally considered that k =1 (Q. Y. He et al., 2010), indicating that the attractiveness between the two cities is symmetric. But in fact due to the quality difference between districts and counties, the difference in receptive capacity is different when District A and District B are the subjects of force (Y. Y. Guo et al., 2012). Therefore, the value of k needs to be modified. During the preliminary investigation, we found that the two counties in the eight districts of Jinan have obvious differences in economic scale and industrial structure, as shown in Figure 2. And in the study of urban geography, the k value is often modified by the industrial output value. (C. Li & Jin, 2016). Human settlements are a form of human habitation, which are essentially cities and towns. Therefore, this study uses industrial output value to modify the value of k. Based on its uniqueness, the k value was corrected using the following formula:

where em is the output value of the mth industry in hotspot i of industry r and Em is the output value of the mth industry in hotspot j of industry r.

The framework of this article is presented as a flowchart.
In this study, the GIS spatial analysis, the gravitational model, and mathematical statistics were used to study the differentiation of human settlements in Jinan, China. First, the GIS analysis reflects the overall distribution of human settlements and the matching of different types of human settlements; second, the gravity model is used to quantitatively analyze the interaction of human settlements of different sizes; and finally, SPSS analyzes the impact of human settlement factors. The research framework is shown in Figure 3.
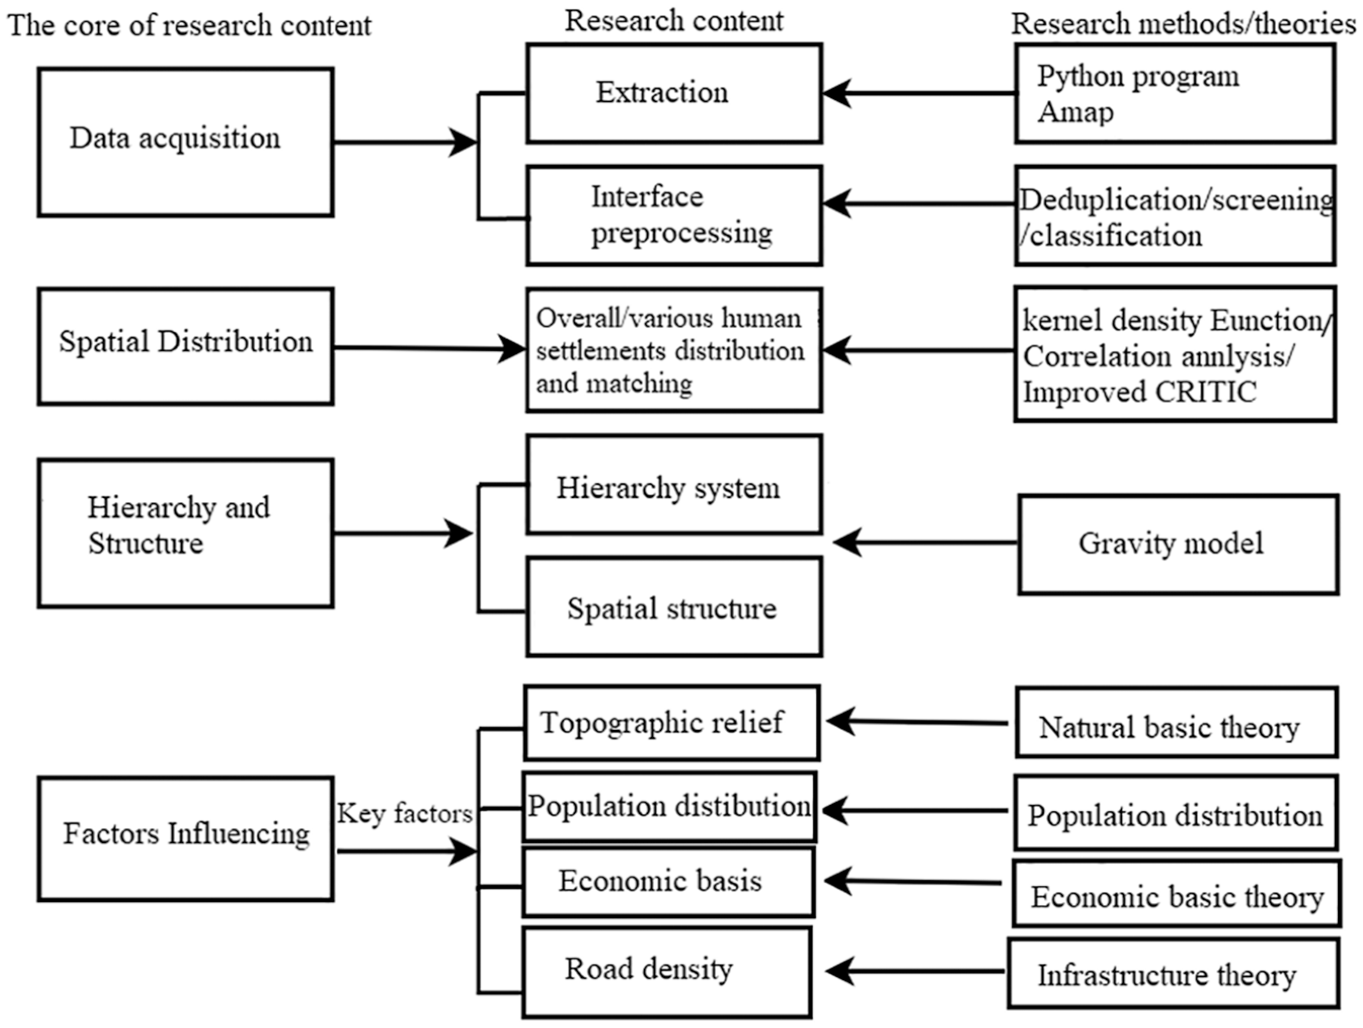
Research framework.
Results
Human Settlement Spatial Distribution
Overall spatial distribution of human settlements
As shown in Figure 4, POI data were used to obtain the eight types of human settlements: one core human settlement, comprising 33 blocks; one transitional human settlement, comprising 13 blocks; and six edge human settlements, comprising 15 blocks. According to the human settlement agglomeration characteristics, combined with the road networks and urban planning, the human settlement was divided into three layers: The core circle is the core human settlement space, which mainly corresponds to the planned ancient city and Shangyu District; the transitional circle is the street within the second ring of the old city; and the edge circle is the space excluding high road speed areas around the city.

Distribution of human settlements and circle structure.
The spatial distribution of human settlements in Jinan is agglomerated, with axial extension and multicenter distribution. The scale of human settlement in the five city districts is very clear. At the municipal scale, the agglomeration characteristics exhibit two main aspects. (a) A multicenter hierarchical system is observed that extends from the five city districts throughout the county. By comparing the eight types of human settlements, we found that the core human settlement space is distributed at the intersection of the five districts in the city. The human settlement areas of other districts and counties are limited by certain factors, such as facility resources and distance from the main city, and are all marginal human settlements. (b) The core human settlement area in the five city districts is in a contiguous form, which is linked to the road network and is clearly driven by characterization of traffic.
Distribution of different human settlement types
Here, we evaluate the distribution of multiple human settlement types to conduct a matching analysis of the multiple settlement types. The distribution is affected by differences in facility resource attributes. From a facility resource perspective, each type of human settlement space is analyzed using the nuclear density estimation method (Figure 5).

The spatial distribution of different human settlement types and circle structure.
First, the distribution of various human settlement types is similar to the overall distribution trend of human settlements, with one or more human settlements in each district and county that are blocky and axially extended. Second, we observe a value distribution, where the six types of human settlement agglomerations with high-value areas are distributed at the junction of the five city districts, whereas the low-value areas are distributed in other districts and counties outside the junction of the five city districts. Finally, there is a special type of human settlement space—specifically, business space. We know that there is no significant gathering area (i.e., human settlement area) in Shanghe County.
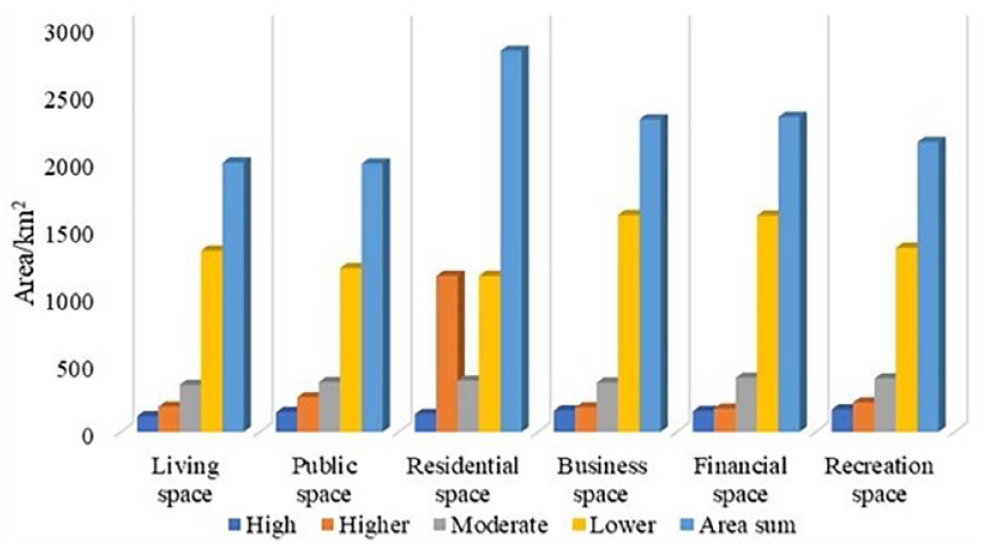
The distribution characteristics of various human settlement types are as follows. (a) Circular structures are observed in the six types of human settlements; the circular structure is significant in the five districts, as well as in the Zhangqiu District, in the city, but there is no circular structure in the other districts and counties. (b) The morphological characteristics include east–west extension, round shapes, and two-circle connections. The east–west extension is mainly distributed in the five city districts, whereas other districts and counties are round-shaped and the Changqing District exhibits a two-circle intersection distribution. (c) The central structure involves living spaces with clear entertainment space multicenter features. These multicenter structures are predominantly distributed in the central and northern parts of the Licheng District, whereas other districts and counties exhibit single-center structures. (d) Figure 5 shows the different aggregation levels for the areas of human settlements. As there is no significant agglomeration due to the lowest level of agglomeration, this area is not calculated. For the distribution area (Figure 5), the sum of the living areas is the largest and the total area of public space is the smallest. Living space refers to the basic human living area, which is the base for other activities. Therefore, it has the largest total area. Public space is mostly composed of facilities, such as hospitals and schools, whose distribution should consider the radiation range and audience. Therefore, they are distributed in areas with dense population and account for the smallest total area.
We used the correlation analysis formula and the improved CRITIC method to obtain the correlation coefficient (Table 3) and matching degree between different human settlement spaces (Table 4 and Figure 6). For the former, we normalized the spatial density images of various types of human settlements and analyzed the correlation between two types to obtain a correlation matrix.
Various Human Settlement Types of Spatial Correlation Matrix.
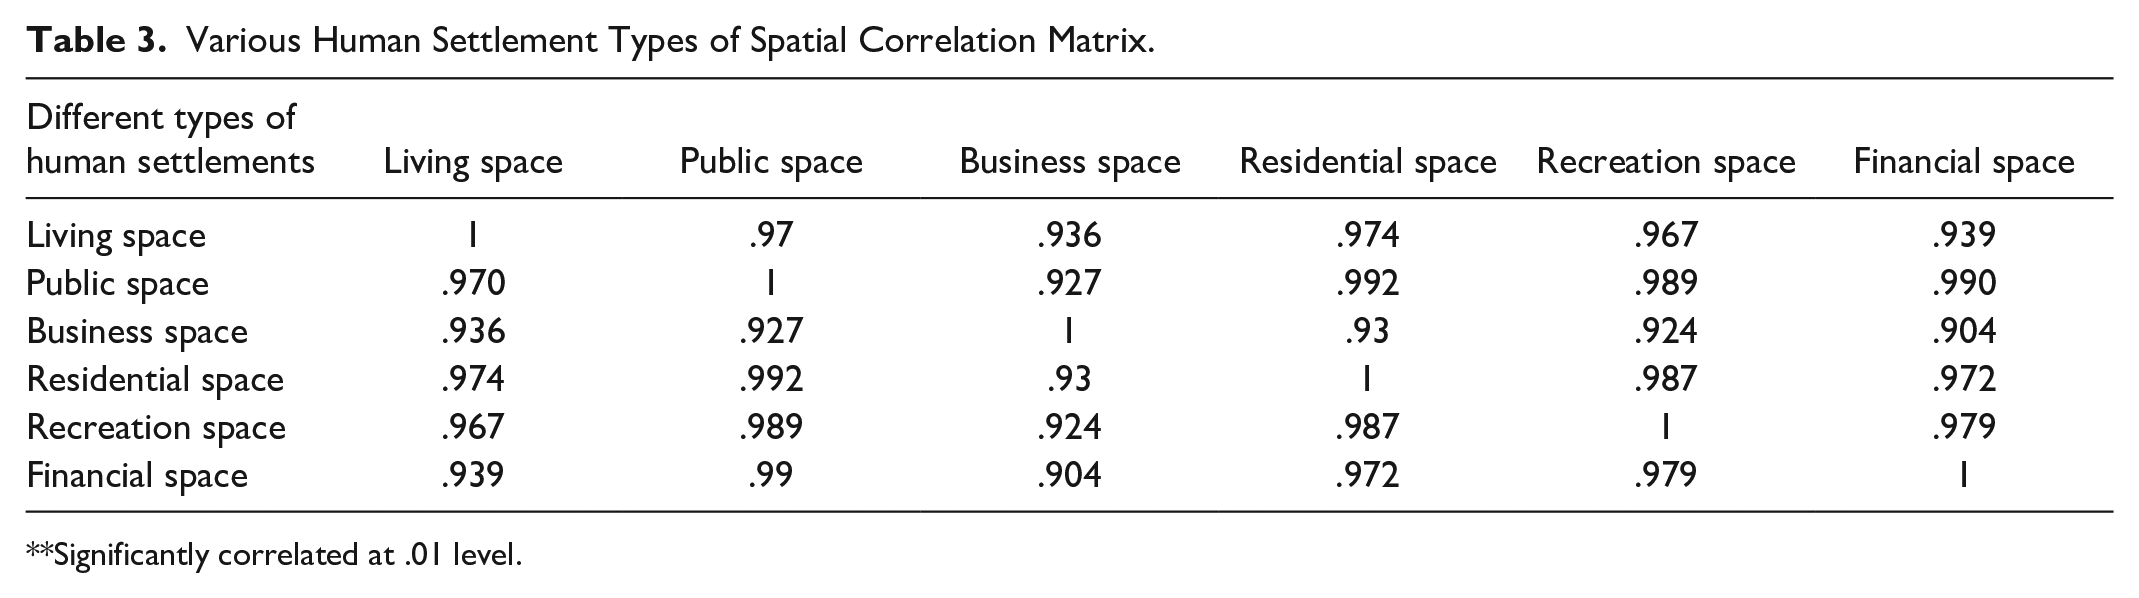
Significantly correlated at .01 level.
The Weights of Various Human Settlement Types.

The correlation between many human settlement types is greater than .9, which indicates a strong correlation. The correlation between the residential space and the public space is the highest, at .992, which shows strong spatial dependence. Conversely, the lowest correlation is observed between the financial and business space, at .904. To analyze the matching degree, we obtained the weights for various human settlement types using the improved CRITIC method (Table 4). Weights are based on the rounding principle, with three digits remaining after the decimal point. Based on Equation 2, we used the ArcGIS Raster Calculator to obtain the comprehensive score of each grid, which was then reclassified to obtain the matching degrees for different human settlement types (Figure 6).
Living space has the largest weight, reaching 67.8%, and all other space types have a smaller weight. This is because living space is the basic space for daily residential activities and requires a large amount of facilities and resources. The five districts within the city have the best matching degree, followed by Zhangqiu, Pingyin County, and Shanghe County, where the spatial distribution reveals a single-core multicenter model. From the east–west cross-sectional line, the matching degree of human settlements shows a double-peak mode, with peaks at the junction of the five districts and Shuangshan and Mingshui Streets in Zhangqiu. The highest matching degree for the human settlements includes the eastern part of Huaiyin District, the northern part of Shizhong District, and the western part of Lixia District, which indicates a distribution of east–west contiguous areas. The matching degree for human settlements is the highest in Zhangqiu District and annular, extending from north to south. Shuangshan and Mingshui streets in Changqing District are located adjacent to the city’s five districts, and the highest matching value is observed in Wenchang Street. The highest matching values for Shanghe, Jiyang, and Pingyin counties are located in Xushang, Jiyang, and Lushan streets, respectively.
Hierarchy and Structure of Human Settlements
In previous studies, the five city districts were grouped as a whole to analyze the grade and structure. However, in economic measurements, the high-tech zone is a separate economy because it is divided into part of the Licheng and Lixia districts and the area is small. Therefore, we included the high-tech zone within the five city districts of the city in this study.
Human settlement hierarchy
The gravitational model was used to obtain the radiation intensity of the human settlement areas (Table 5). The human settlements were divided into five levels based on differences in the number of radiation districts. The spatial representation is dominated by the five city districts, that is, Zhangqiu is the subdominant type and the other districts and counties constitute the edge-dependent hierarchical system of human settlements.
The Radiation Intensity of Human Settlement.

Based on the radiation intensity, the spatial distribution of the human settlements is the largest in the five city districts, with improvement in the external radiation effect for Zhangqiu District, whereas other districts and counties have weak external radiation effects. Overall, the Zhangqiu District has a relatively large radiation effect and is located in the central part of Jinan. Here, Zhangqiu occupies an advantageous position in the human settlement hierarchical system, such that it is suitable for development into a subcenter of Jinan human settlements.
Human settlement spatial structures
The external radiation value, that is, the external gravity, is calculated by the gravitational model and is divided into four levels by the natural discontinuity method to obtain the living space structure (Figure 7). Human settlement in Jinan presents a radial structure centered on the five city districts. The interaction intensity between the districts and counties is related to certain factors, such as economic status and spatial distance. If the economic situation is favorable, the five districts will have a closer connection with other districts and counties. The five city districts serve as the administrative center of the city, with Zhangqiu as the subcenter. The two are more closely connected with other districts and counties; the spatial distance between the districts and counties is inversely proportional to the interaction intensity. For example, the correlation degrees between Shanghe County and Pingyin, Shanghe and Zhangqiu, and Pingyin and Zhangqiu are all four levels. However, there is a strong connection between the human settlement areas of each district and county and the human settlement areas of the five city districts, which indicates that modern transportation technology results in a weaker geographical connection compared with a functional connection (Figure 8).

Matching degrees for different types of human settlements.

The human settlement space structure.
The density of regional interaction lines is affected by administrative divisions that form a pattern of “western dense, eastern sparse,” with the five city districts as the center. The strong attraction of the dominant human settlement areas results in strong centripetal tendencies in the other districts and counties. Moreover, improvements to the transportation network have led to a leaping connection in the nonadjacent districts and counties, which promotes multicentered and centripetal spatial human settlement structures.
Factors Influencing Human Settlement Differentiation
Nearest neighbor analysis (NNA) is a commonly used method in urban geography. The NNA index is used to ascertain whether the distribution of the midpoints of the region is random or agglomerated. If it is greater than “1,” it is randomly distributed, and if it is less than “1,” it is agglomerated. In this study, NNA was used to measure the nearest neighbor ratio of the point as 0.12, which is less than “1”; thus, there is less than a 1% probability that the POI point will generate random clustering, which is a significant agglomeration caused by numerous factors. Based on the available data and analysis capabilities, four factors (i.e., geomorphological features, road network density, economic factors, and population density) were selected to analyze their relationship with human settlements. The four impact factors were quantified using Statistical Product and Service Solutions (SPSS), which was implemented after normalization. For a significant p value of .01, the correlation coefficients between human settlement distribution and terrain fluctuation, road network density, gross domestic product (GDP), and population density are .998, .989, .985, and .983, respectively. Thus, there is a coupling relationship between the spatial distribution of human settlements and low-value areas of terrain fluctuation, high-value areas of road network density, high-value areas of GDP, and high-value areas of population density. Each factor is discussed below (Figure 9).
Topography restricts the development of productivity in the region, which in turn affects the differentiation of human settlements. Because of topographic fluctuations, the spatial distribution of human settlements in Jinan follows a “unipolar-multicenter” model. Figure 9a shows that the terrain in the northern and central parts of Jinan is characterized by less undulation, whereas the terrain in the south has more undulations. Compared with Figure 2, we clearly observe that the agglomeration areas of human settlements are distributed in the adjacent river areas where the terrain has fewer undulations. Superior natural conditions are conducive to population agglomeration, urban infrastructure construction, and the formation of human settlements.

The factors affecting the distribution of human settlements. In summary: (a) superior natural conditions are conducive to the formation of human settlements, (b) areas with high population density are more likely to have a radiation effect on surrounding areas, (c) the economic base of the five-zone junction is superior to the surrounding districts and counties and consistent with the spatial distribution of human settlements, and (d) road network density is the leading factor that controls the distribution of human settlements.
Population aggregation is a prerequisite for the formation of human settlements, that is, a linear correlation exists between these two factors. Rudimentary forms of human settlements are mostly distributed in population-concentrated areas, where the scale of agglomeration increases and the level of human settlement differs. As shown in Figure 9b, the population density distribution coincides with the spatial distribution of human settlements. Areas with high population density are more likely to become high-level living spaces and have a radiation effect on surrounding areas. The central part of Jinan is a high population distribution area. In addition, Xushang (Shanghe, Taiping Town), Jibei (Jiyang), and Yushan Streets (Pingyin) are high-value areas with high economic development, whose human settlement areas are larger than those in other regions.
As an important indicator of the economic foundation, GDP is a key factor in the formation of human settlement structures. The economic base of human settlements has a direct impact on the center’s external radiation intensity, such that areas with improved economic bases are more likely to become high-level human settlements. According to Figure 9c, the economic base of the five-zone junction is superior to the surrounding districts and counties and consistent with the spatial distribution of human settlements in Figure 3. Therefore, the human settlement level is higher in this area.
As an important manifestation of urban traffic layout, road network density is the leading factor that controls the distribution of human settlements and an important factor that restricts the level of human settlement. The distribution of human settlements is clearly controlled by road networks, which reflects the link between the regions and exterior areas. Elevated road network densities yield increased accessibility. As shown in Figure 9d, the road network density in Jinan is approximately identical to that of the human settlements, that is, greater in both the central part and east–west extension. Furthermore, the high-value area of road network distribution in Shanghe, Zhangqiu, Jiyang, and Pingyin is approximately identical to that of the human settlements.
Other factors, such as urban planning and historical conditions, can affect the differentiation of human settlements. The development of human settlements is constrained by the geographical environment and is linked to urban economic development. At the same time, the development of human settlements requires urban planning and policy guidance. In the past, urban planning has typically been concentrated in the city in terms of capital investment and support. The marginalization effect of districts and counties has been significant, with superior development history, infrastructure, and economic foundation in regional administrative centers, whose appeal is generally stronger than other regions.
Discussion
Research Perspective
The research objects and perspectives of human environment are diverse. On the macro level, natural adaptation (Feng et al., 2009; X. M. Li & Liu, 2003), comprehensive evaluation (X. M. Li et al., 2019; Wei et al., 2019), evolutionary exploration (W. Z. Zhang et al., 2013), and so on are the traditional research objects. Differences in research objects have led to diversified research perspectives, including urban commuting (X. M. Li et al., 2019), separation of work and residence (Zhen et al., 2017), and evolution of employment space (H. Wang & Wu, 2019). Traditional research pays more attention to the spatial differences of human settlements. This study finds that there are also differences in horizontal types and hierarchies in residential settlements. The residential settlement environment meets the basic needs of human beings and has the largest area. Minimal, from a research perspective, similar to traditional research, both take the human settlement element as the starting point. This study chose the human settlement and environment facility resource element perspective to try to explore the differentiation law of the human settlement environment based on this factor. The research finding is that there is consistency between the perspectives of facility resources and traditional perspectives, that is, the more concentrated the facility resources are, the more likely it is to form a human settlement.
Research Methods and Data
Traditional human settlement research mostly uses statistical yearbooks (X. M. Li et al., 2019), questionnaires (Cong et al., 2013), and GIS grids (Tang et al., 2008) to conduct human settlement research. This study introduced the use of POI data into human settlement environment research. Based on the POI attribution information, it was found that there is a strong spatial dependency of various types of human settlement environments, and the correlation is the highest between residential and public types. In terms of research methods, questionnaire survey methods (Saitluanga, 2013), analytic hierarchy process (AHP) (Achillas et al., 2011), entropy method (X. M. Li & Jin, 2012), and structural equation model are used alone or in combination mainly. In addition, few other studies have applied the gravity model to the study of human settlement environment. The POI density value was used to determine the human settlement environment center. The nighttime light data represent the scale of the human settlement environment. The gravitational model constructed by combining road network data and the k value was corrected through the industrial output value. The effects had a positive correlation. At the same time, it demonstrates that the gravity model can be applied to the study of human–environment interactions.
Limitation
Because new districts and counties emerged after the reform of administrative divisions in Jinan, the amount of data is small. Furthermore, because auxiliary data, such as population, GDP, and real-time data for the same year, were used and these data are difficult to obtain, the accuracy of the data is limited. Based on the existing data, we evaluated the differentiation rules of human settlements and obtained several preliminary results. In the future, we will be able to obtain more data on settlements after the reform period, conduct more in-depth research, and build a more comprehensive research framework for human settlements.
Research Contribution
This study has enriched the research on human settlement environment from a theoretical level, by adding to the data available for human settlement study, demonstrating the application of nuclear density analysis and gravity model in this field, and introducing the theory of polycentric and urban interaction into the study of human settlement environment. On the practical level, it provides a decision-making basis for the continued construction and management of the human settlement environment in Jinan, in a way that could improve the quality of life and social happiness of the residents. By visualizing the differentiation trends between the human settlement environments, the current development of various human settlement environments and their rational allocation of facility resources have been clarified and can be adjusted in response.
Conclusion
This study evaluated the differentiation trends between human settlements in Jinan, China, using the GIS spatial analysis, a gravity model, and mathematical statistics. First, the GIS analysis reflected the overall distribution of human settlements and the matching degree of different types of human settlements. Second, the interaction of different scales of human settlements was quantitatively analyzed by the gravity model. Finally, SPSS was used to analyze using the factors that influence human settlement spatial distribution. As a result, the following conclusions can be drawn:
The trends in spatial differentiation of human settlements in Jinan were obtained. The spatial distribution of various types of human settlements is similar to that of the overall human settlements. It is characterized by a blocky, axially extended, multicenter development pattern, with a circular structure, contiguous propagation pattern, and scale difference characteristics. The human settlements of the five city districts have obvious scale advantages. The matching of various human settlement types is highest in the five city districts and lowest in Pingyin and Shanghe. The human settlement system has obvious radial characteristics, the spatial structure has concentricity and polycentricity, and the intensity of regional connections shows a pattern of “western dense, eastern sparse.” In the future construction of human settlements, attention should be paid to the construction of a polycentric structure, and the role of high-level living environment centers should be considered for their leading role to promote a focused and balanced development of the city.
The influencing factors of spatial differentiation of human settlement environment in Jinan were obtained. Terrain and landform determine the distribution of human settlement. The infrastructure and population density represented by road network density reflect the scale of human settlements. GDP affects the external attraction of human settlements. In areas with excellent natural conditions, strengthening infrastructure construction, rationally controlling population density, and promoting sustainable economic development are important directions for the future development of human settlements.
The research results show that the differentiation between human settlement environments from the perspective of facility resources is consistent with the current urban planning of Jinan. Therefore, from this perspective, using POI big data to study the human settlement environment is a reliable and useful reference. It is consistent with the basic theories of the central place and urban space. Direction for future research will include increasing the amount of data, refining research, and enriching the research framework for human settlements.
Footnotes
Author Contributions
All the authors were involved in the creation and planning of the study. All the authors have read and approved the final manuscript.
Declaration of Conflicting Interests
The author(s) declared no potential conflicts of interest with respect to the research, authorship, and/or publication of this article.
Funding
The author(s) disclosed receipt of the following financial support for the research, authorship, and/or publication of this article: This work was funded by the National Natural Science Foundation of China (No. 41671158), Social Science Planning Fund Project of Liaoning Province (L19CJY007), and The Major Research Projects of think-tank of Dalian Academy of Social Sciences in 2019(2019dlsky023).