
Abstract
This study aims to explore the effect of innovation institution on spatial transfer of energy industry in Jiangsu, China. We focus on the disparity of innovation and energy industry, and analyze the spatial transfer difference in different types of energy industry, rather than view energy industry as a whole. The study demonstrates the spatial change of energy industry at regional level and maps the spatial pattern at city level. The study chooses intellectual property rights (IPRs) protection intensity, authorization patents and local research and development (R&D) investment as the proxy of innovation. Using official data and employing panel fixed-effect model at city-industry level, we conclude (a) innovation abilities significantly influence the spatial transfer of energy industry in Jiangsu. Especially, due to the different time, IPRs protection, patent counts, and R&D investment have different effects on different regions in Jiangsu; (b) 2010 is an important turning point for energy industry development in Jiangsu, and after 2010, the energy industry begins to shift to the middle and northern Jiangsu, whereas the spatial pattern of energy industry in coastal cities is basically unchanged; (c) there is a great difference between the regions in Jiangsu Province, and industrial upgrading has not been achieved in northern Jiangsu.
Introduction
In recent years, rising energy prices has slowed economic growth and increased the costs of global economic growth (Ewing & Malik, 2017). The combination of energy development and environmental protection has become a challenge for economic growth. Thus, countries all over the world are committed to the development of energy industry (Lin & Xu, 2018). Meanwhile, there is an emerging literature on the effect of institution factors on spatial planning of industries and enterprise location, such as transport institution, economic policy, and so on (Boschma, 2004; Gregory, 2012). In addition, innovation institution plays an important role in energy industry development (X. Gao & Zhai, 2018). Especially, patented energy technology will be incentives for industrial investment (Lee et al., 2017). Moreover, innovation capability has become an important factor in the development and the spatial pattern evolution of China’s energy industry (X. Gao & Zhai, 2018). Combining above literatures, we ask whether innovation institution, including intellectual property rights (IPRs) protection, research and development (R&D), and patent counts, can help explain the spatial transfer of energy industries across regions and cities.
Also, some studies have focused on the spatial pattern of China’s energy industry. Based on industrial output value, Dong et al. (2016) map the spatial distribution and cluster pattern of renewable energy industry in China and conclude that there is agglomeration of renewable energy industry in Yangtze River Delta and Bohai sea region by emphasizing China’s regional disparity. Huang and Liu (2017) analyze China’s renewable energy transitions from a geographical perspective and think that southern China has substantial advantage in fostering industry clusters. Overall, researchers have approved the following: (a) Institution is important for spatial planning of industries (Block & Keller, 2010); (b) innovation is closely related to industrial growth (Dixon & Greenhalgh, 2003; Shavell & Ypersele, 2001); (c) China’s regional disparity affects energy industry development significantly (Dong et al. 2016; Huang and Liu, 2017). However, very little has been written about the role of innovation institutions in the location choices of energy industry, especially IPRs protection. In addition, little is known about the spatial distribution of energy industry at urban levels and the impact of different innovation forces, such as IPRs protection, patent counts, and R&D investment, on the spatial patterns of enterprises in energy industry. Also, the differences of different types of enterprises’ spatial transfer paths are overlooked.
Thus, the present study aims to examine the impact of regional and urban innovation institution on spatial transfer of energy industry in Jiangsu province, China. The article chooses three variables of IPRs protection intensity, authorization patent percentage, and local R&D investment percentage to measure innovation institution. Employing the China Industry Business Performance Database and Jiangsu Statistics Yearbooks, the study constructs fixed-effect panel models at city-industry level to explore the role of innovation institution in spatial transfer of different kinds of energy enterprises.
The study contributes to the existing literature in two ways. First, the research discusses IPRs protection at regional economics level, rather than national level, and focuses on the disparity of innovation and energy industry. Second, the study analyzes the spatial transfer difference between different types of energy industry, rather than view energy industry as a whole. In the article, to understand the spatial and temporal evolution of regional energy industry more comprehensively, and to provide decision support for future industrial transfer and industrial spatial distribution, we divide the energy industry into three categories by counting and calculating the gross industrial output value and export delivery value at the enterprise level. Based on whether the product meets the needs of the domestic market, the enterprises are classified into enterprises meeting domestic demand and export-oriented enterprises, whose spatial transfer can reflect the change of spatial agglomeration of enterprises serving domestic and international markets, respectively. In addition, we also focus on the spatial transfer of foreign investment energy enterprises because the innovation ability of these enterprises is relatively strong, and the regional innovation institution has a greater impact on the location choice of these enterprises (Piperopoulos et al., 2018; Shahbaz et al., 2018). This classification is similarly to the work of W. Li and He (2017) where they divided the manufacturing industry into gross industrial output value for domestic sale, total export delivery value, and export delivery value of export-oriented enterprises. Relying on above classification, the study quantitatively analyses the differences between the three types of enterprises’ spatial transfer caused by innovation institutions in Jiangsu province.
The study is organized as follows: Second section presents brief literature review on spatial planning of industries and its determinants. Third section describes the spatial patterns of energy industry in Jiangsu at regional and urban levels. Fourth section clarifies our data and method. Section 5 conducts analysis based on the empirical results. Finally, fifth section presents our conclusions.
Literature Review
Institution and Spatial Planning of Industries
The role of institution in spatial planning of industries has been widely discussed. From the perspectives of demand and supply, institution factor has an important influence on spatial planning of industries and enterprise location (Gregory, 2012). For example, S. Wu and Yang (2018) conclude that when high transport institution costs promote industries tending to choose locations with stronger demand conditions. From the perspective of supply, proximity to suppliers or industrial clustering is important for industry growth and innovation institution in the wider economy (Hansen, 2014; Innocenti & Lazzeretti, 2019). In addition, institutions affect industries by changing the enterprises and technology mature (Gregory, 2012). Overall, governments frequently attempt to attract enterprises by institutional mechanisms, such as land policy, technology subsidies, competition protection, and so forth (Block & Keller, 2010; Huang et al., 2017). Especially in China, the institutions of local governments attracting investment have become an important determinant of regional economic growth. Local governments take advantage of all kinds of institutions or policies to affect pace and direction of industry growth, and that they tend to expect different impacts at different times to regional innovation (growth) or official promotion (Newell & Raimi, 2018; X. Zhu et al., 2018). These institutions include investment incentives, macroeconomic policies, IPRs, and so forth. (Block & Keller, 2010).
IPRs Institution and Industrial Development
Theoretical and empirical evidence has indicated that IPRs institution plays an important role in the development of firms or industries (Dixon & Greenhalgh, 2003; Toma et al., 2018; Woo et al., 2015). Niwa (2016) indicates that patent protection is significantly related to industrial growth, though there exist different impacts in different regions. To attract industries and promote innovation, governments hope to update or design a new IPRs system to be against a direct reward system (Ford, 2017; Roin, 2014; Shavell & Ypersele, 2001). In China, policy from the central government is vague. Therefore, on the premise of not violating central policy, local governments can formulate policies conforming to the locally actual conditions, and thus there are differences in the intensity of IPRs protection between China’s regions. Moreover, with the economic decentralization in China, the responsibility for economic growth is becoming increasingly detailed, leading to competition and inequality between regions and cities (F. Wu, 2016). The specific manifestation of IPRs protection at regional level is that different regions have different incentives and preferential policies for patent technology, different penalties for infringement, and different awareness of IPRs. In China, both IPRs protection and industrial growth tend to be stronger in the east and the weaker in the west. Although the city-region is the result of state spatial selectivity in China (Zou & Zhao, 2018), regional industrial growth still varies because of the geographical location and spatial planning. Thus, due to the disparity of city-region, IPRs protection and its effect on industrial development are different spatially.
In addition, IPRs institutions can help to upgrade industry and form regional clusters. China’s industries are constantly integrating into the global value chain and rely heavily on industrial agglomeration (S. Zhu & He, 2017). Meanwhile, after joining World Trade Organization (WTO), China has enjoyed the benefits of global trade liberalization, and China is fully involved in the international division of labor and occupies an important position in the global value chain (He & Chen, 2017). China’s exports have been growing rapidly in recent years, but many industries in China are still at the low end of the value chain (He & Chen, 2017). Therefore, the most fundamental reason why industrial upgrading is difficult is that China does not have the core technologies and independent IPRs (X. Gao & Zhai, 2018). More importantly, in China, the greater the breadth of the market is in a region, the lower the quality of the labor-intensive industries is, meaning that the labor-intensive industries will not be upgraded due to the increasing participation of global production, whereas they may exploit the market using low-quality products (He & Chen, 2017). Thus, through regional economic planning, an interaction mechanism between IPRs, scientific and technological innovation, and industrial development should be established. Meanwhile, cultivating high value core patents promotes the integration of industrial chain, value chain, and innovation chain, helping to contribute to industrial upgrading. In addition, the rational IPRs planning of local governments is conducive to attracting foreign capital and multinational companies, so as to enhance regional and global technology exchange and enlarge the role of technology diffusion. Moreover, the rational IPRs planning also can promote R&D of science and technology, realize industrial agglomeration, and improve regional competitiveness.
R&D, Patent, and Innovation
The implementation process of innovation institutions also involves in input and output, and they are measured by R&D investment and patent counts in the existing literature (Chen & Puttitanun, 2005; Lee et al., 2017; Wei et al., 2015; Weinhold & Nair-Reichert, 2009). Patent counts are widely viewed as the value of industrial innovation. However, Schankerman and Pakes (1986) first argue that simple patent counts are not a good measure of innovative output for the value distribution of patents is skewed, and they use patents of France, Germany, and the United Kingdom to demonstrate uneven innovation distribution. Therefore, Putnam (1996) extends the usefulness of patent data by using patent applications and renewals to test the distribution of domestic and foreign innovation, and the results show that international patent data are significantly useful because they can form the estimation of total value of innovation, rather than in one particular country. Thus, the spatial disparity of patent counts can affect the regional innovation and industrial growth. In China, regional or urban governments unilaterally pursue the number of patents, and improperly grant patent applications, which may cause regional or municipal governments to overestimate their own innovation ability of industries (X. Zhu, 2017). In addition, patent counts are also criticized because they only present output of industrial innovation rather than the process of innovation (Weinhold & Nair-Reichert, 2009). Though there exist above shortcomings, patent counts are still effective at the highly aggregated level (Grafström, 2018; Johnstone et al., 2017; Weinhold & Nair-Reichert, 2009), because patenting is related to inventive activity overall and is an adequate proxy for industrial innovation at highly aggregated level (Griliches, 1987; Weinhold & Nair-Reichert, 2009). Thus, patent counts, to some extent, can measure the industrial innovation and development. Accordingly, R&D investment is viewed as an input measure of industrial innovation (Chen & Puttitanun, 2005; de Rassenfosse et al., 2013; L. Gao et al., 2016), and R&D is closely correlated with market value of industries (Ballas & Demirakos, 2018; Castellacci & Lie, 2015). In addition, because R&D is affected by IPRs protection (Sunil, 2012), there may exist multicollinearity in the model of this study, and we conduct Pearson’s test to deal with this issue.
Spatial Pattern of Energy Industry in Jiangsu
Geographical Agglomeration of Energy Industry
The Gini coefficient is originally used to measure the degree of imbalance, and the geographical agglomeration of industries is also an imbalance (W. Li & He, 2017). Therefore, the study chooses spatial Gini coefficient to measure geographical agglomeration of energy industry, which has been proved to be effective by W. Li and He (2017). The value of geographical agglomeration of industries is from 0 to 1, and higher value indicates higher geographical agglomeration. The model testing geographical agglomeration of industries follows:
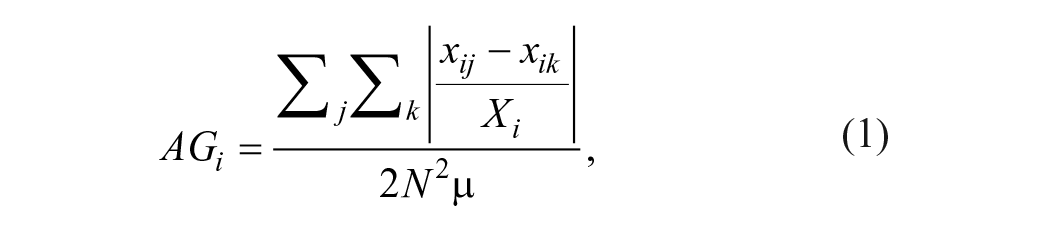
where xij or xik is the industrial production of i industry in a city j or k; Xi refers to the industrial production of Jiangsu Province; μ is the mean of energy industry at the prefectural city level, and N is the number of administrative hierarchy of cities.
Spatial Pattern of Energy Industries Transfer
Spatial agglomeration of energy industry, to some degree, can explain the trend of its spatial transfer. To analyze the change of spatial agglomeration on energy industry in Jiangsu, the study selects all types of industry, including mining industry, as well as production and supply industry of electricity, heat, gas, and water in Jiangsu Statistic Yearbooks. Also, to cover all the energy industries, in manufacturing industry, this study chooses petroleum processing, coking and nuclear fuel processing industry, nonmetallic mineral products industry, and so forth, which belongs to energy industry. In addition, according to geographical location, 13 cities in Jiangsu are divided into three categories: southern Jiangsu (Nanjing, Suzhou, Wuxi, Changzhou, and Zhenjiang), middle Jiangsu (Yangzhou, Taizhou, and Nantong), and northern Jiangsu (Xuzhou, Lianyungang, Suqian, Huaian, and Yancheng). Also, there are three coastal cities in Jiangsu, including Nantong, Yancheng, and Lianyungang. Overall, the southern cities are more developed than the northern cities in Jiangsu.
Figure 1 demonstrates the spatial Gini coefficients changes of four kinds of energy industries in Jiangsu province. The first kind is the total energy industrial output value of all energy enterprises. The change of spatial Gink coefficients in this kind energy industry reflects the agglomeration change of overall energy industry. The second kind is the total energy industrial output value of enterprises meeting domestic demand. We use the difference between total value of energy industrial output and the value of export delivery. Its spatial Gini coefficient can reflect the change of spatial agglomeration of enterprises serving domestic market. The third is all export value of delivery on energy industry (export-oriented enterprises). Its change of spatial Gini coefficient reflects the aggregation change of export. The fourth is the total energy industrial output value of foreign investment and Hong Kong, Macao, and Taiwan enterprises (foreign investment enterprises). IPRs protection has a great influence on the location choice of such enterprises.

Changes of energy industry spatial Gini coefficient from 2000 to 2017.
Regarding Figure 1, from the perspective of time, the spatial agglomeration of energy industry can be divided into two stages. The first stage is from 2000 to 2010. During this period, the spatial agglomeration of all kinds of energy industry has been on the rise. For example, the Gini coefficient change of the total energy industrial output value of all energy enterprises is from 0.48 in 2000 to 0.53 in 2010. In addition, the spatial Gini coefficient changes of other types have also been improved during this period. The second stage is after 2010. Energy industry’s spatial agglomeration begins to decline in Jiangsu in this stage. According to Figure 1, because of the limited reduction of foreign investment enterprises and all export-oriented enterprises, the decrease in the total energy industrial output value of all energy enterprises is mainly due to the decline of enterprises meeting domestic demand. This phenomenon shows that the enterprises meeting domestic demand are the main bodies of spatial transfer of energy industry. In addition, the Gini coefficient change of foreign investment enterprises is the highest, indicating a high spatial agglomeration of foreign energy enterprises in Jiangsu.
Figure 2A to D reports the change of energy industry at four regional levels, including southern Jiangsu, middle Jiangsu, northern Jiangsu, and coastal cities of Jiangsu. According to Figure 2A, before 2010, overall energy industry is gradually concentrated in southern Jiangsu, and coastal cities, while after 2010, the proportion of energy industry increasingly rises in northern Jiangsu and middle Jiangsu, especially in northern Jiangsu. Though the proportion in southern Jiangsu and coastal cities decrease, southern Jiangsu still has an absolute advantage. Figure 2B reports the percentage of output value of enterprises meeting domestic demand, except northern Jiangsu, the percentages in other three regions increase gradually before 2006. After 2006, the output value in southern Jiangsu decreases sharply, whereas the value in northern Jiangsu witnesses a significant increase after 2009. According to Figure 2C, export delivery value in southern Jiangsu experiences a steady slide, while that of other three regions slowly rise, indicating that exports gradually shift to northern Jiangsu, middle Jiangsu, and coastal cities, particularly northern Jiangsu. Thus, the change of export spatial pattern is mainly manifested in the continuous decline of exports proportion in southern Jiangsu and the gradual growth in northern Jiangsu. Figure 2D which is export delivery value of foreign investment energy enterprises again witnesses the results of A. According to Figure 2D, southern Jiangsu experiences a sudden drop, while northern Jiangsu rises sharply after 2005, meaning that foreign investment energy enterprises have spread to northern Jiangsu. Overall, over time, energy enterprises have gradually shifted from southern Jiangsu to northern Jiangsu, whereas the advantages of southern Jiangsu are still obvious. The growth of energy industry in middle Jiangsu and coastal cities is mainly reflected by enterprises meeting domestic demand, while the export-oriented enterprises have not transferred to the above two regions on a large scale. The spatial pattern of foreign investment enterprises is mainly reflected in the rapid rise of northern Jiangsu and the sharp decline of southern Jiangsu.

Change of energy industry at regional level in Jiangsu province.
Figures 3 to 6 map the spatial pattern evolution of energy industry at urban level in Jiangsu province. Overall, the spatial pattern of energy industry has experienced the change from agglomeration in southern Jiangsu to the diffusion in northern Jiangsu. Especially, the change is very clear in recent years. First, we focus on the percentage change of overall energy industry output (Figure 3). From 2000 to 2009, the overall energy industry mainly gathers in Wuxi and Suzhou which belong to southern Jiangsu. However, from 2010 to 2016, the overall energy industry begins to move to the northern Jiangsu, such as Xuzhou and Suqian. Meanwhile, the overall energy industry in middle Jiangsu (Yangzhou, Taizhou and Nantong) has also begun to increase. Therefore, on the whole, the energy industry in Jiangsu is spread northward. Second, we understand enterprises meeting domestic demand (Figure 4). From 2000 to 2009, this type of energy industry mainly gathers in northern Jiangsu and middle Jiangsu, especially Lianyungang, Suqian, and Huaian. After 2010, it begins to move to the southern Jiangsu. Third, regarding export-oriented energy industry (Figure 5), its trend is in line with that of overall energy industry output. Before 2010, the export-oriented energy industry is gathering in southern Jiangsu, such as Suzhou, Wuxi, and Nanjing, whereas after 2010, cities in the middle and northern Jiangsu have also agglomeration of export-oriented energy industry, like Xuzhou, Huaian, and Nantong. Finally, foreign investment enterprises also experience the process of spatial diffusion (Figure 6). The cities of foreign investment enterprises diffusion are mainly Xuzhou, Lianyungang, and Suqian after 2010, and they all belong to northern Jiangsu. Consequently, overall, energy industry in Jiangsu has experienced the spatial change from agglomeration in southern Jiangsu to the diffusion in middle and northern Jiangsu, and this change is mainly caused by export-oriented energy enterprises and foreign investment energy enterprises. Energy enterprises meeting domestic demand has spread to southern Jiangsu, but the proportion is very small.

Change of overall energy industry output at city level in Jiangsu province.

Change of enterprises meeting domestic demand at city level in Jiangsu province.

Change of export-oriented energy industry at city level in Jiangsu province.
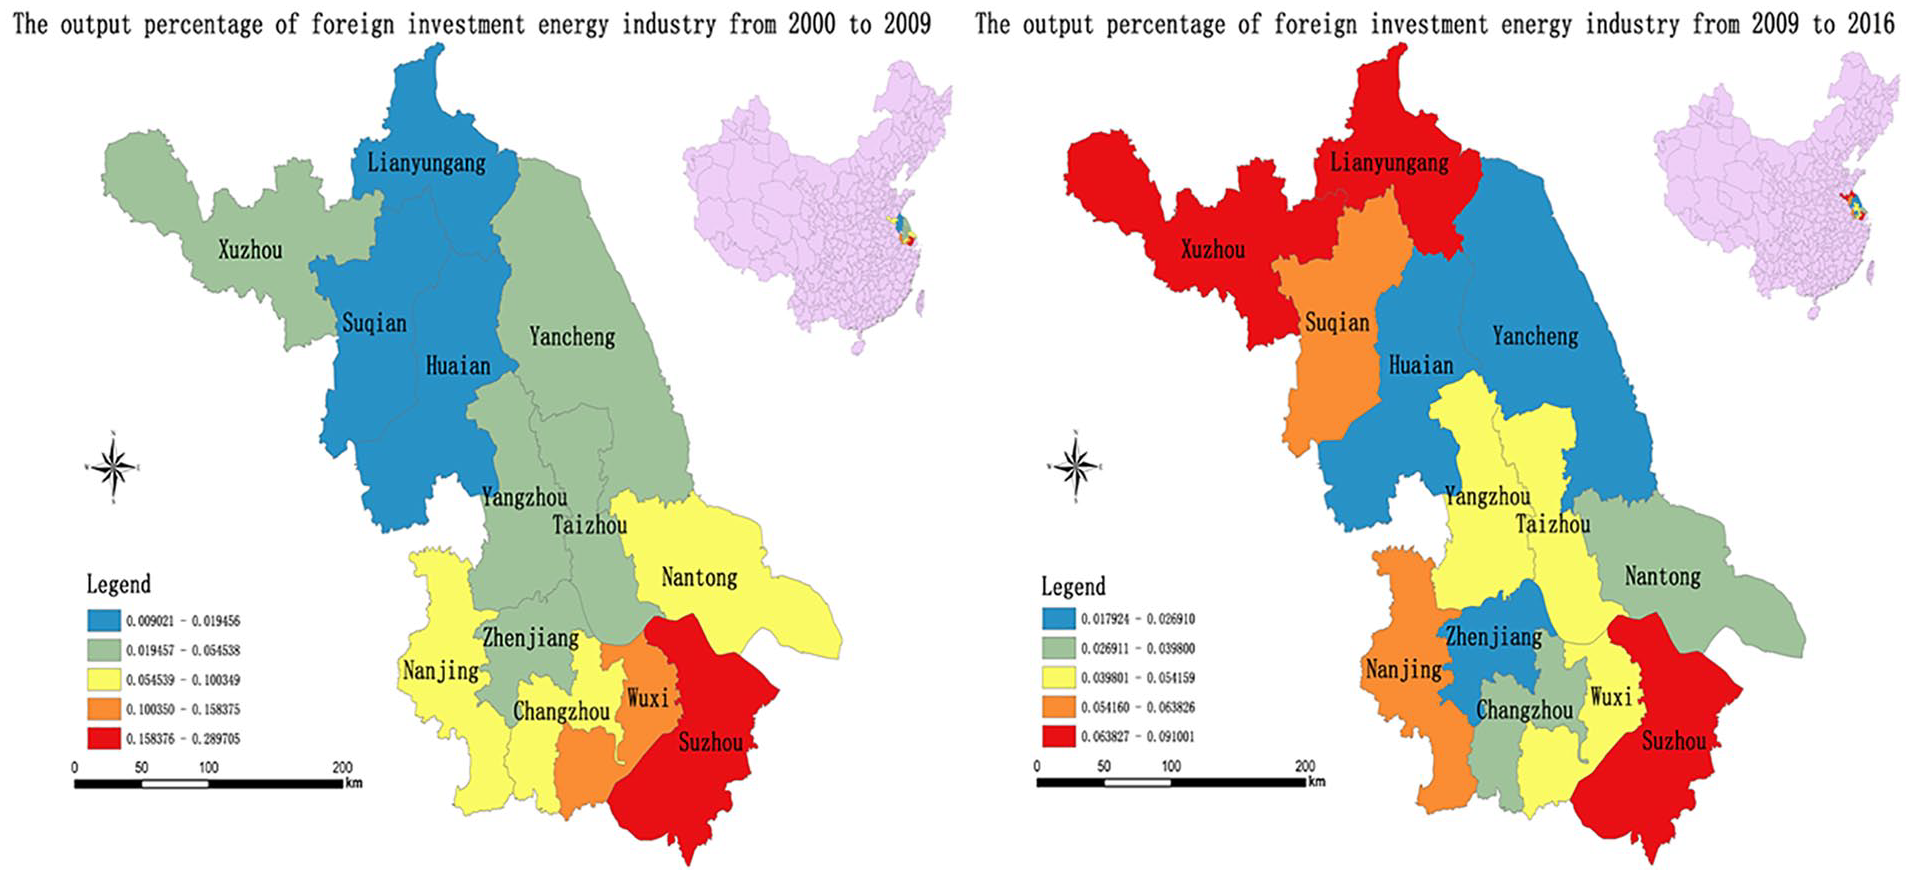
Change of foreign investment enterprises at city level in Jiangsu province.
Method and Data
To test whether innovation institution is an important factor in spatial transfer of energy industry from the perspectives of domestic market, export-oriented enterprises and foreign investment enterprises in Jiangsu, as well as to explore whether energy industry realizes industrial upgrading in the process of spatial transfer, we establish panel data regression model at city-industry level. Moreover, when we conduct panel estimation, fixed-effect model is used because it can ensure the consistency of model estimation and solve the endogeneity problem caused by missing variables, to a certain extent (W. Li & He, 2017). Overall, panel data regression model facilitates the control of individual heterogeneity (individual effect and time effect), reduces the possibility of collinearity among variables, and increases the freedom degree as well as estimation effectiveness. In addition, this model can contain more information and contribute to the dynamic adjustment of analysis. Meanwhile, the development of innovation institution and the speed of industrial transfer may not be synchronized in our study, that is, there is asymmetry between them (Zheng, 2012). The panel data model can jointly consider the timeliness and richness of data to construct a fixed-effect regression model, so as to solve the asymmetry between economic variables (Koenker, 2004). Moreover, this method is helpful to eliminate individual effects, so that the estimation is not affected by data spikes, thick tails, heteroscedasticity, non-normal, outliers, and so on, while retaining the original meaning of variables (D. Wu et al., 2019). Thus, this method is suitable for exploring the influence of innovation institution on spatial transfer of energy industry. Drawing on the studies of Hanson (1998) and T. Gao (2004), we construct the following econometric model:

where i is a city; j and t refer to industry and year, respectively; νi represents a regional fixed effect that does not change with time; μ j means industrial fixed effect that does not change with time; ε ijt is random error. The data period is from 2000 to 2016 in the study.
Dependent Variables
In our study, we choose four dependent variables to measure spatial transfer of energy industry. The first is the output growth rate of energy industry (GR) and it can be measured by the following equation:

where Y is total output value of energy industry; i is a city; j and t refer to industry and year, respectively. This variable reflects the overall growth of energy industry at city and provincial levels, respectively. The second is the output growth rate of domestic energy industry (GRD), measured by Equation 3 where Y is output value of domestic energy industry, which examines growth of enterprises meeting domestic market demand and its spatial change. The remaining two are the output growth rate of energy industry measured by export delivery value (GRE) and the output growth rate of foreign investment in energy industry (GRF), which are still measured through Equation 3 where Y is export delivery value and output value of foreign investment, respectively. The former reflects the development and spatial changes of energy enterprises in export-oriented enterprises, and the latter helps us understand the impact of the system on the spatial transfer of foreign-invested energy industries. The above four independent variables are consistent with our classification of energy industry in the study.
Explanatory Variables
In the study, independent variables include core explanatory variables (innovation institution) and control variables. In terms of innovation institution, we select three variables, including IPRs protection (IPP), the number of authorized energy patents to that of patent application (PATENT) and the proportion of R&D expenditure to GDP (R&D). Regarding control variables, they are specialization level of the energy industry (LP), the diversity level of energy industry (LPD), the pollution intensity of energy industry (IPD), and the proportion of capital to the number of labor on energy industry (CLP).
The first core explanatory variable is the strength of IPRs protection (IPP). Ginarte and Park (1997) use five separate subindicators to quantify the intensity of IPRs protection, including membership in international treaties, enforcement mechanisms, protection of the loss of rights, duration of protection, and protection coverage of patentable inventions. The measurement of G-P is very popular in existing studies and has been employed over 1,003 times (Cassandra & Dalibor, 2015). However, Han and Li (2005) argue this method cannot be applied to China’s IPRs protection measurement because judiciary and legislation in China are not fully synchronized. To verify this conclusion, they calculate the intensity of China’s IPRs protection in 1993, and find that China’s IPRs protection intensity exceeds that of some developed countries. Thus, Han and Li (2005) introduce law enforcement efforts to update G-P method.

where PA(t) refers to China’s IPRs intensity in t year; PG(t) is the intensity of IPRs protection calculated by G-P method; F(t) represents law enforcement efforts. Regarding how to measure law enforcement efforts, Han and Li (2005) choose four indicators, including lawyer ratio, legislative time, capita GDP, and supervision and balance of international society. The value of every indicator is from 0 to 1 and the final value of law enforcement efforts is the mean of the four indicators. There is no consistent conclusion of existing studies on the impact of IPRs protection on industrial location choice. Sunil (2012) indicates that stronger IPRs protection does not play an important role in investment choice of multinationals and that the impact of IPRs protection depends on component indices of measure method and industry types. Therefore, we cannot expect the impact direction of IPRs protection.
The second and third core explanatory variables are the proportion of the number of authorized energy patents to that of patent application (PATENT) and the proportion of R&D expenditure to GDP (R&D), which reflect the overall process of innovation output and innovation input. Meanwhile, we expect to test the impact of innovation led by patent motivation and R&D on industry development. Frank et al. (2016) discuss the effect of innovation activities on industry from the perspectives of market-orientation and technology-acquisition, which underline patent value and R&D investment of technological progress, respectively. Their results show that market orientation is positive to product launch activities and that technology acquisition is negatively related to innovation output in the field of industrial machinery and equipment acquisition. Weinhold and Nair-Reichert (2009) argue that the number of authorized patents is a measure of innovation output which can cover many countries and regions over time period. Similarly, many researchers also have viewed patent count measurement as a proxy of innovation, including Mancusi (2004). On the contrary, studies have indicated that R&D is used as an input measure of innovation (Chen & Puttitanun, 2005). Therefore, PATENT and R&D are suitable to examine innovation capability.
Regarding the patent counts and industry development, Park (2014) argues that patents can contribute to technological progress and industrial growth. Moreover, patent system plays a significantly positive role in economic growth (Park, 2014). In addition, research in different technology fields has also revealed this positive impact of patent counts on industrial growth. For example, Johnstone et al. (2012) choose patent counts to explore the effects of public environmental policy on environment-related technology innovation, and their results support the positive role of patents on environment-related industry. Noailly and Batrakova (2010) examine whether patent counts can promote energy-efficient innovation in building sector, and they conclude that due to lacking continuity and stability of energy policy, there exists a negative relationship between patent counts and energy industry. Similarly, the study in climate change field also support the positive impact of patent counts on growth (Su & Moaniba, 2017). In the study, based on the existing studies, we expect that increasing patent counts is accompanied by technological progress in the energy industry, thus promoting industrial growth. Consequently, a positive impact of patent counts on industrial transfer is expected in this article.
In terms of R&D, the relationship between R&D, innovation, and growth has been empirically discussed by a large stream of literature, such as Hall (2011) and Mairesse and Mohnen (2010). The studies at firm and industry levels also support the positive relation between R&D and industrial development. Baumann and Kritikos (2016) conclude that R&D is positively related to the probability of reporting innovation and economic growth. Although low access to liquidity has a negative influence on firms’ innovation activities and decreases the innovation success for R&D intensive firms, Howell (2016) still highlights the significant importance of R&D investment to industrial growth. Similar conclusion has also been held by Frank et al. (2016). In our study, the increase of regional R&D investment can attract more industries and promote the spatial transfer of industries. Meanwhile, competition for R&D investment among regions will also accelerate the transfer speed of energy industry. Thus, we expect a positive effect of R&D.
Control Variables
In addition, the study also selects four control variables, including the specialization level of the energy industry (LP), diversity level of energy industry (LPD), pollution intensity of energy industry (IPD), and the proportion of capital to the number of labor on energy industry (CLP).
Following W. Li and He (2017), the study measures the LP as follows.

where Y represents total output value of energy industry; i is a city; j and t refer to industry and year, respectively. Marshall (1920) concludes that high specialization is conducive to the emergence of Marshall externality, which is in favor of industry growth. The recent empirical studies have also discussed the interactive relationship between specialization level and scale economies, and support the positive effect of specialization level on growth (Fung et al., 2012; Xie et al., 2012). Thus, we expect a positive impact of LP.
The second control variable is the LPD, and its measurement follows (W. Li & He, 2017).

where Y is total output value of energy industry in i city; j and t are industry and year, respectively. Smaller LPD means higher diversity. Negative coefficient of LPD in regression shows that diversification can promote the growth of regional industries (W. Li & He, 2017), and a negative effect is expected in our study. The existing empirical studies do not sure whether diversification is beneficial to economic or industrial growth (Beaudry & Schiffauerova, 2009). Thus, the effect of LPD on energy industrial growth depends.
The third control variable is the IPD, referring to the total pollution emission divided by energy industrial output at 1998 constant price (He et al., 2014). China is experiencing rapid urbanization and industrialization, and thus industrial activities are the dominant polluters (He et al., 2014). Pollution intensity includes industrial SO2 emission intensity, industrial waste water intensity, and industrial soot emission intensity. In the study, we calculate the mean of above three intensities to measure the IPD. In the short term, industrial growth at the expense of the environment may occur, but the growth is not sustainable in the long term because of increasing costs and technological progress (Y. Li et al., 2016). Thus, in terms of pollution intensity, a negative effect is expected.
The last control variable is the CLP, which is from the study of W. Li and He (2017). CLP can be calculated through the following:

where A and L are total assets and quantity of labor, respectively; i is a city; j and t refer to industry and year, respectively. W. Li and He (2017) argue that if the development of a region’s industry is mainly driven by labor, CLP is negative, and that if the development of a region’s industry is mainly driven by capital, it is positive. Moreover, The CLP change from negative to positive indicates that the industrial development in a region has changed from labor drive to capital drive, that is, industrial upgrading. A positive association between CLP and industrial growth has been supported by the existing studies (e.g., Azadegan & Wagner, 2011; Brandt & Thun, 2016; Zhou, 2018). Table 1 presents all variables and their summary of our study.
Summary of Variables.

Note. IPRs = intellectual property rights.
Data on IPRs protection is from Statistical Yearbooks of 13 cities in Jiangsu (2000–2017), Statistical Yearbooks of Jiangsu (2000–2017), and Law Yearbooks of China (2000–2017). Data on other variables is from Statistical Yearbooks of 13 cities in Jiangsu (2000–2017) and Statistical Yearbooks of Jiangsu (2000–2017). In addition, to make these economic data comparative, we choose consumer price index (CPI) to adjust data on the basis of the same year of 1998, because in 1998, China National Statistical Bureau changed the industrial statistics and they only include the industrial enterprises with sales revenues over 5 million Yuan for the data on smaller enterprises are not reliable (He et al., 2014).
Results and Analysis
Tables 2 to 6 report the estimation results of the relationships between innovation institution and spatial transfer of energy industry at the levels of overall Jiangsu province and its regions. To test whether there exists multicollinearity in all models, we first calculate the Pearson’s correlation coefficients between all explanatory variables. Due to small deviation in both linear and nonlinear scenarios, sensitivity to correlation degree change, and good robustness under incremental linear change (Priyantha, 2016; Wang et al., 2013), we choose Pearson’s correlation coefficient. The results of correlation analysis show that independent variables are weakly correlated because the largest Pearson’s correlation coefficient in all models is 0.561 (not reported). Thus, the multicollinearity problem is not a challenge in our models. In addition, the Wald tests in all models indicate that all specifications are highly significant. Meanwhile, the study conducts heteroscedasticity test by Breusch-Pagan. As expected, all tests results indicate that innovation institution can explain the spatial transfer of energy industry in Jiangsu province, China.
Estimation Results at Jiangsu Province Level.
p < .10. ** p < .05. *** p < .01.
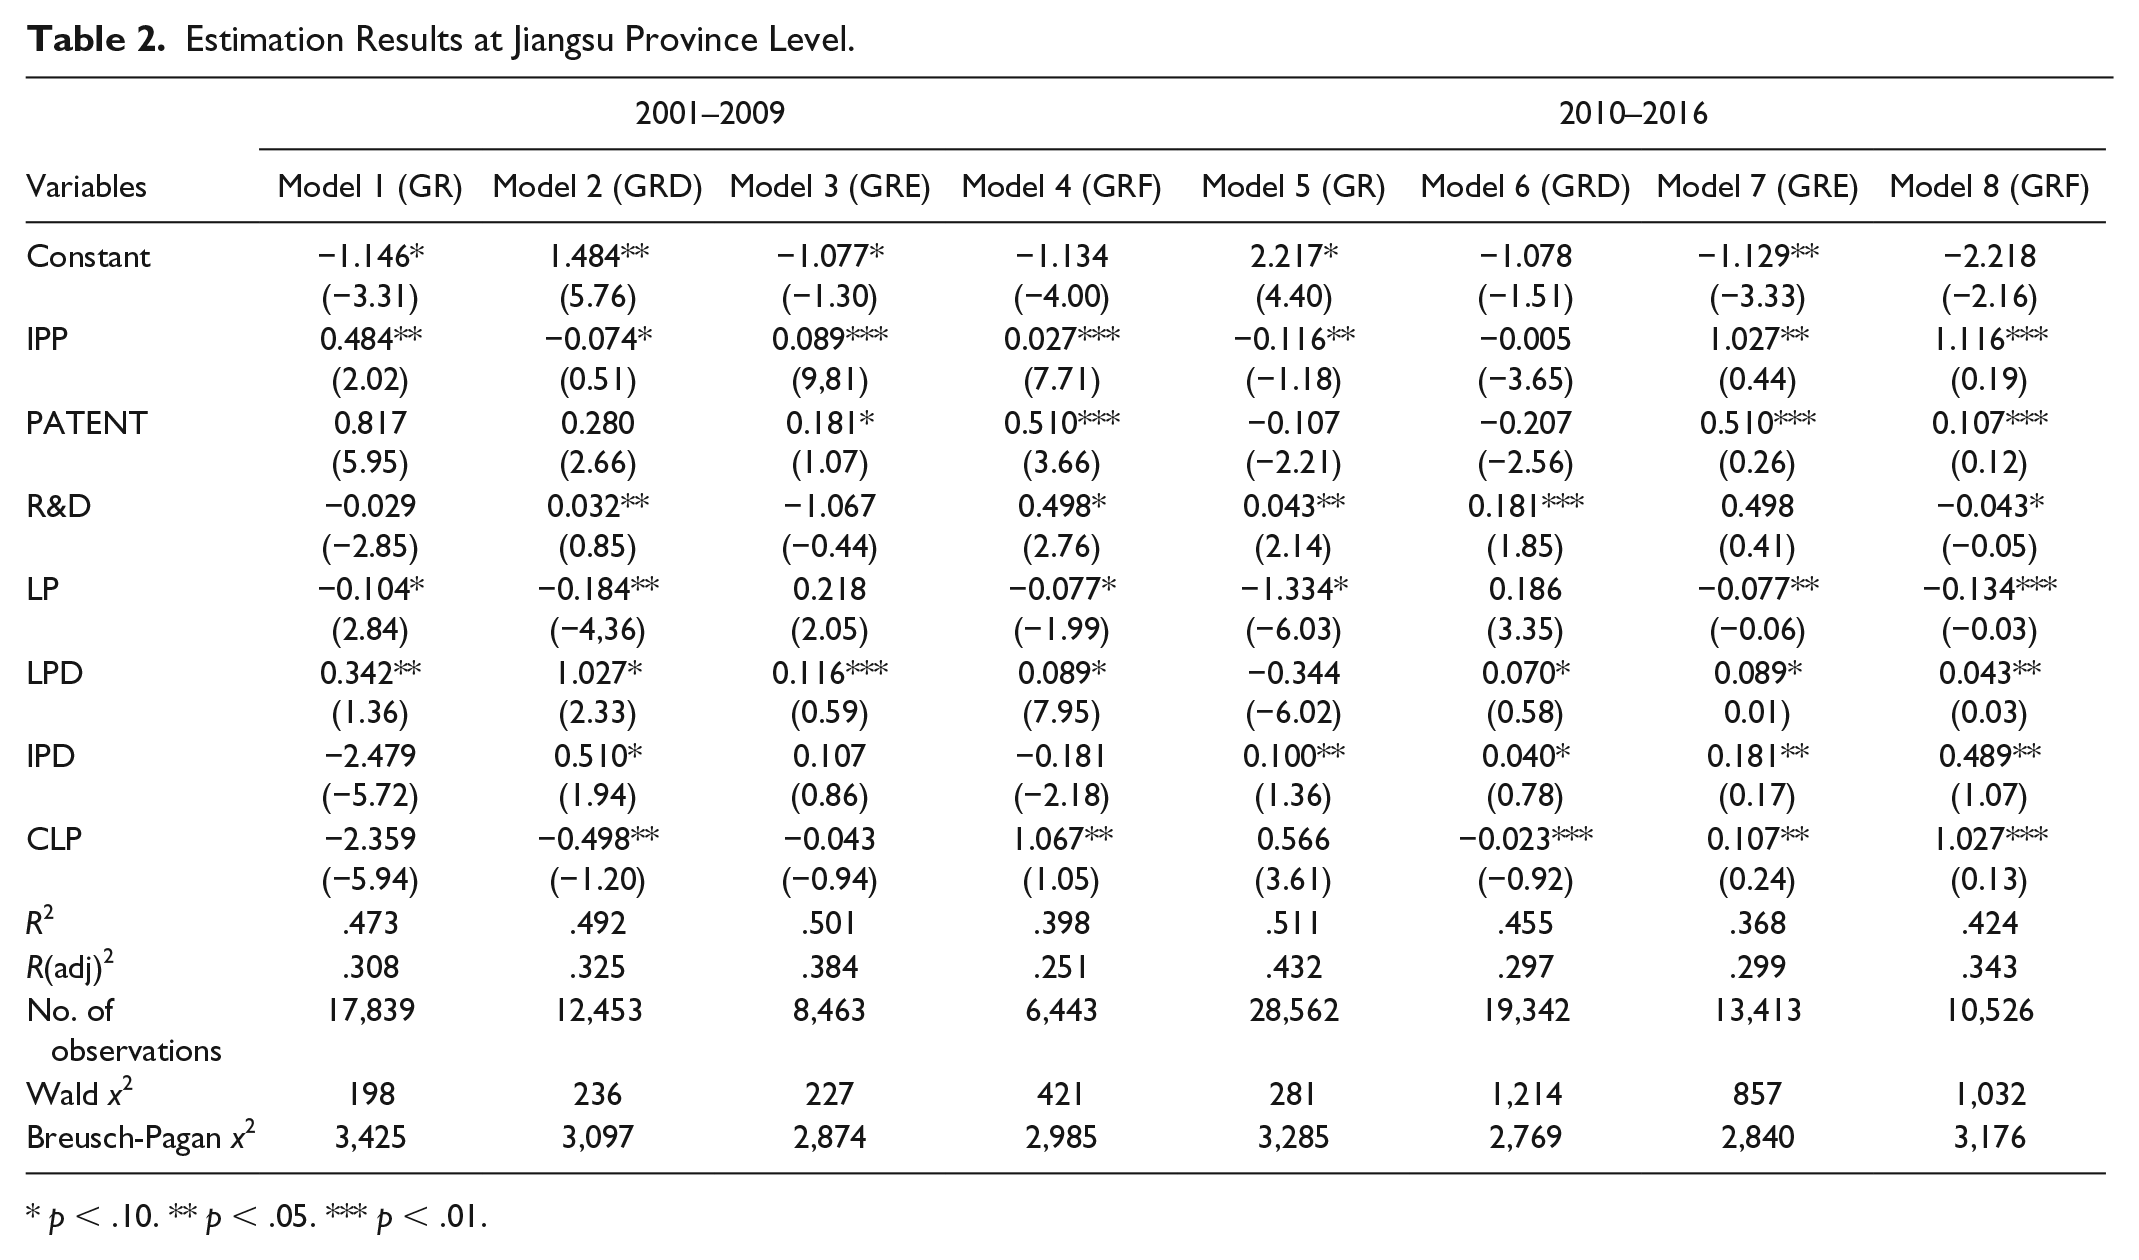
Table 2 presents the estimation results at overall Jiangsu level. Regarding IPRs protection strength (IPP), according to Model 1 and Model 5, IPRs protection has a positive effect on energy industry growth of Jiangsu before 2010 (0.484), whereas the relationships between them change to be negative after 2010 (−0.116), indicating that the growth speed of energy industry begins to slow in cities with stronger IPRs protection after 2010, while the energy industry growth in cities with weaker IPRs protection is relatively faster. That is, stronger IPRs protection in developed cities promotes energy enterprises to migrate to cities with weaker IPRs protection. Due to different economic development level, IPRs protection has different impact on economic growth in different regions. In particular, patent protection can promote economic growth in developed regions, but not in developing regions (Kim et al., 2012). In addition, relying on Model 2 and Model 6, IPRs protection negatively relates to domestic energy industry market (−0.074 and −0.005), and the relation is not significant after 2010, indicating that domestic energy industry market is insensitive to IPRs protection. That is, change of IPRs protection cannot contribute to the spatial transfer of energy industry to meet domestic demand. Comparing Model 3 and Model 7, we find that IPRs protection has a positive effect on export energy industry and that the positive effect increases with time because the values of positive effect increase from 0.089 before 2010 to 1.027 after 2010. Energy industry belongs to the technology-intensive industry, and thus when choosing location, multinational corporations have to take IPRs protection into account (Chuang & Lin, 2011). Therefore, as for energy industry, multinational companies tend to choose regions with stronger IPRs to protect their technologies. The conclusion continues to hold in Model 4 and Model 8 on foreign investment energy industry in Jiangsu, where the positive effect of IPP increases by 1,089. In addition, Model 3 and Model 7 show that export-oriented energy enterprises are also sensitive to IPRs protection because their products have to meet international IPRs protection standards. Consequently, export-oriented and foreign energy enterprises tend to shift to cities with stronger IPRs protection.
In terms of PATENT, Model 1 and Model 5, as well as Model 2 and Model 6, in Table 2 show that the relations between innovation output and energy enterprises meeting domestic demand energy industry in Jiangsu are not significant because these coefficients cannot pass the significant test. Due to large regional differences within Jiangsu, energy industry has both capital driven and technology driven, and even policy supporting energy industries. Thus, single factor does not explain the spatial transfer of energy enterprises. Model 3 and Model 7, as well as Model 4 and Model 8, indicate that increasing innovation output can contribute the growth of export-oriented and foreign-invested energy enterprises, meaning that these enterprises tend to gather in cities with high patent output. Regarding R&D, before 2010, it is negatively related to energy industry growth, though the coefficient is not significant, whereas the relation between them is significantly positive after 2010, indicating that energy industry has begun to shift to cities with high R&D investment in Jiangsu. Energy enterprises to meet domestic demand are sensitive to local R&D investment, and over time, cities with higher R&D investment will facilitate the agglomeration of these enterprises. On the contrary, the relationships between local R&D investment and export-oriented and foreign-invested energy enterprises are not significant; even foreign-invested energy enterprises are more inclined to choose cities with lower local R&D investment. The reason may be that transnational corporations tend to choose regions with strong innovation capability (Veliyath & Sambharya, 2011), while R&D investment cannot represent innovation because it is just innovation input (Weinhold & Nair-Reichert, 2009).
Regarding control variables in Table 2, Model 1 and Model 5 show that there is no significant relationship between CLP and overall energy industry growth (GR). According to Model 2 and Model 6, CLP has a significantly negative effect on energy enterprises meeting domestic demand (−0.498 and −0.023), indicating that from 2000 to 2016, these enterprises are labor driven, and that over time, these enterprises have not realized the shift from labor driven to capital driven. On the contrary, export-oriented energy enterprises have realized the change from labor driven (−0.043, not significant) to capital driven (0.107, significant). This may be because the technical complexity of China’s export products is increasing (Upward et al., 2013). The coefficients of CLP in Model 4 (1.067) and Model 8 (1.027) show that foreign investment energy enterprises have always been capital driven. According to Model 1 to Model 8, the negative impacts of LP are significant, indicating that increasing specialization has slowed down the growth of the entire energy industry. The positive results of LPD from Models 1 to 8 do not indicate that diversity can contribute to growth of energy industry in Jiangsu, because there is no significant relations between industrial diversification and productivity growth due to the strategic locations of the subsidiaries (Michele & Julien, 2014). That is, geographic diversification can make firms to take advantage of the technological and knowledge resources in the centers of scientific excellence located worldwide, whereas industrial diversification cannot reach the point. According to the results of IPD from Models 1 to 8 in Table 2, the effect of pollution intensity changes from negative correlation before 2010 to significantly positive correlation after 2010, indicating that pollution can promote the growth of energy industry, and that, to some degree, energy enterprises gather in cities with weaker environmental pollution regulations. To promote their rapid career promotion, local government officials will be inclined to attract highly polluting enterprises because these enterprises can promote the rapid growth of GDP in the short term (He et al., 2014).
After 2010, according to the empirical estimation results in Table 2 and spatial pattern analysis at Jiangsu province level, energy industry has shifted to middle and northern Jiangsu due to IPRs protection and local R&D investment. Table 3 reports the estimation results of southern Jiangsu. The coefficient change of intellectual property protection from positive in Model 1 (0.026) to negative in Model 5 (−0.094) shows that increasing IPRs protection boosts energy industry in southern Jiangsu before 2010, whereas stronger IPRs protection has a negative impact on energy industry growth in southern Jiangsu after 2010, indicating that excessive IPRs protection in South of Jiangsu has begun to shift energy enterprises to other cities. This conclusion is also verified by the estimation results of energy enterprises to meet domestic demand. However, for foreign investment energy enterprises, the significant values of 0.638 in Model 4 and 0.363 in Model 8 reveal that stronger IPRs protection can still promote their growth. In Table 3, Models 1 to 8 indicate that expect energy enterprises to meet domestic demand (GRD), patent output can promote the growth of energy industry in southern Jiangsu, in particular, export-oriented energy enterprises and foreign energy enterprises where the maximum coefficient is 0.678 at 95% significant level. Regarding local R&D investment, before 2010, increasing R&D investment promotes energy industry growth in southern Jiangsu, especially energy enterprises to meet domestic demand, while the role of local R&D investment is not significant after 2010, indicating that local R&D investment is no longer an important factor in attracting energy industry for southern Jiangsu. Nevertheless, the negative effect of R&D investment is not significant at southern Jiangsu level. Therefore, the role of R&D investment in energy industry should not be neglected.
Estimation Results of Southern Jiangsu.

p < .10. ** p < .05. *** p < .01.
In terms of control variables in Table 3, the results of CLP show that the energy industry in Southern Jiangsu has changed from labor driven to capital driven because it has a significantly positive effect with maximum is 1.213 in Model 4. The results of IPD indicate that increasing pollution inhibits the growth of kinds of energy industry, meaning that to save environmental costs, these enterprises have to transfer to other cities where environmental regulation is not very strict. In Table 3, relying on the results of LP and LPD, specialization and diversification have no significant impact on the energy industry in Southern Jiangsu.
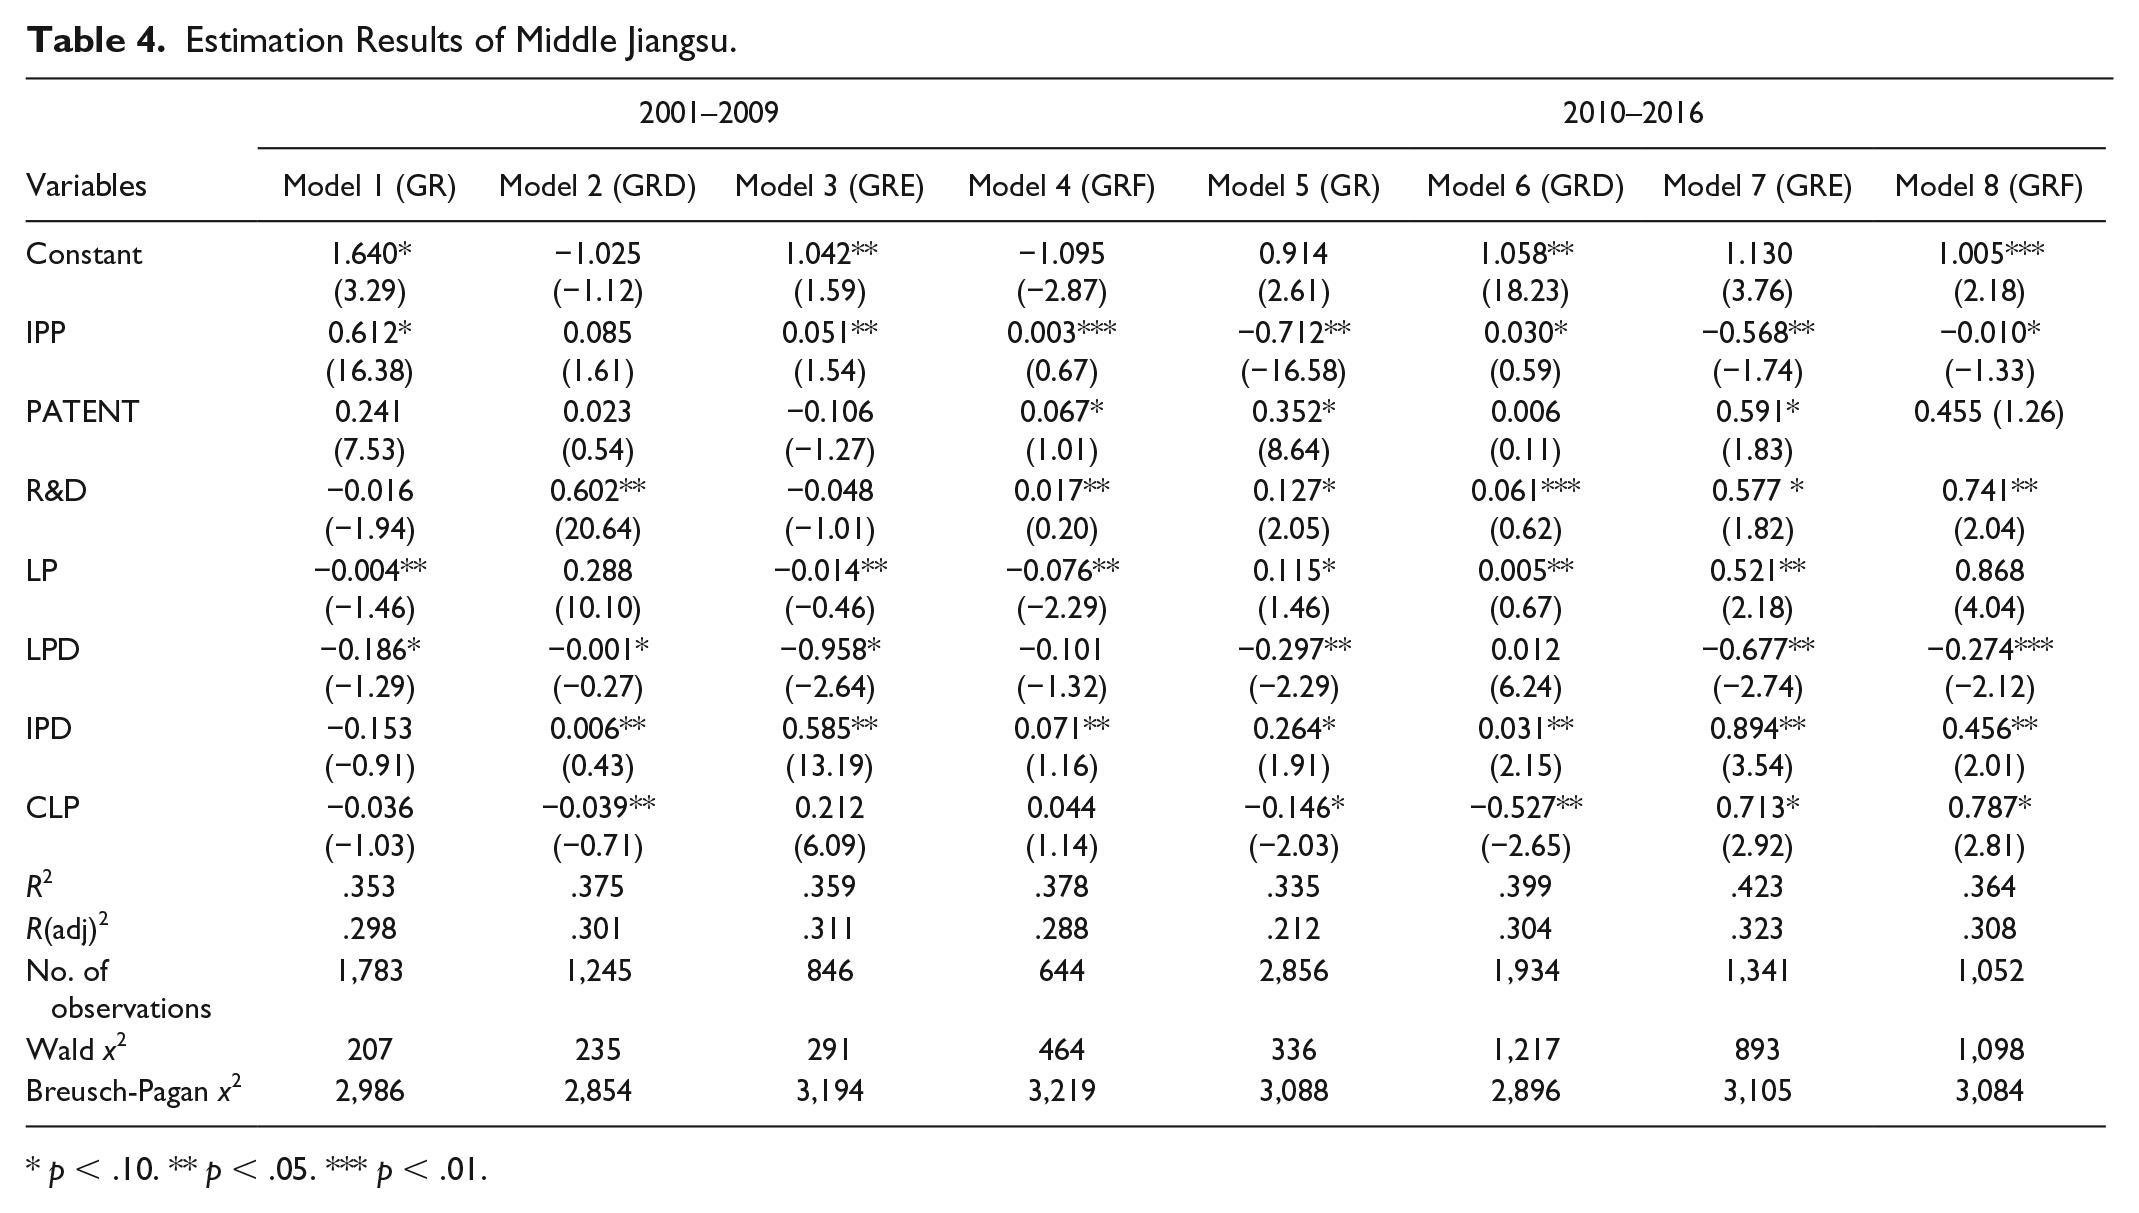
The results of the Jiangsu provincial level show that energy enterprises are moving toward north. The results of southern Jiangsu level and map analysis indicate that energy enterprises present the trend of leaving cities in southern Jiangsu. Thus, middle Jiangsu and northern Jiangsu are more likely to attract more energy enterprises. Tables 4 and 5 report the results at middle and northern Jiangsu level. In middle Jiangsu and northern Jiangsu, patent output has no significant effects on energy enterprises growth because most coefficients of PATENT cannot pass the significant tests. The results of IPP in Table 4 demonstrate that increasing IPRs protection has a significantly positive impact on all kinds of energy enterprises in middle Jiangsu before 2010, while after 2010, the negative impact began to highlight. Even, regarding northern Jiangsu in Table 5, stronger IPRs protection is negatively related to the growth of all kinds of energy enterprises, and these negative effects are significant. These results indicate that cities in northern Jiangsu are attracting energy industry by lower intensity of IPRs protection. In addition, the significantly positive coefficients of R&D in Tables 4 and 5 reveal that over time, increasing local R&D investment can enhance the cities’ attraction of middle and northern Jiangsu to energy enterprises, especially after 2010, the positive effects become more significant.
Estimation Results of Middle Jiangsu.
p < .10. ** p < .05. *** p < .01.
Estimation Results of Northern Jiangsu.

p < .10. ** p < .05. *** p < .01.
Regarding control variables, the results of CLP in Models 3 and 6, as well as Models 4 and 8 of Table 4 show that in middle Jiangsu, export-oriented energy enterprises and foreign-funded enterprises have changed from labor intensive to capital intensive, that is, industrial upgrading. However, overall, the energy industry in the whole middle Jiangsu fails to achieve industrial upgrading, according to Models 1 and 5, as well as Models 2 and 6, in Table 4 because after 2010, the coefficients of CLP are still significantly negative (−0.146 and −0.527) . Similarly, the results of CLP in Table 5 indicate that all kinds of energy enterprises in northern Jiangsu fail to achieve industrial upgrading. In terms of the results of LP in Tables 4 and 5, compared to negative coefficients before 2010, significantly positive correlation after 2010 demonstrates that increasing specialization can promote energy industry growth in middle and northern Jiangsu. In addition, negative correlation of LPD in Tables 4 and 5 shows that industrial diversification cannot promote the growth of the energy industry in middle and northern Jiangsu. Compared with the results of LP and LPD at southern Jiangsu in Table 3, middle and northern Jiangsu are attracting energy enterprises through low industrial diversification and high specialization. Finally, increasing environmental pollution is stimulating the energy industry’s prosperity in middle and northern Jiangsu, according to the results of IPD in Tables 4 and 5, indicating that these cities, to some extent, attract energy enterprises at the expense of the environment.
Table 6 reports the estimation results of coastal cities in Jiangsu. The results of IPP indicate that IPRs protection in coastal cities of Jiangsu plays a positive role in the growth of energy industry, indicating that stronger IPRs protection in coastal cities can attract more industry enterprises. In addition, most of other variables are not significant, indicating that the spatial pattern of energy industry in coastal cities is basically unchanged.
Estimation Results of Coastal Cities in Jiangsu.

p < .10. ** p < .05. *** p < .01.
In addition, in above analysis, we are based on an assumption that Jiangsu Province is a closed economy. However, we cannot guarantee that energy enterprises only flow within Jiangsu because some enterprises enter Jiangsu from other provinces or Jiangsu’s energy enterprises shift to other provinces. In light of this, we checked the database from Jiangsu Bureau of Industry and Commerce, and manually minus the output value of those energy enterprises outside Jiangsu, according to the statistics of statistical yearbooks. Therefore, our samples include only energy companies registered in Jiangsu to explore the spatial transfer of energy industry in Jiangsu. Moreover, as a caveat, it has to be noted that above all estimation may exhibit substantial bias due to small samples (Wooldridge, 2002). There are 13 cities in Jiangsu province, and we have only 13 samples. For this reason, above analysis and findings should be treated with some caution and are not applicable to other regions or industries. Nevertheless, our analytical approach is valid in other industries and in a wider geographical area.
Conclusion and Policy Implications
The aim of this article is to explore the role of innovation institution in spatial transfer of energy industry in Jiangsu. We present spatial change of energy industry at regional level and map them at urban level. Based on official data, we employ fixed-effect panel model at city-industry level, and in the study, we select three variables as the proxy of innovation institution, including IPRs protection intensity, the percentage of local R&D investment, and the percentage of authorization patent. In addition, the study also selects a series of control variables to test industrial upgrading, the impact of specialization and diversification, as well as the impact of pollution. Overall, our results indicate a clear impact of innovation institution on spatial transfer of energy industry in Jiangsu, and innovation institution is driving the energy industry to northern and middle Jiangsu. Specifically, this study draws the following conclusions:
The year 2010 is an important turning point in the evolution of spatial pattern of energy industry in Jiangsu province. Before 2010, the agglomeration of Jiangsu’s energy industry continues to improve, and the energy industry continues to concentrate on the southern Jiangsu. However, after 2010, the energy industry began to migrate to middle and northern Jiangsu. Energy enterprises to meet domestic demand and foreign investment energy enterprises are the main forces to move north of Jiangsu. Although export-oriented energy enterprises are gathering in southern Jiangsu, this agglomeration is in a downward trend, whereas export-oriented energy enterprises in middle and northern Jiangsu reflect an increasing agglomeration after 2010.
Innovation institution has played an important role in the spatial transfer of energy industry in Jiangsu. Before 2010, stronger IPRs protection in southern Jiangsu promotes the growth of energy industry, especially export-oriented and foreign investment energy enterprises where the significant coefficients are 0.241 and 0.678, respectively. However, after 2010, though export-oriented and foreign investment energy enterprises still benefit from stronger IPRs protection, increasing IPRs protection hinders the prosperity of the overall energy industry of southern Jiangsu, that is, with the increase of 1 unit in IPRs protection, the overall output of energy industry will decrease to 0.094 significantly. From beginning to end, stronger IPRs protection is not conducive to the growth of energy industry in middle and northern Jiangsu, especially in northern Jiangsu where the most serious negative impact reaches −0.128. Thus, weaker IPRs protection has led to the agglomeration of energy industry in middle and northern Jiangsu. Patent output makes southern Jiangsu’s energy industry continue to flourish, in particular in foreign investment energy enterprises where the maximum positive impact arrive at 0.51, but it has no significant effect on middle and northern Jiangsu because it cannot pass the significant test in the regression of regional level. Local R&D investment input has promoted the transfer of all kinds of energy enterprises to northern Jiangsu and middle Jiangsu, especially export-oriented energy enterprises in northern Jiangsu (0.317). In terms of coastal cities in Jiangsu, only IPRs protection has a significantly positive impact on energy industry, while other variables are not significant, meaning that the spatial change of energy industry in coastal cities is very small because all coastal cities in Jiangsu are located in northern and middle Jiangsu, and their IPRs protection is relatively weak.
Southern Jiangsu, northern Jiangsu and middle Jiangsu have large industrial gap, and Jiangsu has not yet realized the coordinated development of energy industry. Although the energy industry has begun to shift to the middle and northern Jiangsu, all types of energy industries in northern Jiangsu have failed to achieve industrial upgrading because there are two significant values of negative effect on CLP (−0.6 and −0.236). Even in the middle Jiangsu region, overall energy industry has not yet achieved industrial upgrading, though export-oriented energy enterprises and foreign energy enterprises have made it. In addition, southern Jiangsu has begun to pay attention to the environmental problems led by the development of the energy industry, whereas northern and middle Jiangsu are attracting energy enterprises at the expense of the environment. For example, in northern Jiangsu, the maximum value of IPD is 0.964, meaning that the output value of the energy industry increases by 0.964 for per unit of pollution intensity. It may be due to the fact that environmental pollution-based energy industry can greatly enhance a city’s GDP in the short term thereby promoting the image of local government officials (X. Zhu et al., 2018). Besides, middle and northern Jiangsu are attracting energy enterprises through low industrial diversification and high specialization.
The results in our study have potentially important policy implications that can be used by industrial and urban planner. Our conclusions have revealed an important point of unbalanced regional development within Jiangsu province. The “13th Five-Year Plan” energy industry plan of Jiangsu Province should focus on the Middle Jiangsu and North Jiangsu to narrow the regional development gap. Especially in industrial upgrading and environmental governance, northern Jiangsu and middle Jiangsu need more policy preferences and support. In addition, strong IPRs protection does not mean technological progress and growth of energy industry in Jiangsu. There are obvious differences in regional development within Jiangsu Province. Moreover, in developed regions, strong intellectual property protection plays a positive role in promoting growth, while in developing or backward regions, the role of strong intellectual property protection is not obvious, or even negative. Thus, policymakers should formulate reasonable IPRs protection system according to local industrial development level rather than blindly strengthen it. However, the positive effect of R&D investment on industrial development is significant, and thus, Provincial and city budgets should focus on this aspect. The location advantage of Jiangsu coastal cities has not been played and attached importance. If Jiangsu can actively use this advantage, the industrial development and innovation ability would be promoted. Overall, Our empirical study indicates that innovation institution makes a difference to energy industry in Jiangsu from the perspectives of data and space. Future studies should investigate industrial spatial transfer on wider spatial scales and also understand the spatial dependence of industrial development to innovation institution, because spatial dependence may change the impact of innovation, especially patent counts, which is influenced by geographical path of patent citation.
Footnotes
Declaration of Conflicting Interests
The author(s) declared no potential conflicts of interest with respect to the research, authorship, and/or publication of this article.
Funding
The author(s) disclosed receipt of the following financial support for the research, authorship, and/or publication of this article: This research is partly funded by the National Natural Science Foundation of China (Project No. 51808392) and the school funding from the University of Westminster.