
Abstract
This article presents a two-phase study exploring the usage of technology in higher education as well as the role of the general innovativeness in predicting the actual use of technology. During the first phase of the study, which involved 502 staff members, a descriptive analysis of their usage of social media, technological devices, and Microsoft Office 365 cloud services was performed, with various demographic variables being considered. During the second phase, which involved a subsample of 106 staff members, structural equation modeling (SEM) was used to examine a model in which the general innovativeness and the demographic variables acted as predictors of the actualized innovativeness. The results showed that the staff used social media, devices, and cloud services quite satisfactorily. The examination of their user profiles revealed that there were significant differences among the staff members on the basis of their demographic variables, especially their gender, job type, and discipline. The results of the SEM showed that the general innovativeness contributed positively, as was expected, to predicting the adoption of devices, non-academic social networking sites and Office 365 cloud services. The results further suggested that males were early adopters of devices, while academics were early adopters of commercial services and academic social networking sites. However, the academics appeared to lag behind the administrators in terms of adopting Office 365 cloud services. The implications of the study and directions for future research are also presented.
Keywords
Introduction
Many studies have sought to illustrate how new technologies could assist with the educational process (Brown, 2012; Dermentzi et al., 2016; Hung & Yuen, 2010; Lim et al., 2015). For instance, technologies have been promoted as supporting students’ learning (Dyson et al., 2015), assisting with teaching (S. Manca & Ranieri, 2017b), facilitating research collaboration among researchers from different parts of the world (Al-Daihani et al., 2018; Gu & Widén-Wulff, 2011), and enhancing staff’s professional development and growth (Donelan, 2016). Due to the numerous possibilities afforded by technologies, universities and colleges have sought to purchase and provide both their staff and their students with new technologies. However, simply putting those technologies into service does not imply that staff and/or students are actually going to use them. According to a recent EDUCAUSE report (Alexander et al., 2019)—which was build upon the 98-expert global panel to forecast technology trends at higher education institutions (HEIs)—addressed the issue of involving staff in implementing educational technologies as one of the upcoming challenges in higher education. Indeed, in recent years, researchers have increasingly suggested that technologies have been oversold but underused (S. Manca & Ranieri, 2016b). It is no longer debatable whether technologies can assist with the educational process, since it has been proved that they can. Rather, the question has become, “who is using the offered technologies?” For instance, Veletsianos and Kimmons (2013) suggested the need to investigate the profiles of technology users so as to determine the relationship between the usage of technology and staff members’ educational level, age, discipline, gender, and other personal characteristics.
Aside from the actual use of technology, researchers in the domains of marketing and business have advanced the research by proposing a different and arguably deeper concept of innovation adoption: general innovativeness (Goldsmith & Foxall, 2003). General innovativeness here refers to an individual’s tendency to accept changes and to try new things. Two major contributions can be attributed to this line of research. First, it removes the constraints of a given innovation. An innovation can be any new object or experience, including recent technologies such as social media, artificial intelligent tools, the Internet of Things, robots, and digital badging, or it could be a change in career path or an alteration in the structures of the work environment, such as a university merger (Aldahdouh et al., 2017). The second major contribution concerns the predictive characteristic of the concept of general innovativeness, which allows us to anticipate the possibility of adopting innovations prior to offering such expensive innovations. Tracking the actual use has often been criticized as being a form of post hoc analysis, since it can only be measured after an event has occurred. The concept of general innovativeness serves to overcome this evident drawback (Goldsmith & Foxall, 2003; Hurt et al., 1977).
Although it certainly sounds valuable, the use of the concept of general innovativeness in research has not yet become established. More specifically, the literature concerning general innovativeness is inconsistent with regard to its potential to predict innovation adoption behavior. Some studies have confirmed its predictive power (Arts et al., 2011; Bartels & Reinders, 2011; Jin, 2013; van Rijnsoever & Donders, 2009), others have rejected (Roehrich, 2004), or contested that innovativeness at the abstract and general level is a poor predictor of innovation adoption behavior (Goldsmith et al., 1995; Im et al., 2003). For example, in a study by Im et al. (2003), less than 5% of the variance in new-product adoption behavior is explained by the general innovativeness. Another example is a systematic review of the literature by Bartels and Reinders (2011), which tracked 79 relevant empirical articles, stated that the relationship between general innovativeness and innovative behavior is ambiguous. Although 10 studies supported the existence of a positive relationship, four reported only partial support, and six indicated no support for such a relationship. In addition to this inconsistency, we—in the higher educational context—are unable to make a judgment regarding the potential benefits of the general innovativeness concept simply because most studies to date have been conducted in the marketing domain. There is little, if any, logical reason to suggest that the models proposed in the marketing domain to predict customers’ purchasing behavior would inform us about how staff working in higher education respond to the technologies offered by their institutions.
The current research has two key aims. The first phase of the study is devoted to exploring staff members’ usage of the social media, technological devices and cloud services offered by Tampere University, Finland. More specifically, the study reports what kinds of technologies the staff members use, how frequently they use them, and how the distribution of technology usage relates to the investigated demographic variables. The second phase of the study examines the general innovativeness and the demographic variables as predictors of the actual use of technology.
Technology Usage in Higher Education
It could prove difficult to delineate the borders of the technologies in use at contemporary universities. The wide spectrum of such technologies includes learning management systems, blogging tools, discussion forums, bookmarking sites, wikis, social networking sites (SNSs), devices, cloud computing services, augmented reality, virtual reality, and robot technology, to name but a few. In the present study, social media, technological devices, and cloud computing services were included as representative of these recently developed technologies.
Social Media
Broadly speaking, social media sites represent a recent innovation intended to foster communication and collaboration on a large scale. Since their invention, such sites have diffused so rapidly that the number of users is growing daily, and they have become an integral part of people’s personal and professional lives (Chugh & Ruhi, 2018). Social media can be defined as “a group of Internet-based applications that build on the ideological and technological foundations of Web 2.0, and that allow the creation and exchange of User Generated Content” (Kaplan & Haenlein, 2010, p. 61). The term “social media” refers to a set of tools that includes blogging services, discussion forums, bookmarking services, and wikis. Thus, the overarching concept of social media implicitly includes SNSs, which are defined by Chugh and Ruhi (2018, p. 606) as “an online service allowing users to construct a public or private profile to connect and interact with their social connections.” In the interests of both clarity and consistency, the term “social media” will hereafter be used to exclusively refer to SNSs.
Numerous studies have reported on the positive impacts of integrating social media sites into the technological resources of HEIs. Many such studies have targeted students (Al-Rahmi et al., 2015; Dumpit & Fernandez, 2017; Dyson et al., 2015; Hamid et al., 2015; Hung & Yuen, 2010; Uusiautti & Määttä, 2014; Valenzuela et al., 2009), while others have targeted staff members as employees (Al-Daihani et al., 2018; Arshad & Akram, 2018; Dermentzi et al., 2016; Donelan, 2016; Gruzd et al., 2012; Gu & Widén-Wulff, 2011; S. Manca & Ranieri, 2016a, 2016b; Moran et al., 2011; Nández & Borrego, 2013; Veletsianos, 2012; Veletsianos & Kimmons, 2013). There may be a certain degree of consensus among staff members as to the perceived benefits of using social media. These benefits include establishing new, maintaining existing, and widening connections (Donelan, 2016; S. Manca & Ranieri, 2017a). In addition, staff members have acknowledged the value of social media in terms of facilitating collaboration and communication (Rowlands et al., 2011), developing oneself (Donelan, 2016; S. Manca & Ranieri, 2017a), and increasing visibility through the dissemination of one’s work (S. Manca & Ranieri, 2017a). Surprisingly, some studies have shown that staff members believe social media to be less beneficial when it comes to teaching purposes than in relation to personal and professional purposes (S. Manca & Ranieri, 2016b).
Studies involving staff members have distinguished between academics and other staff (Moran et al., 2011). Working as an academic at a HEI implicitly involves being a researcher in addition to being an employee of an institution. Tracking technology adoption has resulted in the coining of the term “Research 2.0,” which is along the lines of Web 2.0 technologies (Koltay et al., 2015). Conducting research is no longer a solo activity performed with limited access to resources; it is now more likely to involve navigating across a complex and professional network. The benefits of utilizing social networking when carrying out research are quite clear. Consistent results across studies have revealed that social media sites provide a convenient environment for scholarly communication and research dissemination (Al-Daihani et al., 2018; Gu & Widén-Wulff, 2011; S. Manca & Ranieri, 2017a). For example, publishing research results on Twitter was found to be of significant value in terms of obtaining instant and rigorous informal peer review (Gruzd et al., 2011), having one’s research more quickly cited (Priem & Costello, 2010) and establishing a professional personae (Veletsianos, 2012). Mendeley, as a reference management system and academic social network (Gunn, 2013), has helped scholars to explore the metrics and impact of their research. LinkedIn offers the option to build a professional profile, and it has been frequently reported to be used during job searches. Both ResearchGate and Academia.edu were reported to make sharing teaching material with students easier (S. Manca & Ranieri, 2016a). A study by Gruzd et al. (2012) showed that scholars found social media sites to be useful for keeping themselves up to date in their field, promoting their work online, and maintaining their professional image. For junior researchers, in particular, social media sites may prove to be of great importance with regard to situating them within the scientific community (Gruzd et al., 2012).
Still, there are some barriers hindering the adoption of social media in HEIs. Staff members, for instance, have reported privacy concerns when using social media, such as the blurring of boundaries and endangering one’s career (Gruzd et al., 2012). Other reported concerns pertain to copyright issues such as plagiarism and the commercialization of content (Lupton, 2014). Moreover, staff members have cast doubt on the credibility and quality of the material posted on social media (S. Manca & Ranieri, 2017a). Other academics have perceived that social media usage might shift their attention from knowledge creation to knowledge production. For instance, the sample of academics included in the study by Menzies and Newson (2007) believed that being connected to social media on a 24/7 basis would limit their ability to think deeply about their work and, therefore, decrease their creativity. In addition, researchers who are convinced of the benefits of social media usage have complained that they lack sufficient time to do so (Rowlands et al., 2011).
Cloud Computing Services
A recent report focusing on technology adoption within HEIs highlighted cloud computing services as one of the most influential technologies, with the majority of institutions being found to have started to learn about the possibility of moving some of their on-premises services to the cloud (Reinitz, 2017). The National Institute of Standards and Technology (NIST) defines cloud computing as a recent paradigm for providing real-time and on-demand computing resources, such as networks, servers, storage, applications, and services (Mell & Grance, 2011). Many providers are competing to deliver cloud services, and the IT staff of HEIs have the responsibility for matching their institutions’ needs to the affordances of the available technologies.
Cloud computing technology can offer immense benefits to HEIs (Alharthi et al., 2015; Behrend et al., 2011; Klug & Bai, 2015; Pardeshi, 2014; Sultan, 2010). Economically, cloud computing is based on a pay-as-you-go cost structure and, therefore, represents a lower-cost option for acquiring and maintaining up-to-date and efficient services. Technically, the most important benefits are manifested in the scalability and flexible deployment of cloud computing. Pedagogically, cloud services have shown positive effects in terms of facilitating teaching and learning, since both teachers and students can access elegant applications and academic materials anytime and anywhere. Cloud services allow them to communicate in a vivid, flexible, easy-to-use and social-media-like environment. Scholarly, cloud services offer a bunch of tools designed to support joint research activities and to facilitate communication among researchers. Due to these advantages, researchers have devoted significant efforts to proposing models for how cloud computing could be adopted in the higher education field (Low et al., 2011; Okai et al., 2014; Sabi et al., 2016). Other studies have discussed the experiences of their universities in relation to adopting cloud services (Klug & Bai, 2015; Sultan, 2010).
However, some HEIs still have concerns about the security and confidentiality of data stored in the cloud (Okai et al., 2014). In addition, universities have exhibited concerns that cloud services could hijack their control over data, while fears have been reported that they might be locked in to using a specific cloud service provider (Alharthi et al., 2015). In the current study, we will not delve into the issue of the institution as a unit of adoption. Rather, the focus is on the individual as a unit of adoption. By that, we mean the individual factors that hinder or foster the adoption of technology. Among those factors are an individual’s tendency to accept the newness (Alharthi et al., 2015), social influence (Talukder, 2012), trustworthiness (Shakeabubakor et al., 2015), and perceived ease-of-use and usefulness of the cloud (Bhatiasevi & Naglis, 2016). For instance, Shakeabubakor et al. (2015) conducted in-depth interviews with 30 researchers and postgraduate students, and they found that 71% of the interviewees reported distrusting cloud services.
Innovativeness
Innovativeness has been intensively researched as a determinant of the adoption of innovations (Bartels & Reinders, 2011; Kaushik & Rahman, 2014). During the early 1970s, innovativeness was theorized and studied in the field of marketing and business in order to understand consumer behavior with regard to the adoption of new products. Later, the research on innovativeness was extended to include higher education (Aldahdouh et al., 2019; Gökçearslan et al., 2017) and other contexts such as management (Jong & Hartog, 2007) and the health sector (Park & Kim, 2010).
Throughout the process of developing the conceptualization of innovativeness, different approaches have been proposed: behavioral, general, and domain-specific innovativeness (for a review, see: Bartels & Reinders, 2011; Kaushik & Rahman, 2014). The behavioral approach defines innovativeness as “the degree to which an individual or other unit of adoption is relatively earlier in adopting new ideas than other members of a system” (Rogers, 2003, p. 242). In other words, the behavioral approach focuses on the real act of innovation adoption, which is why it has sometimes been referred to in the literature as actualized innovativeness (Midgley & Dowling, 1978) or innovative behavior (Jong & Hartog, 2007). The general approach conceives innovativeness as a psychological construct or individual characteristic that shapes an individual’s disposition toward newness regardless of the kind of innovation (Aldahdouh et al., 2018). General innovativeness has been referred to in the literature by several names, including life innovativeness (Roehrich, 2004), personality-trait innovativeness (Hurt et al., 1977), global trait innovativeness (Goldsmith & Foxall, 2003), and innate innovativeness (Midgley & Dowling, 1978). The third approach—domain-specific innovativeness—lies somewhere between the two aforementioned approaches. The notion that informs it is that individuals show varied tendencies and interests toward different kinds of innovations and, thus, the domain-specific innovativeness approach seeks to understand the individual’s tendency to adopt innovation within a specific domain (Roehrich, 2004, p. 672). For example, a staff member may be inclined to embrace innovations within the teaching and learning domain, but not within the technological domain.
The relations that exist among the three approaches have been discussed in several studies (Arts et al., 2011; Bartels & Reinders, 2011; Kaushik & Rahman, 2014; Marcati et al., 2008), the results of which consistently showed that general innovativeness positively correlates with domain-specific innovativeness, while domain-specific innovativeness in turn positively correlates with actualized innovativeness. In other words, domain-specific innovativeness mediates the relationship between general and actualized behavior.
Various studies have assessed the relationship between the general innovativeness and actualized innovative behavior (Arts et al., 2011; Bartels & Reinders, 2011; Im et al., 2003; Jin, 2013; van Rijnsoever & Donders, 2009). For instance, the study by Arts et al. (2011) involved the meta-analysis of 77 studies concerning consumer innovativeness and its correlates. Their study confirmed that general innovativeness is a positive predictor of innovative behavior. In the educational context, several studies have showed the positive impact of general innovativeness in terms of predicting technology usage (Gökçearslan et al., 2017; Hong et al., 2013).
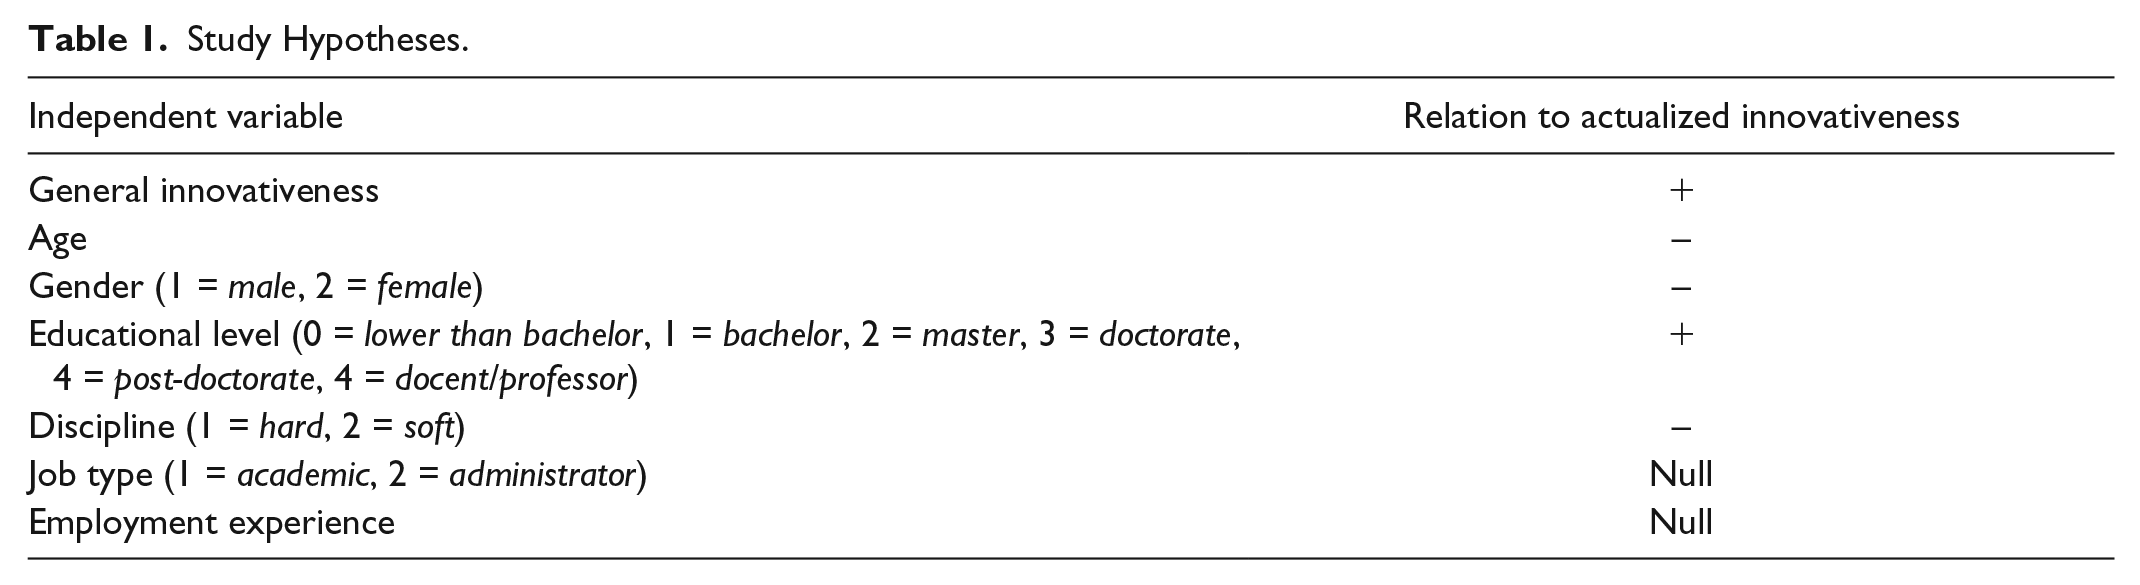
Previous studies have also examined the linkage between innovation adoption behavior and demographic variables such as age, gender, education, and discipline (Arts et al., 2011; Bartels & Reinders, 2011; Im et al., 2003; Park & Kim, 2010; Talukder, 2012; van Rijnsoever & Donders, 2009). In the technology domain, males have been found to show more of an inclination toward the adoption of innovations than females. Furthermore, younger individuals have been reported to show higher rates of innovation usage than their older counterparts (Arts et al., 2011; Bartels & Reinders, 2011; Im et al., 2003). Individuals who work in soft disciplines are considered to be more prone to embracing new innovations than their counterparts who work in hard disciplines (S. Manca & Ranieri, 2016a; Nández & Borrego, 2013; Wang & Meiselwitz, 2015). The findings regarding the educational level indicated null relationships (Arts et al., 2011; Im et al., 2003), while employment experience and job type were seldom examined and, thus, no pre-assumptions were hypothesized.
The Context
In 2014, Tampere University, Finland, joined the cloud computing revolution and embraced the use of Microsoft Office 365 (O365) cloud services. The adoption was stimulated by a number of factors, including the deficiency of the old system in terms of coping with work-related demands and the high cost of upgrading it. The choice of O365 was driven by the recommendation of the European Commission as well as by positive feedback from other Finnish universities that had already adopted O365. Therefore, investigating how staff members perceive and use the O365 services is one of the aims of the present study.
The current study measured innovativeness at two levels: general and actualized behavior. The reason that we opted to measure general innovativeness rather than domain-specific innovativeness—although the latter approach was appealing—is that Tampere University, as most of the universities today, is a vivid and full-of-changes environment, and not only when considered from the technological perspective (Aldahdouh et al., 2017). Hence, it was simply more logical and valuable in this context to trace the staff members’ willingness to change in general, rather than to assess their willingness to adopt specific technological innovations.
The Present Research
The present research project represents part of our ongoing efforts to study the factors that influence innovation adoption in the field of higher education. It is based on a two-phase study. First, we aimed to explore the staff members’ usage of social media, technological devices, and cloud computing services. More specifically, during the first phase of study, we reported on the wide spectrum of technologies used by staff members, the frequency of their usage and the distribution of the usage in relation to certain demographic variables. Second, we examined a model in which general innovativeness and demographic variables serve as predictors of actualized innovativeness. Based on the literature review aforementioned in innovativeness section, the hypotheses regarding the relationship between the predictors and the outcome variable were developed as shown in Table 1.
Study Hypotheses.
Methodology
Participants
The main study sample consisted of 502 members of staff of Tampere University, Finland. There were 270 males and 232 females, and they had a mean age of 45.45 years (SD = 11.297, range: 21–67 years). They averaged 173.26 months of employment experience in higher education (approximately 14.44 years) (SD = 118.776). In terms of their educational qualifications, 93 (18.5%) had degrees lower than a bachelor’s degree, 35 (7%) had completed a bachelor’s degree, 229 (45.6%) had completed a master’s degree, 77 (15.4%) had completed a doctoral or post-doctoral degree, and 68 (13.5%) were docents or professors. The participants included 368 (73.3%) academic staff members and 134 (26.7%) administrative staff members.
A subsample (n = 106) from among the initial 502 staff members participated in the second phase of the study. The subsample included 43 males and 63 females. The participants were, on average, 45.19 years of age (SD = 11.726, range: 23–67 years), and they reported an average of 176.84 months spent working in higher-education-related jobs (approximately 14.74 years) (SD = 126.386, range: 7–480 months). The majority of participants were academic staff (71.7%, n = 76), while the remainder were administrators. The distribution of their educational levels was as follows: 18 (17%) had degrees lower than a bachelor’s degree, 9 (8.5%) had completed a bachelor’s degree, 53 (50%) had completed a master’s degree, 10 (9.4%) had completed a doctoral or post-doctoral degree, and 16 (15.1%) were docents or professors.
Measures and Procedures
During the academic year 2015 to 2016, staff members of Tampere University were invited to complete a questionnaire designed to measure their general innovativeness. The questionnaire was distributed using the “elomake” institutional survey management system. The staff were also invited to supply their email addresses if they wanted to be contacted regarding the next phase of the study. During the 2016 to 2017 academic year, an online Technology Usage Questionnaire (TUQ) was administered to the staff. The questionnaire was developed by the authors with the aim of measuring actualized innovativeness.
General innovativeness
A shortened version (13 items) of Hurt and colleagues’ (1977) Individual Innovativeness Scale was adopted to measure the staff members’ orientations toward change (e.g., “I enjoy trying new ideas”). The scale has previously shown strong psychometric characteristics, and its use as a valid measure of general innovativeness has been repeatedly demonstrated (Goldsmith, 1990; Pallister & Foxall, 1998). The Cronbach’s α of the scale was .820.
Structure of the TUQ
The TUQ consisted of four sections: demographic data, social media, technological devices and technological services. The social media section included questions about Facebook, Twitter, Mendeley, LinkedIn, ResearchGate, Academia.edu and institutional Office 365 Yammer SNSs. The devices section included questions about smart phones, tablets, laptops, and desktop computers. The services section included questions about institutional Office 365 services (as provided by the institution to its staff members) and commercial services (services other than those provided by the institution). The considered services included email, online documents, calendar, web-based conferencing services, storage space, and instant messaging. The idea behind distinguishing between commercial and institutional services is that staff members could have used commercial services long before the services offered by the institution were available. In such cases, measuring actualized innovativeness based on the institutional services alone would generate misleading results. The frequency of usage was assessed using a six-point Likert-type scale (1 = never, 2 = once or several times a month, 3 = once or several times a week, 4 = once or several times a day, 5 = once or several times an hour, 6 = all the time). The full questionnaire is available in the supplementary material accompanying this article.
Actualized innovativeness
The prior literature has identified two main methods for measuring actualized innovativeness, namely the time-of-adoption and cross-sectional methods. When using the time-of-adoption method, individuals are typically asked to recall when they started to use a certain innovation. The answer as to how early in time the individual adopted the innovation in question is then used to decide how innovative that individual is. In contrast, when using the cross-sectional method, individuals are asked to select which innovations they have embraced from among a comprehensive list of innovations within a certain category (e.g., a list of new Web 2.0 tools). The level of innovativeness is then measured based on the number of innovations adopted by a given individual, such that the more innovations adopted, the more innovative the individual is. The cross-sectional method was devised to overcome the recall problem associated with the time-of-adoption method. An additional advantage of the cross-sectional method concerns its aggregated nature (i.e., it involves a wide spectrum of innovations). This aggregated nature is of particular merit in studies examining the relationships between personality and actualized behavior (Reinhardt & Gurtner, 2015). However, despite these advantages, the cross-sectional method does give rise to the common method bias issue (Bartels & Reinders, 2011; Podsakoff et al., 2003). In addition, when applying the cross-sectional method, a certain amount of variation between participants is lost because it is not possible to distinguish between a participant who started using the technology only recently (a late adaptor) and a participant who was among the first to acquire it (an innovator).
To avoid such a loss of data, we followed the suggestion of Reinhardt and Gurtner (2015) and combined the time-of-adoption approach with the cross-sectional approach. Instead of providing the participants with a check-list of technologies, they were asked to indicate the year in which they started using each technology from among a pre-defined list of years (the drop-down list of years was ordered from the year the questionnaire was distributed to the year the technology was launched). Moreover, at the top of each list, two additional items were added: (a) “I don’t know about this technology,” which indicated that the participant was the least innovative and (b) “I have never used this technology,” which indicated that the participant was a little bit more innovative (since he or she at least knew about the technology). Therefore, the coding was built so that lower values represented lower innovativeness scores, while higher values represented higher innovativeness scores (see the TUQ in the supplementary material for more information).
Analysis
Statistical Package for the Social Sciences (SPSS 22.0) was used to conduct the descriptive analysis. We first calculated the percentage of technology users from among the total sample. Then we employed the chi-square test and Cramer’s V to examine the association between technology usage and demographic variables. To test how heavily the technology is used, we summed up the values of the usage frequency field for each technology and then divided the total by the maximum value of the scale for the entire sample to create a single variable, sum/(6*502). This new variable represents the percentage of heavy usage.
Next, participant’s answers to when they started using each technology were subjected to a categorical principal components analysis (CATPCA, aka non-linear principal components analysis [NLPCA]) in SPSS to objectively reduce the list of technologies to a smaller number of components (Linting & Van Der Kooij, 2012). The CATPCA is preferred over the standard principal components analysis when the variables are ordinal, as in our case. Following the guidelines of Linting and Van Der Kooij (2012), we used the ordinal analysis level, while only those variables with a total variance accounted for (VAF) of .25 or higher were maintained for the analysis.
The Spearman’s r correlation matrix was then calculated among the components generated from the CATPCA and the other study variables. The Spearman’s r approach was selected based on the recommendation by Bishara and Hittner (2012, p. 402), who indicated that Spearman’s r is “often more powerful than Pearson’s r in the context of nonnormality.”
We applied structural equation modeling (SEM) to test the hypothesized model using the R lavaan package (Rosseel, 2012). R lavaan demonstrates advanced qualities comparable to those of the most widely used commercial packages, such as LISREL and EQS (Green, 2016). R lavaan is particularly suitable for our data analysis, since it features on-board statistical tests for non-normal data, a feature that is absent from other software, such as AMOS (Arbuckle, 2013; Rosseel, 2012). We used maximum likelihood (MLM) estimation with a robust standard error and a Satorra-Bentler scaled test statistic (Rosseel, 2012; Satorra & Bentler, 1994) to manage any violations in the data’s multivariate normality. To assess the model fit, we used well-established indices, such as the confirmatory fit index (CFI), the standardized root mean square residual (SRMR) and the root mean square error of approximation (RMSEA), as well as the chi-square test statistics. According to Hu and Bentler (1999), the generally acceptable values include those greater than .90 for the CFI, those less than .06 for the RMSEA, and those less than .08 for the SRMR. For the ratio of χ2 to df, values of less than three indicate an adequate fit (Schreiber et al., 2006).
Results
First-Phase Study Results
RQ1. What kinds of technologies are used by staff members and who are the users?
The first column (Users) in Table 2 represents the percentage of technology users from among the total sample. The subsequent columns represent the percentage of each kind of technology user in the corresponding category. For example, in the table, 14% of the male participants (n = 270) and 13% of the female participants (n = 232) used Academia.edu.
Percentage of Technology Users From Among the Total Sample and Their Distribution by Gender, Job Type and Discipline.

Note. Percentages in bold represent significant differences between the paired categories according to the chi-square test. M. = male; F. = female; Ac. = academic; Ad. = administrator; H. = hard discipline; S. = soft discipline.
Numbers in parentheses represent the number of participants in the named category
An inspection of the table reveals that the most popular SNS among the staff members was Facebook (76%), followed by LinkedIn (69%) and by then Twitter and Yammer (both 45%). As for the devices, the staff showed similar usage percentages for smart phones, laptops and desktop computers, while they all showed a lower usage percentage for tablet devices. A similar distinction can be seen between the usage percentages for the email, online documents, calendar, e-conferencing tools and storage space services on the one hand and the tasks service on the other. This distinction remained consistent across both the commercial and the O365 services.
The results revealed a gender difference in terms of the use of social media, with the female participants exhibiting a stronger preference for Facebook, χ2(1) = 7.802, p < .01, Cramer’s V = 0.125, and Twitter, χ2(1) = 3.980, p < .05, Cramer’s V = 0.089, whereas the male participants were more inclined to use ResearchGate, χ2(1) = 7.013, p < .01, Cramer’s V = 0.118. Despite the fact that the male participants surpassed the female participants in using certain commercial services, such as online documents, χ2(1) = 8.108, p < .01, Cramer’s V = 0.127, and storage space, χ2(1) = 5.095, p < .05, Cramer’s V = 0.101, they showed a lower preference for using the services offered by the university, including the O365 services of email, χ2(1) = 5.917, p < .05, Cramer’s V = 0.109; calendar, χ2(1) = 5.972, p < .05, Cramer’s V = 0.109; Skype, χ2(1) = 4.711, p < .05, Cramer’s V = 0.097; and Lync, χ2(1) = 15.789, p < .001, Cramer’s V = 0.177. With regard to the usage of devices, no significant differences were found between the male and female participants in relation to any devices except for tablets, with the female participants showing a greater tendency to use tablets than the male participants, χ2(1) = 9.210, p < .01, Cramer’s V = 0.135. For a general overview of the differences between the male and female participants, see Figure 1.

Technology usage profiles by gender.
In terms of the job type, it was only logical that the number of academic staff who used Academia.edu, χ2(1) = 19.501, p < .001, Cramer’s V = 0.197; ResearchGate, χ2(1) = 64.075, p < .001, Cramer’s V = 0.357; and Mendeley, χ2(1) = 10.428, p < .01, Cramer’s V = 0.144, was higher than the number of administrators, who instead showed a greater inclination to use Twitter, χ2(1) = 6.325, p < .05, Cramer’s V = 0.112, and Yammer, χ2(1) = 7.386, p < .01, Cramer’s V = 0.121. As depicted in Figure 2, the difference between the numbers of academic and administrator users was clear and in favor of the administrators. A case in point could be the higher difference observed in relation to the usage of O365 services.

Technology usage profiles by job type.
Regarding the discipline (see Figure 3), the staff who worked in soft disciplines outperformed their counterparts working in hard disciplines in relation to the usage of almost all technologies: Academia.edu, χ2(1) = 7.139, p < .01, Cramer’s V = 0.137; Facebook, χ2(1) = 6.816, p < .01, Cramer’s V = 0.134; Twitter, χ2(1) = 13.559, p < .001, Cramer’s V = 0.188; Yammer, χ2(1) = 10.385, p < .01, Cramer’s V = 0.165; tablets, χ2(1) = 4.032, p < .05, Cramer’s V = 0.103; desktop computer devices, χ2(1) = 6.369, p < .05, Cramer’s V = 0.129; O365 Outlook, χ2(1) = 4.344, p < .05, Cramer’s V = 0.107; and Skype services, χ2(1) = 5.234, p < .05, Cramer’s V = 0.117. Exceptions to this can be seen in the cases of ResearchGate and the O365 Tasks service, in which the staff who worked in hard discipline accounted for the most users.

Technology usage profiles by discipline.
RQ2. How heavily is social media used?
In the previous section, the research question concerned whether the staff members were using the investigated technologies or not. In this section, we move forward with those who used each technology to test how frequently they used it.
The results showed that the degree (or heaviness) of usage of academic social networks ranged between 25% for ResearchGate and 19% for Academia.edu and Mendeley. The staff members were asked to provide more details regarding the general social networks so that a distinction could be made between use for personal and for work purposes. Figure 4 shows that the heaviness of SNS use for both work and personal purposes ranged between 19% and 30%, except for the heaviness of using Facebook for personal purposes, which reached 50%. An interesting result presented in Figure 4 concerns the fact that for both Twitter and Facebook, the heaviness of usage for personal purposes exceeded that for work purposes, while the opposite was true for LinkedIn and the institution’s O365 Yammer.

Heaviness of usage of SNSs for personal versus work purposes.
RQ3. How heavily are technological devices used?
Figure 5 compares the heaviness of the usage of devices for work and personal purposes. Generally speaking, all the devices were used more than 33% and up to 73% of the time. Both smart phones and tablets were used more heavily for personal purposes, while laptops and desktop computers were used more heavily for work purposes.
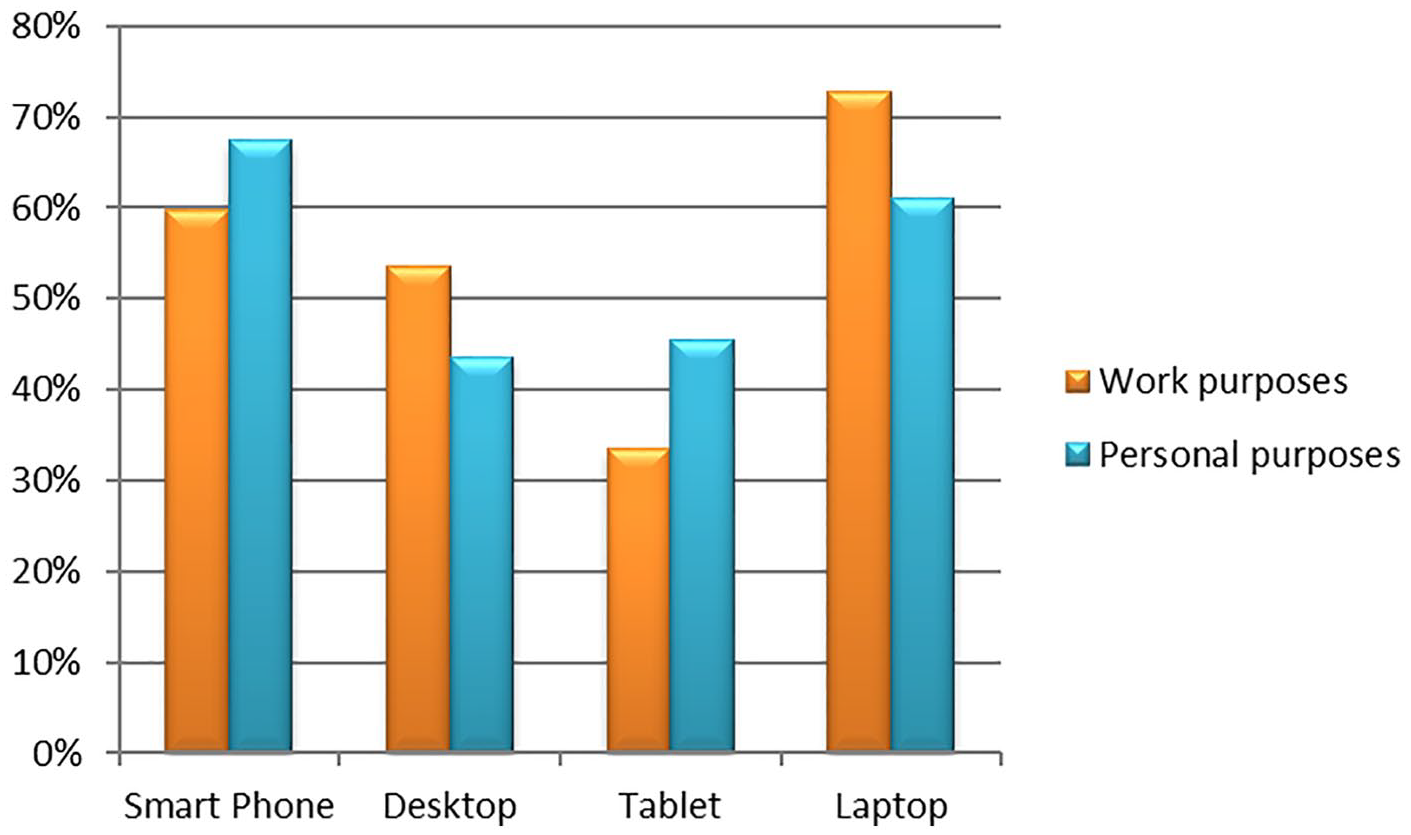
Heaviness of usage of devices for personal versus work purposes.
Smart phones were said to mainly be used for calling, text messaging, and instant messaging (e.g., texting through WhatsApp and Facebook Messenger). The results showed quite similar percentages of usage for all three purposes: instant messaging (60%), calling (61%), and text messaging (55%).
RQ4. How heavily are O365 services used?
The staff reported the highest usage of O365 Outlook (76%), followed by O365 Calendar (58%), O365 OnlineDocs (41%), and O365 OneDrive (40%). The other services were used to a somewhat similar degree and around 30% of the time (see Figure 6)

Heaviness of usage of O365 cloud services.
When the participants were asked to indicate how much (as a percentage) they used the O365 services for international communication, O365 Outlook was found to be used the most (33%), followed by Skype (18%). The usage of the other services for international communication purposes showed a somewhat similar percentage, ranging from 11% to 14%.
Second-Phase Study Results
Categorical principal components analysis
First, we assumed that the social-media-related variables (Academia.edu, ResearchGate, Mendeley, LinkedIn, Facebook, Twitter and the Institution’s O365 yammer) could be represented by two dimensions, namely academic and non-academic social media. Therefore, we entered those seven variables into the CATPCA and forced a two-dimension solution. O365 Yammer was removed from the analysis because it showed a total VAF of .115 (i.e., less than the cut-off value of .25). The results confirmed that the two dimensions accounted for 63.4% of the variance. Next, we assumed that the device-related variables (smart phone, tablet, laptop and desktop computer) represented one dimension, and the results of the CATPCA showed that exactly one dimension accounted for 52% of the variance. Finally, we assumed that the 18 cloud services could be represented by two dimensions, namely commercial and institutional services. We excluded the email, online documents, instant messaging, and site services from the analysis because they all showed a total VAF of less than .25. The results of the CATPCA confirmed that a two-dimension solution accounted for 66.7% of the variance. Table 3 shows each item loading into its corresponding dimension.
Results of the Categorical Components Analysis.

Note. SNS = social networking sites.
The coefficients in bold represent factor loadings that are the largest for each factor indicator.
Means, standard deviations and Spearman correlations
The means, standard deviations, and correlations among the general innovativeness, the components of actualized innovativeness, and the demographic variables are summarized in Table 4.
Spearman’s r Correlations Among the Study Variables.

Note. Bold coefficients refer to Cramer’s V (based on Chi-square statistic). For Gender: 1 = male; 2 = Female. For job type: 1 = academic; 2 = administrator. For educational level: 0 = lower than a bachelor’s degree; 1 = bachelor’s degree; 2 = master’s degree; 3 = doctoral degree; 4 = post-doctoral degree; 5 = docent/ professor. For discipline: 1 = hard, 2 = soft; SNS = social networking sites.
p < .05. **p < .01.
Path analysis
The five components generated during the previous step represent the actualized innovativeness. We ran a path analysis to examine whether the general innovativeness and the demographic variables predicted the actualized innovativeness. Figure 7 depicts the final path analysis model. The fit indices showed an adequate model-to-data fit: (χ2 = 3.85, df = 8, p = .87, χ2/df = .48, CFI = 1.0, RMSEA = .00, SRMR = .03). The percentage of variance explained (R2) by the model of each technology component was as follows: academic SNSs (3%), non-academic SNSs (1%), devices (15%), institutional O365 services (16%), and commercial services (8%).

Path model of the general innovativeness and the demographic variables as predictors of the actualized innovativeness.
The results revealed that the general innovativeness contributed positively to predicting the adoption of devices (β = .29, p < .001), non-academic SNSs (β = .10, p < .05), and institution O365 services (β = .22, p < .001), as expected. However, the general innovativeness showed a non-significant effect on the adoption of academic SNSs and commercial services. In other words, the staff who showed a higher willingness to change were found to be earlier adopters of technological devices, non-academic SNSs, and institutional O365 services.
In accordance with our hypothesis, gender negatively predicted the adoption of devices. Based on the coding of the gender (1 = male, 2 = female), this means that the male participants tended to use devices earlier than the female participants. In terms of the job type, the academics seemed to adopt academic SNSs and commercial services earlier than the administrators. However, they seemed to lag behind the administrators in terms of using O365 services. A moderate negative correlation was detected between the use of O365 services and the commercial services.
Discussion
The findings of the current study show that, in general, technology is reasonably well used by the staff members of HEIs. Consistent with the literature (Al-Daihani et al., 2018; S. Manca & Ranieri, 2016b; Rowlands et al., 2011), this study found that Facebook is the most popular SNS among the staff members, followed by LinkedIn. For the academic staff in particular, Facebook is the most popular SNS, with LinkedIn, ResearchGate, Twitter, and Yammer being the next most popular SNSs, sequentially. These results are mirrored by those of Rowlands et al. (2011), who collected non-probabilistic convenience sample (N = 2,414) consisted of researchers across wide geographic range (Latin America and Caribbean, Northern America, Asia, Europe Oceania Middle East), and noted that even researchers tend to prefer generic and popular SNSs. Even though, the current findings highlighted the recent and increasing orientation of academics toward the use of professional academic SNSs. Almost the same trends were addressed by S. Manca and Ranieri (2017a), who further explained this orientation as to respond to managerial pressure on the staff to increase their performance and avoid wasting time. Another explanation could be that the growing awareness of the benefits of academic SNSs—represented by, for example, the dissemination of research findings, increased visibility and research impact, and the establishment of an academic profile for career progression—encouraged academics to direct their attention toward professional SNSs. Nonetheless, the present results also revealed that the usage of SNSs for personal purposes outweighed their usage for work purposes, which was not surprising, since it matches the findings of prior studies conducted with various samples, including the United States, Italy, and the Middle East (Al-Daihani et al., 2018; S. Manca & Ranieri, 2016a; Moran et al., 2011).
The results concerning the usage of devices indicated a similar rate for most of the devices (smart phone, tablet, laptop and desktop computers), with the tablet being the least popular option. This result matched the findings of Davison and Argyriou (2016), who identified the tablet to be the least frequently used device. In terms of services, generally speaking, the commercial services were more popular than the O365 services offered by the institution. As expected, the most popular service was email, followed by calendar, online documents, e-conferencing services, and storage space. The instant messaging, site, tasks, and contacts services were the least popular services. It is worth mentioning here that technological services are updated at a rapid pace; as some services emerge, others diminish quickly. For example, at the time the questionnaire was distributed, Lync was one of the services offered, although at the time of writing the present paper, it is no longer supported. The current findings highlighted the dominance of traditional email services despite the continuous emergence of new technologies. It seems that once individuals are familiar with a certain technology, it becomes harder for them to leave it in favor of an alternative technology, even if the alternative offers more features. In support of these results, the study by Roblyer et al. (2010) compared the use of email and Facebook by staff members. Their results revealed that the staff were significantly more likely to check their email than to check Facebook, and they did not use Facebook for daily communication in the same way they did with email.
Our findings suggest that female participants leaned more toward using generic social media such as Facebook and Twitter, while male participants were more disposed toward using ResearchGate. This could be partially explained by the results of Davison and Argyriou’s (2016) study, wherein the female participants were reported to be more likely to use the Internet as a communication tool in relation to social activities, whereas the male participants were more likely to use the Internet for information, entertainment, and commerce purposes. Otherwise, females might exhibit a greater tendency toward socialization, while males might have a greater preference for updating their academic profiles and focusing on their professional career. This could be supported by the results obtained by Rowlands et al. (2011), who found the male participants to report a stronger preference for the use of LinkedIn.
The difference in technology usage between academics and administrators is one of the most interesting findings of the present study. It seems logical and justifiable due to the nature of their work that academics have a tendency to use academic social media such as ResearchGate and Mendeley. Less convincing is the fact that academics appear to lag behind administrators in terms of harnessing the O365 services and Yammer supported by the university. This could be explained by a recent qualitative study conducted by Corcoran and Duane (2018) on 30 academic and administrative staff working in a public multi-campus HEI in Ireland. Their findings revealed a divide in social media usage between academic and administrative staff, where the latter feel detached and thus, needed the participation in Yammer to develop their sense of belonging to the organization, especially for the new staff.
Furthermore, the results suggested that Academia.edu, Facebook, Twitter, Skype and Outlook services were the most used technologies by those working in soft disciplines. In contrast, ResearchGate, Site and Tasks services were most used technologies by those working in hard disciplines. The tendency of soft scientists toward the use of Acdemia.edu and the tendency of hard scientists toward the use of ResearchGate seem to be international trends, since similar findings were documented in the recent study by Greifeneder and colleagues (2018), who investigated researchers’ attitudes toward the use of SNSs in four countries (Germany, Singapore, the United Kingdom, and the United States). In 2011, Rowlands et al. found that the hard scientists had taken the lead in terms of using recent technologies, namely social media, while the soft scientists felt that they failed to keep pace with technology, although they wished to catch up. It seems, from both our results and from those of many other studies conducted in Italy (S. Manca & Ranieri, 2016a), Spain (Nández & Borrego, 2013), and the United States (Wang & Meiselwitz, 2015) that the soft scientists have taken the lead nowadays. The reason for this discrepancy could be attributed to the importance of the content posted on social media from the staff’s perspective. Moran et al. (2012) indicated that staff in the mathematics, computing, and natural sciences fields complained about the lack of relevant content on social media sites for their particular discipline. S. Manca and Ranieri (2016a, p. 227) noted that soft scientists tended to underemphasize the importance of relevant content on social media when compared to other affordances, such as facilitating communication, sharing, and content creation.
Similar to the findings of studies conducted in the business and marketing fields (Arts et al., 2011; Bartels & Reinders, 2011; Im et al., 2003; Jin, 2013; van Rijnsoever & Donders, 2009), the results of the current study, which took place in the higher educational context, confirmed the positive role played by general innovativeness in predicting actualized innovativeness. Thus, the present findings extended previous efforts to examine the predictive power of general innovativeness (Arts et al., 2011; Bartels & Reinders, 2011; Im et al., 2003; Jin, 2013; van Rijnsoever & Donders, 2009). However, the predictive power was not the same for all the five aspects of actualized innovativeness. While the general innovativeness had a significant effect on the adoption of non-academic SNSs, technological devices and institutional O365 services, it failed to exert a significant effect on the other dimensions.
Among the investigated demographic variables, only gender and job type succeeded in predicting the actualized innovativeness. Males tended to adopt devices earlier than females. This could be interpreted in light of previous findings in the higher education context, which concluded that males exhibit more positive attitudes toward technology (John, 2015) and demonstrate less anxiety in relation to using technology than females (Venkatesh & Morris, 2000). Other studies have shown that females exhibited lower confidence (Zhou & Xu, 2007) and perceived less ease-of-use in relation to technology (John, 2015; Venkatesh & Morris, 2000). In other words, females are likely to be suspicious of the use of technology, and they may need more time to learn about it and to be sure of its functionality prior to using it. Enlightened by the predictive power of the job type, we concluded that academics were earlier adaptors of academic SNSs and commercial services, while they were later adopters of institutional O365 services. This might be interpreted in the way suggested by van Rijnsoever and Donders (2009, p. 985): “When the relationship between innovations is very close in terms of functionality, the chances of adopting both technologies simultaneously can decrease because it is not very useful to buy two different items with exactly the same function.” Staff may consider the O365 services offered by their institution to be simply another version of the commercial services that they were already using. Thus, the value of using such services may seem questionable.
Even though the model presented in the current study succeeded in explaining some of the variance in the actualized innovativeness, it seemed that both the general innovativeness and the demographic variables were only weak predictors. This conclusion was driven by the fact that the regression weights and the R2 values were rather small. The empirical finding of weak, albeit still significant, relationships substantially supports the line of research claiming that innovativeness at the abstract and general level is a poor predictor of innovation adoption behavior (Goldsmith et al., 1995; Im et al., 2003; Roehrich, 2004).
Implications
The implications of the current study are twofold. For staff members who seek to build up a reputation as scientists in their respective field, the findings re-emphasize the important role of technology in achieving their goals. Technology should serve academics in their professional development and growth in three key regards: teaching, learning, and research. The results of our study showed that the staff members were using technology, although their professional usage remained weak. Staff need to be aware of the possibilities that technology can offer to them. Research evidence on technology affordances to staff’s professional development are quite prevalent (Anderson, 2019; Donelan, 2016; Lupton, 2014; S. Manca & Ranieri, 2017b) and that failing to keep pace with technology leads to professional death (Gillard et al., 2008). For instance, Donelan (2016) investigated the professional usage of social media among UK academics and their results showed that as the level of activity on social media increase, the perceptions of positive outcomes such as career progression increase. In a recent review study of 111 papers, A. Manca and Whitworth (2018) concluded four main practices of social media in HEIs: (1) social media as an education research tool or generator of data, (2) social media as professional practice, (3) social media as an administrative intervention, and (4) social media as a new knowledge-formation and/or literacy practice. While some studies (Holland et al., 2016) showed that the personal use of social media during work time has positive consequences on morale, retention, job performance, and satisfaction, there are also studies referred to a cyber loafing, where the use of Internet for personal or non-related purposes, has negative consequences such as perceived injustice, disengagement and stress (Holland et al., 2016; McDonald & Thompson, 2016). Thus, here we are not arguing to decrease the personal usage of technology, rather to increase the professional usage to gain the optimal benefits. Moreover, it is well known that conducting scientific research in all disciplines requires tremendous effort and, of course, the aim is to constantly build on current knowledge. A vivid example can be seen in the fact that just 11 journals together published 366,000 research articles and 13,000 review articles in the 1-year period from 2013 to 2014 (Bohannon, 2016). What would cause readers to seek out a specific researcher’s work from among this huge heap of knowledge? One could argue that the quality of the work should draw in readers, but the question remains: how would they reach the work in the first? Academics may conceive that publishing their works in well-indexed journals and with respectable publishers would assist them in this regard. They may be right to hold such a belief, but respectable publishers still appeal authors to create web-friendly materials (i.e., video abstract, infographics, short blog, vlog) and to help in sharing and re-sharing their work. Recent findings by Thoma and colleagues (2018) revealed that promoting articles using podcasts and infographics positively impacted both research dissemination and readability in terms of the Altmetric scores and abstract views. Furthermore, it is not only in relation to research dissemination and visibility that the use of technology has proven to be influential, it is also in terms of fostering creativity; employees with a diverse Twitter network tend to generate better ideas (Parise et al., 2015).
The second main implication of this study is directed toward academic institutions as incubators of their staff. A large-scale study conducted in the higher education context (S. Manca & Ranieri, 2016a) cited the lack of time, the lack of administrative support, and the increase in workload as being some of the barriers that hinder the usage of social media. This situated HEIs as inhibitors rather than facilitators of technology adoption (Hasanefendic et al., 2017). For example, the findings by Corcoran and Duane (2018) found that knowledge sharing on social media platforms are limited due to the prevalent organization structure and culture in higher education. HEIs should recognize that a higher level of technology usage by staff implicitly suggests a significant increase in an institution’s scientific indicators, prestige, and ranking (Al-Daihani et al., 2018). In this study, we add our voice to S. Manca and Ranieri’s (2017a) call for the re-calculation of the workload of academics to include new tasks—enhancing their technological capacities, disseminating their work through social media, and participating in scientific dialogues on the Internet—in order to significantly improve the performance and satisfaction of staff members.
Early technology adoption has indeed advantages. In their paper, Gillard et al. (2008) articulated 10 reasons as to why educators should be early adopters of technological innovations. Among the most important reasons are setting example to students and promoting the concept of lifelong learning. Furthermore, keeping up with the latest innovations fulfill the leadership role of higher education since “the use of IT within academia has quickly become a benchmark by which academic institutions define their competitiveness, effectiveness, and leadership” (Gillard et al., 2008, p. 29). HEIs should be at the forefront, or on an equal footing with the speed of adoption of technology in the workplace, not less.
We wish to end our discussion of the implications of the present study by whispering in the ear of HEI administrations: being late to adopt technologies has consequences. We have provided evidence that staff members resorted to the use of commercial alternatives to the technological services that the university was still studying with regard to the adoption decision. We do not call for the rushed adoption of whatever technology emerges, but rather for wise and fast decision making. As the proverb goes, “the early bird gets the worm, but the second mouse gets the cheese.”
Limitations and Future Research
The findings of the present study raise several intriguing questions that could serve to develop our understanding of actualized innovativeness. However, it is important to recognize that the study did have a number of limitations. Our cross-sectional design limits our ability to confirm the causal relationships, although future studies with a longitudinal design could validate our claims. A second drawback of this study is that all the constructs were measured by means of a self-reported questionnaire. Thus, the results may be subject to the common method bias (Podsakoff et al., 2003). We allowed for a 1-year gap between the distribution of the two questionnaires used in the two phases of the study as a procedural remedy for common variance issues (Podsakoff et al., 2003). This should handle most—but not all—of the common rater effects, item characteristic effects and item context effects. Further studies need to be conducted that take a variety of measurement methods into account. For example, a study that retrieves the technology usage data from the log data, after taking into account any ethical considerations, may overcome a lot of issues related to recalling past events and common method bias. Another issue concerns the generalizability of the results from the second phase of the study, which were limited due to the small sample size and the higher education context. Future studies should examine the applicability of the model using larger samples in different contexts. At this stage, we know that general innovativeness is a function of other psychological factors, such as goal orientations (Aldahdouh et al., 2019), and that it contributes positively to predicting actualized innovativeness. However, our knowledge is limited in terms of interpreting how these factors interact with each other to influence innovation adoption. Hence, there exists a need for qualitative studies that delve into individual thoughts to explore how and why these factors interact in such a way.
Notwithstanding these limitations, the findings from this study make several contributions to the current literature. First, the present study has a methodological contribution in that it developed the TUQ (see supplementary material) and it has been one of the first attempts to measure the actualized innovativeness in a novel way gathering the time of adoption and the number of technologies adopted, and then submitting the results to CATPCA in order to generate representative factors objectively. Further, this study offers a general description of technology usage at Finnish HEIs in comparison to other universities worldwide; by and large the results confirmed that the technology usage at Finnish HEIs is no exception. Finally, the study contributes to the debate on the relationship between the general and actualized innovativeness but in higher education context, and hence it expands the scope and generalizability of theories. The insights gained from this study may be of assistance to researchers and decision makers at HEIs.
Supplemental Material
Technology_Usage_QuestionnaireTUQ_-_supplementary_file – Supplemental material for Technology and Social Media Usage in Higher Education: The Influence of Individual Innovativeness
Supplemental material, Technology_Usage_QuestionnaireTUQ_-_supplementary_file for Technology and Social Media Usage in Higher Education: The Influence of Individual Innovativeness by Tahani Z. Aldahdouh, Petri Nokelainen and Vesa Korhonen in SAGE Open
Footnotes
Declaration of Conflicting Interests
The author(s) declared no potential conflicts of interest with respect to the research, authorship, and/or publication of this article.
Funding
The author(s) disclosed receipt of the following financial support for the research, authorship, and/or publication of this article: This research was funded by Tampere University, Faculty of Education and Culture.
Supplemental Material
Supplemental material for this article is available online.
Author Biographies
References
Supplementary Material
Please find the following supplemental material available below.
For Open Access articles published under a Creative Commons License, all supplemental material carries the same license as the article it is associated with.
For non-Open Access articles published, all supplemental material carries a non-exclusive license, and permission requests for re-use of supplemental material or any part of supplemental material shall be sent directly to the copyright owner as specified in the copyright notice associated with the article.