
Abstract
The purpose of this study is to investigate the relationship between the Shannon entropy procedure and the Jensen–Shannon divergence (JSD) that are used as item selection criteria in cognitive diagnostic computerized adaptive testing (CD-CAT). Because the JSD itself is defined by the Shannon entropy, we apply the well-known relationship between the JSD and Shannon entropy to establish a relationship between the item selection criteria that are based on these two measures. To understand the relationship between these two item selection criteria better, an alternative way is also provided. Theoretical derivations and empirical examples have shown that the Shannon entropy procedure and the JSD in CD-CAT have a linear relation under cognitive diagnostic models. Consistent with our theoretical conclusions, simulation results have shown that two item selection criteria behaved quite similarly in terms of attribute-level and pattern recovery rates under all conditions and they selected the same set of items for each examinee from an item bank with item parameters drawn from a uniform distribution U(0.1, 0.3) under post hoc simulations. We provide some suggestions for future studies and a discussion of relationship between the modified posterior-weighted Kullback–Leibler index and the G-DINA (generalized deterministic inputs, noisy “and” gate) discrimination index.
Keywords
Summative assessments are typically used for grading and accountability purposes, and formative assessments are often used for supporting student learning (Laveault & Allal, 2016). Researchers and practitioners began to focus on formative assessments for student learning, rather than focus solely on summative assessments because many evidences showed that formative assessments produce significant and often substantial learning gains and improve student confidence and achievement (Black & Wiliam, 1998; Laveault & Allal, 2016). Cognitive diagnosis assessment (CDA) can be regarded as a kind of formative assessments because it is intended to promote assessment for learning to modify instruction and learning in classrooms by providing the formative diagnostic information about students’ cognitive strengths and weaknesses (Jang, 2008; Leighton & Gierl, 2007). CDA has received increasing attention in recent years (Leighton & Gierl, 2007; Rupp et al., 2010; K. K. Tatsuoka, 2009), especially since the No Child Left Behind Act of 2001 mandated the selection and use of diagnostic assessments to improve teaching and learning and the new federal grant program known as “Race to the Top” (RTTT) has led into a new era of K–12 assessments which emphasized both accountability and instructional improvement (Chang, 2012).
Computerized adaptive testing (CAT) has become a popular mode of many summative and formative assessments (Quellmalz & Pellegrino, 2009). As a method of administering test items, CAT tailors the item difficulty to the ability level of the individual examinee (Chang & Ying, 2007). It is attractive to practitioners because it yields a high measurement precision with a short test. In the framework of CAT, cognitive diagnostic computerized adaptive testing (CD-CAT) is also a popular mode of online testing for cognitive diagnosis, as it can help one make informed decisions about the next steps in instruction for each student and greatly facilitate individualized learning (Chang, 2015) and provide many benefits to support formative assessments (Gierl & Lai, 2018). Particularly, the U.S. National Education Technology Plan 2017 with the title of “Reimagining the Role of Technology in Education” (U.S. Department of Education, 2017) emphasizes that technology can help us redefine assessment to meet the needs of the learner in a variety of ways. For technology-based formative assessments or CAT, test items are adapted to learner’s ability and knowledge during the testing process. Thus, CAT can provide real-time reporting of results during the instructional process, which is crucial for personalized learning (Chen & Chang, 2018).
A key ingredient in CD-CAT is the item selection index. Researchers have attempted to investigate many item selection indices. The first type of index is based on the Kullback–Leibler (KL) information, such as the KL index (Cheng, 2009; McGlohen & Chang, 2008; C. Tatsuoka & Ferguson, 2003; Xu et al., 2003), the likelihood- or posterior-weighted KL (LWKL or PWKL) index and the hybrid KL index (Cheng, 2009), the restrictive progressive or threshold PWKL index (Wang et al., 2011), the aggregate ranked information index and the aggregate standardized information index (Wang et al., 2014), the modified PWKL (MPWKL) index (Kaplan et al., 2015), the KL expected discrimination index (W. Y. Wang et al., 2015), the posterior-weighted cognitive diagnostic model (CDM) discrimination index and the posterior-weighted attribute-level CDM discrimination index (Zheng & Chang, 2016), and the information product index (Zheng et al., 2018). The second is based on the Shannon entropy, called the Shannon entropy (SHE) procedure (Cheng, 2009; McGlohen & Chang, 2008; C. Tatsuoka, 2002; C. Tatsuoka & Ferguson, 2003; Xu et al., 2003, 2016). The third is based on the mutual information, including the expected mutual information index (Wang, 2013) and the Jensen–Shannon divergence (JSD) index (Kang et al., 2017; Minchen & de la Torre, 2016; Yigit et al., 2018). There are other indices, such as the generalized deterministic inputs, noisy “and” gate (G-DINA; de la Torre, 2011) model discrimination index (GDI; Kaplan et al., 2015), the rate function approach (Liu et al., 2015), the halving algorithm (C. Tatsuoka & Ferguson, 2003; W. Y. Wang et al., 2015; Zheng & Wang, 2017), and so on. Yigit et al. (2018) has proved that the mutual information index and the JSD index are equivalent. Although the previous simulation studies showed that the SHE and the JSD or mutual information perform quite similarly, the main purpose of this study is to describe the theoretical relationship between the SHE procedure and the JSD index.
CDMs
Before introducing item selection indices for CD-CAT, the general concept of CDMs and the G-DINA model as a kind of general CDMs are described here. CDMs have been defined by Rupp and Templin (2008) as “probabilistic, confirmatory multidimensional latent variable models with a simple or complex loading structure” (p. 226). The loading structure for a CDM is represented by its Q-matrix (K. K. Tatsuoka, 1983, 2009). The entries of a Q-matrix indicate 1 or 0, in which
Let

where
For the identity link, that is
Overview of Two Item Selection Indices for CD-CAT
SHE Procedure
After an item bank has been calibrated with a CDM, one must determine how to choose items for examinees from the item bank. CD-CAT employs algorithms to select items sequentially on the basis of examinee’s responses, which is designed to classify student’s attribute pattern accurately with a short test. The SHE procedure (Cheng, 2009) and the JSD index (Minchen & de la Torre, 2016; Yigit et al., 2018) are described below.
Suppose that the prior is chosen as

where

Assuming that

From the last term,
By considering the uncertainty of item response

where the second term follows directly from
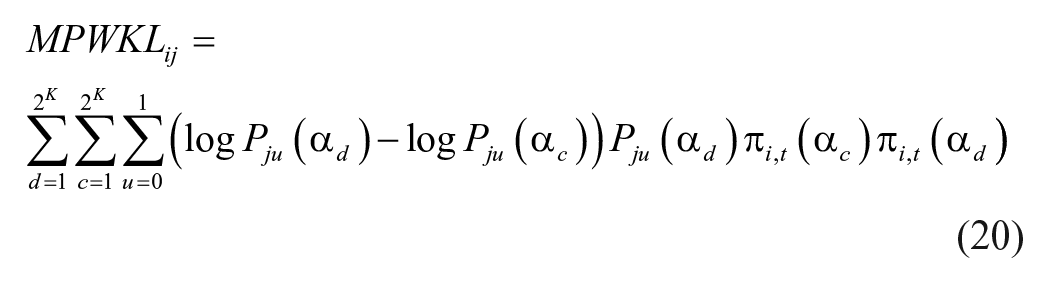
The next item to be selected for examinee

As shown above,
JSD Index
The JSD as a new class of information measures based on the SHE was introduced by Lin (1991) to measure the overall difference of any finite number of distributions. Let
where

and

The next item to be administered for examinee
Similar results have been observed by Kang et al. (2017) within the framework of dual-objective CD-CAT (Kang et al., 2017; McGlohen & Chang, 2008; Wang et al., 2014; Zheng et al., 2018). For simultaneously estimating examinees’
Relationship Between the SHE and the JSD
The purpose of this section is to establish the statement that the SHE and the JSD as two item selection criteria in CD-CAT are linearly related. Because the JSD itself is defined by the SHE, we apply the well-known relationship between the mutual information (or JSD) and SHE to establish a relationship between the item selection criteria that are developed using these two measures. The mutual information and SHE satisfy two well-known equations 2.43 and 2.44 from Theorem 2.4.1 in Cover and Thomas (2006, p. 21); that is,
Next, we will provide an alternative way to prove the above statement, which would be useful for a better understanding of the relation. For simplicity, let the denominators or the normalizing constants of Equations 2 and 4 be

By the definition of SHE, Equation 10 can be computed by

Recall from two basic logarithmic properties that the log of a quotient is equal to the difference between the logs of the numerator and denominator, and the log of a product is equal to the sum of the logs of the factors. Equation 11 can be written as

Notice
since
After changing the order of the summation and factoring two constant terms (i.e.,
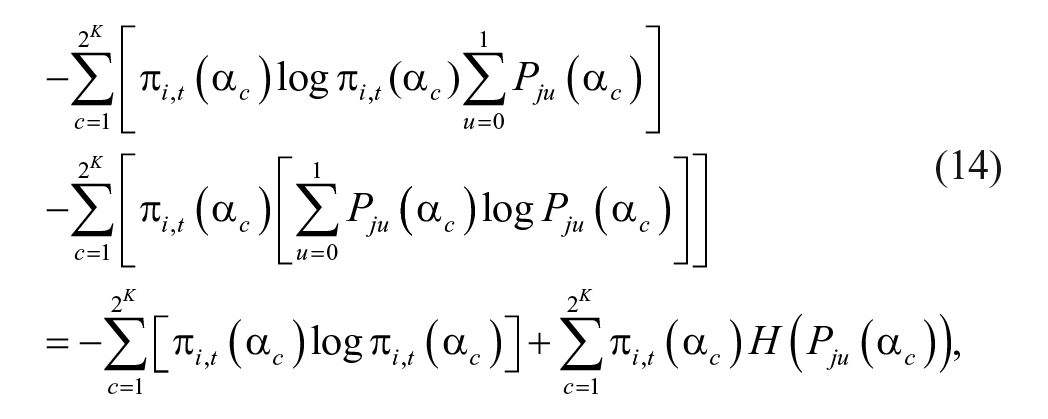
which follows from
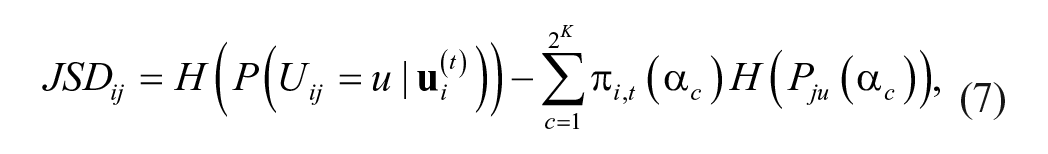
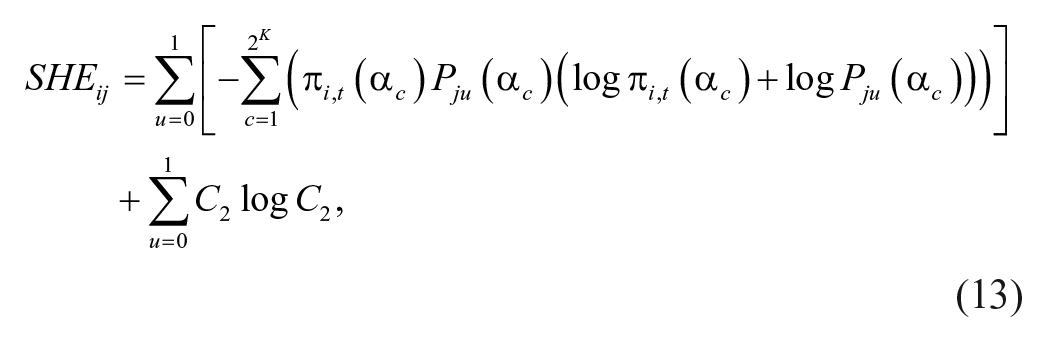
Based on Equations 3, 13, and 14, the

From Equation 8, the third term on the right-hand side of Equation 15 is equal to

which can be rewritten as

The meaning of Equation 17 is consistent with the fact that the JSD or mutual information is a special case of a more general quantity called relative entropy. As H(π
i,t
) is not a function of both item parameters and item responses of the candidate item j, it is a constant for examinee i. Thus, minimizing
Tables A1 and A2 in the appendix are presented for the illustration of computation of values of indices for the SHE and JSD. Here, the SHE and JSD are computed for two items with different item response distributions or different item parameters, where a discrete uniform prior distribution for attribute patterns was used. From these two tables, the relationship between the SHE and JSD for the two items satisfied Equation 16 or Equation 17, and minimizing
Simulation Study
Design
A small-scale simulation study was conducted to compare the performance of the SHE and JSD. Following a design similar to that in Cheng (2009) and Xu et al. (2016), the DINA model and five independent attributes were considered in the simulation study. For the generation of four item banks, a Q-matrix for 300 items should be first simulated. The entries of the Q-matrix were generated item by item and attribute by attribute. Each item has 20% chance of measuring each attribute. Four item banks were considered: (a) slipping and guessing parameters were fixed as one of the three levels, such as 0.05, 0.1, or 0.2, and (b) both slipping and guessing parameters were randomly draw from a uniform distribution on the interval [0.1, 0.3]. Test length was either fixed at 5 or 10 items. The sample size of examinees was set to 2,000. Attribute patterns for all examinees were randomly drawn from all possible attribute patterns with equal probability. Details of simulation design are presented in Table A3 in the appendix.
To consider the impact of the simulation of item responses in CD-CAT on the performance of the SHE and JSD, two types of CAT simulation were considered: full simulations or post hoc simulations (Magis et al., 2017). In case of a full CAT simulation, an item response for examinee
Results
The attribute-level recovery rate is defined as the proportion of each attribute that is correctly identified. The pattern recovery rate is defined as the proportion of entire attribute pattern that is correctly recovered. Mean and standard deviation of attribute-level and pattern recovery rates for each level of item parameters are shown in Tables 1–4. For the SHE, our results are consistent with the results of Xu et al. (2016). Consistent with our theoretical conclusions, the SHE and JSD behaved quite similarly, because their attribute-level and pattern recovery rates were very close to each other under all conditions.
Mean and Standard Deviation (in brackets) of Attribute and Pattern Recovery Rate for Slipping and Guessing Parameters of 0.05.

Note. SHE = Shannon entropy; JSD = Jensen–Shannon divergence.
Mean and Standard Deviation (in brackets) of Attribute and Pattern Recovery Rate for Slipping and Guessing Parameters of 0.1.

Note. SHE = Shannon entropy; JSD = Jensen–Shannon divergence.
Mean and Standard Deviation (in brackets) of Attribute and Pattern Recovery Rate for Slipping and Guessing Parameters of 0.2.

Note. SHE = Shannon entropy; JSD = Jensen–Shannon divergence.
Mean and Standard Deviation (in brackets) of Attribute and Pattern Recovery Rate for Slipping and Guessing Parameters of U(0.1, 0.3).

Note. SHE = Shannon entropy; JSD = Jensen–Shannon divergence.
Figure 1 presents pattern recovery rates for different test lengths and simulation types under slipping and guessing parameters of U(0.1, 0.3). From the two top panels of Figure 1, it can be observed that pattern recovery rates obtained by the SHE and JSD are the same for each replication under post hoc simulations. While for the full simulations, pattern recovery rates for the SHE and JSD were different for each replication because different item responses had an impact on test item selection. When the test length was 5, 43% pattern recovery rates of the SHE were higher than the mean of pattern recovery rates of the JSD, and 51% pattern recovery rates of the JSD were higher than the mean of pattern recovery rates of the SHE. The percentages became 49% and 60%, respectively, when the test length was 10. This result is consistent with the previous finding: “The mutual information item selection algorithm generates nearly the most accurate attribute pattern recovery in more than half of the conditions” (Wang, 2013, p. 1030).
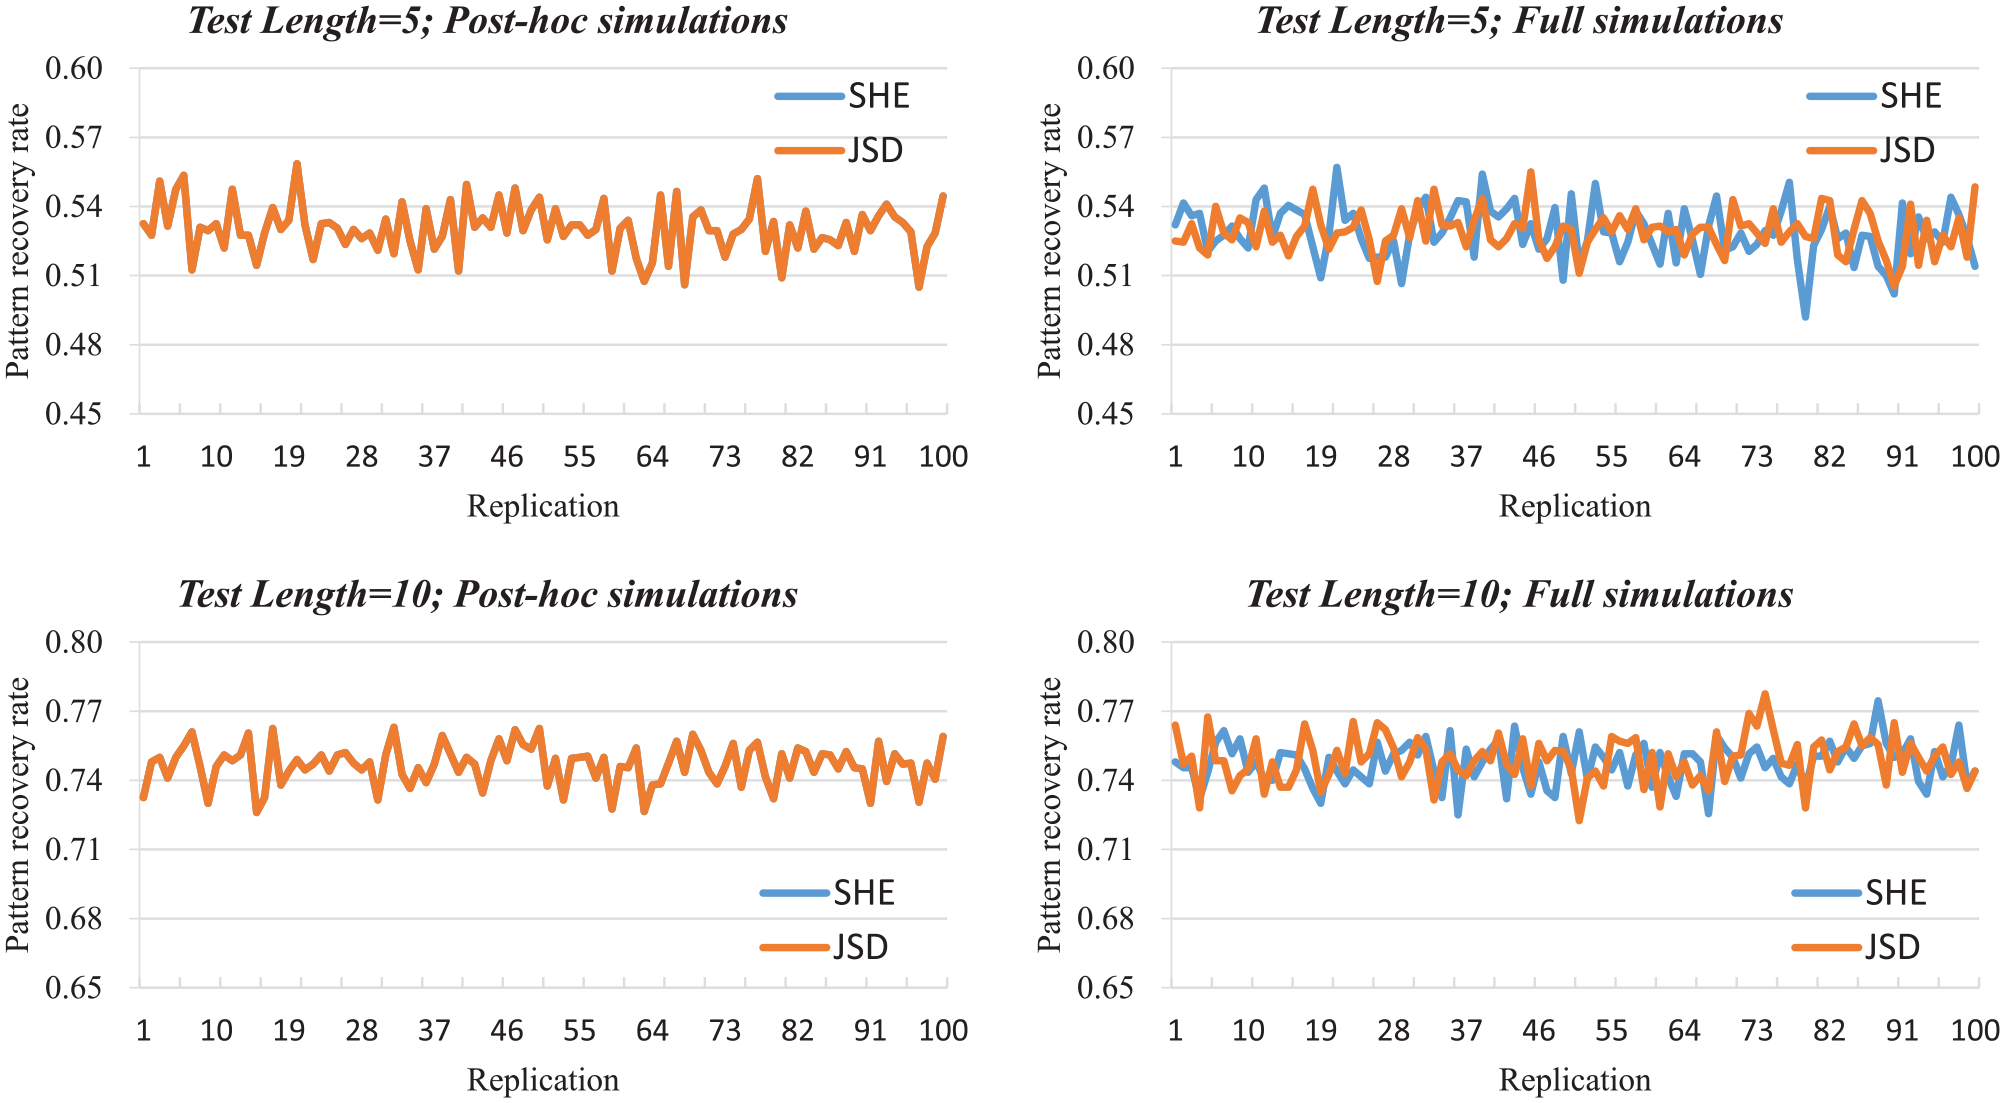
Pattern recovery rate for different test lengths and simulation types under slipping and guessing parameters of U(0.1, 0.3).
We also checked whether two item selection algorithms selected the same set of items for each examinee under post hoc simulations. For the first three item banks, two item selection algorithms based on the SHE and JSD indeed selected the same set of items but with slightly different orders. Because all test items in these item banks have the same values of item parameters, some items presented in different positions have the same value of SHE or JSD. For example, two items with same item parameters but a single distinct attribute may have the same value of SHE or JSD. For the fourth item bank, we found that two item selection algorithms based on the SHE and JSD selected the same set of items.
Discussion
In this study, we complete the proof that the SHE procedure and the JSD are linearly related under CDMs. In other words, we showed that minimizing JSD and maximizing SHE can be used interchangeably because they will select the same items in CD-CAT. The two measures are linearly related but they are not equal, meaning that two measures have the form
This study is not without limitations. Theoretically, SHE, KL information, and mutual information are three ways to measure the uncertainty, and they are related to each other. It would be interesting to further investigate relationships of item selection indices based on the KL information, the SHE, the JSD, and other indices under general dichotomous or polytomous CDMs. For example, the GDI and MPWKL might be related, because they perform similarly and better than the PWKL in terms of correct attribute classification rates or test lengths. We believe GDI is simply a weighted variance of the probabilities of success of an item associated with attribute patterns given an attribute pattern distribution, and therefore we can start with comparing the weighted KL with the weighted variance to show a relationship. The GDI is defined as follows (Kaplan et al., 2015):

where

The following algebraic procedures will simplify the calculations in Equation 19 above
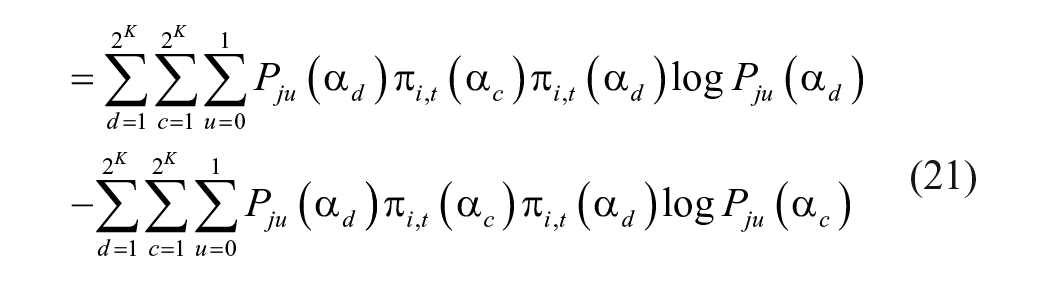


where Equation 20 follows from the quotient rule of logarithmic properties and Equation 25 follows directly from the complement rule in probability, as expressed by the equation
The findings of this study may contribute to the growing literature on formative assessments. First, theoretical derivations and empirical examples have shown that both indices (SHE and JSD) are expected to select the same next item given item response pattern of the same set of previous test items in CD-CAT. Consistent with our theoretical conclusions, simulation results have shown that the SHE and JSD behaved quite similarly in terms of attribute-level and pattern recovery rates. This finding can possibly be useful to help practitioners to choose an effective item selection algorithm (SHE or JSD) in the development and application of CD-CAT system in the field of educational and psychological measurement. Second, the effectiveness of item selection algorithm in CD-CAT will impact the quality of curriculum delivery and the outcomes of learning. If individual diagnosis results with a high measurement precision can be provided by using an effective item selection algorithm of CD-CAT, then diverse instructional materials can cater to the diverse needs or specific knowledge status of all learners (Lashley, 2019). Finally, information-based indices are now not only widely applied in CD-CAT, but also useful for any test construction stage where test items are selected based on their statistical characteristics (e.g., Henson & Douglas, 2005; Henson et al., 2008; Kuo et al., 2016). For example, the cognitive diagnostic index, the attribute-level discrimination index, and their modified indices as KL information based measures have been used for the construction of diagnostic tests. Future research on automated test assembly for cognitive diagnosis will expand the scope of the application of the current finding.
Footnotes
Appendix
Details of Simulation Design.

| Factors | Details |
|---|---|
| Attribute structure | Independent structure with five attributes |
| CDM | The DINA model |
| Examinees | Sample size is 2,000 |
| Attribute patterns are generated by taking one of the 25 possible patterns with equal probability | |
| Item banks | Each of four item banks consists of 300 items |
| Each item has 20% chance of measuring each attribute | |
| Item parameters are set to s = g = 0.05, s = g = 0.1, s = g = 0.2, or s~U(0.1, 0.3) and g~U(0.1, 0.3) | |
| CD-CAT | Test length is either fixed at 5 or 10 items |
| Two item selection indices are the SHE and JSD with a prior uniform distribution | |
| MLE method is used to estimate attribute patterns of examinees | |
| Simulations | Full simulations or post hoc simulations are used to generate item responses |
Note. CDM = cognitive diagnostic model; DINA = deterministic inputs, noisy “and” gate; CD-CAT = cognitive diagnostic computerized adaptive testing; SHE = Shannon entropy; JSD = Jensen–Shannon divergence; MLE = maximum likelihood estimation.
Declaration of Conflicting Interests
The author(s) declared no potential conflicts of interest with respect to the research, authorship, and/or publication of this article.
Funding
The author(s) disclosed receipt of the following financial support for the research, authorship, and/or publication of this article: This work was partially supported by the Key Project of National Education Science “Twelfth Five Year Plan” of the Ministry of Education of China (Grant No. DHA150285).