
Abstract
The purpose of this study was to generate an item bank for assessing faculty members’ assessment literacy and to examine the applicability and feasibility of a Computerized Adaptive Test (CAT) approach to monitor assessment literacy among faculty members. In developing this assessment using a sequential mixed-methods research design, our goal was to create a simple, quick, and precise screening tool for assessing literacy in higher education. After defining the construct of assessment literacy within the higher education context, we developed the test blueprint and items, and subjected them to a series of expert reviews. Following a pilot administration to confirm feasibility, we conducted item parameter calibration using a representative sample of faculty members (n = 211) selected through a convenience sampling approach. We evaluated the items for evidence of adequate psychometric quality, including fit, targeting, and unidimensionality under the Rasch framework. We concluded that developing an adaptive test for measuring assessment literacy is possible even with a small item pool and a small calibration sample.
Plain language summary
The primary aim was to develop a simple, quick, and precise screening tool for assessing assessment literacy in higher education. Despite having a small item pool and calibration sample, the study found that developing an adaptive test for measuring assessment literacy was feasible. The study finally addresses the practical implications of integrating adaptive assessment tools into assessment-related feedback systems, faculty development programs, and improving ongoing assessment literacy evaluations.
Keywords
Introduction
Assessment literacy (AL) represents a dynamic concept under ongoing evolution (e.g., with developments in artificial intelligence), with clear practical implications for higher education. In one of the broadest definitions, AL can be defined as “an individual’s understanding of the fundamental assessment concepts and procedures deemed likely to influence educational decisions” (Popham, 2011, p. 267). It can be summarized as an educator’s “technical knowledge and skills in assessment with substantial emphasis on psychometric principles and test design” (DeLuca et al., 2019).
High-quality professional development for faculty is crucial for building AL in higher education (Jankowski et al., 2018). Targeted professional development efforts in assessment literacy are essential to empower faculty to excel in their assessor roles because faculty members are more likely to adopt high-quality assessment practices when they have access to professional development opportunities tailored to their specific needs. The need for targeted professional development necessitates the establishment of clear definitions of the skills and knowledge required for effective assessment, alongside the development of psychometrically sound measures to track these competencies accurately. Unlike their counterparts in K-12 education, faculty members in higher education face unique challenges and requirements in assessment, which calls for the development of tailored tools and resources suited to their needs. Although many higher education institutions have implemented faculty development programs aimed at improving assessment practices, there remains a noticeable gap: the lack of a practical and reliable tool to measure assessment literacy among faculty members. This limitation poses challenges for creating data-informed professional development opportunities, which are critical for enhancing assessment effectiveness and ensuring faculty are well-prepared to handle evolving assessment demands (Robinson, 2020; Zhu & Evans, 2024).
Recent research emphasizes the importance of assessment literacy in higher education, highlighting its role in supporting student learning, academic success, and institutional quality (Valizadeh, 2019; Zhang, 2024). Although much of the existing literature has explored teachers’ assessment literacy in K-12 education (DeLuca, et al., 2019; Xu, 2024), fewer studies have examined this issue specifically within the context of higher education faculty (Jiang, 2019; Jin, 2010). This gap suggests the need for further exploration of how assessment literacy can be measured and supported in higher education settings, particularly as diverse and innovative assessment approaches continue to emerge (Chan, 2023; Weng et al., 2024).
Our study aims to address this gap by developing a feasible and reliable data collection tool to help gather evidence on faculty assessment literacy. Recognizing that this contribution will not fully resolve all of the challenges associated with faculty development, our goal is to provide a resource for guiding focused, data-driven professional development activities. By doing so, our work will complement ongoing efforts to improve assessment practices and faculty readiness in higher education, gradually contributing to the overall goal of enhancing student outcomes and institutional performance.
Literature Review
Computerized adaptive testing (CAT) is a method of test delivery that uses adaptive algorithms to tailor the testing experience to individual test takers. In a CAT system, the order in which items are presented and the point at which the test is terminated is determined by the test-taker’s performance on the previous items (Kozierkiewicz-Hetmańska & Nguyen, 2010). Compared to fixed-format testing, CAT results in shorter tests (Weiss & Kingsbury, 1984) with more accurate estimates (Thompson, 2011). CAT has been widely used for various high-stakes testing purposes, including certification, admissions, as well as low-stakes testing purposes, such as for K-12 progress monitoring (Gorgun & Bulut, 2023). In the realm of the behavioral sciences, researchers have adapted various scales and inventories for CAT environments, enabling quicker and more efficient administration (Forbey & Ben-Porath, 2007; Xu et al., 2020). Likewise, CAT has also been applied in the health sciences, as demonstrated in studies related to measuring depression (Devine et al., 2016), anxiety (Gibbons et al., 2008), emotion regulation (Xu et al., 2020), and schizotypal personality disorder (Li et al., 2021).
Thompson and Weiss (2019) presented a framework for developing and implementing CAT that includes several critical processes. First, the development of the item bank is essential to the effectiveness of the CAT procedure in offering shorter tests with precise results. The benefits of CAT depend on the quality of the item bank—necessitating a rigorous psychometric evaluation of the items. The next step involves determining the CAT specifications. Planning a CAT requires establishing the starting rule for the test, identifying the method for selecting subsequent items, selecting the method for estimating the test-taker’s trait or ability, and establishing the test termination rule. Researchers can use simulation studies to help identify effective CAT specifications for a particular context. Finally, launching the CAT and maintaining the item pool involves either commercial or open-source software solutions. After the CAT is administered and data are collected, it is crucial to assess the alignment between the simulation and empirical results. Maintaining the item pool necessitates ongoing analysis of item statistics and calibrating parameters for new items as they are introduced to the item pool.
The theoretical framework guiding our study draws from frameworks related to instrument development and validity in general and AL in particular. Successful test development begins with establishing a clear definition of the construct, which serves as the basis for creating a test blueprint to ensure that the item pool adequately reflects the full scope of the construct (Spoden et al., 2018). The development and validation of the assessment literacy item bank were guided by Messick’s (1989) Validity Framework, which emphasizes integrating the construct definition, test design, and score interpretation as part of an evidence-based validation process. Following this framework, we ensured that the test blueprint and item calibration aligned with established psychometric principles, reflecting both the content- and construct-related validity evidence for the instrument. In the current study, the initial phase of developing the test blueprint involved defining the AL construct among faculty members and identifying the specific competencies that should be measured. To the best of our knowledge, there was not an available AL diagnostic tool specifically designed for faculty in higher education. Given the wide range of disciplines, experiences, and types of skills faculty members assess, our approach to defining AL competencies was both inclusive and broad.
Our theoretical framework for assessing AL was influenced by pre-existing models developed by AERA et al. (2014), aiming to pinpoint general AL competencies. The research team reviewed these frameworks, making adjustments to better suit the context of higher education faculty. We adapted AERA et al. (2014) frameworks to suit the needs of faculty, resulting in five key domains: selecting assessment instruments, developing assessment instruments, administering assessments, scoring and analyzing results, and ensuring fairness. Given the diverse roles and responsibilities of faculty across disciplines, this adaptation process involved filtering competencies to ensure broad applicability across academic contexts. Additional contributions from Burrack and Urban (2014) on rubric development and assessment planning were incorporated into the framework, particularly related to designing and implementing assessments. Furthermore, Horst and Prendergast’s (2020) operational definitions informed the development of items related to collecting assessment outcomes, data analysis, and applying results to enhance learning. A detailed explanation of the five key domains, their subdomains, and the associated competencies is provided in the Appendix. These theoretical components guided the creation of the test blueprint and the development of items as well as examining validity of the score interpretations, ensuring comprehensive coverage of faculty assessment literacy. By aligning the framework with key stages of item development, calibration, and validation, we aim to provide a theoretically sound and practically relevant instrument for assessing faculty AL in higher education.
Rationale and Research Questions
The purpose of this study is to generate an item bank for assessing faculty members’ AL and to examine the applicability and feasibility of CAT for monitoring AL among faculty members in higher education. In developing this tool, our main goal was to create a simple, quick, and precise screening tool for higher education assessment. A major practical implication of this work is to incorporate AL-CAT as a component of faculty development programs in higher education institutions.
To address the development and evaluation of a computer-adaptive tool for assessing faculty members’ AL, this study is guided by the following research questions:
RQ1: To what extent does the CAT-based assessment of faculty members’ assessment literacy meet psychometric requirements within the Rasch model framework?
RQ2: How do the CAT simulation results support the efficient and accurate measurement of faculty assessment literacy, considering CAT item selection and stopping rules?
RQ3: How do faculty members perceive the feasibility and usability of the CAT-based measure of assessment literacy?
Developing and implementing an AL measure in a CAT format offers several significant advantages, making it a useful tool for higher education institutions. Importantly, CAT can offer a quick and effective screening tool for determining the AL needs of faculty members. Given the wide range of AL competencies and levels among faculty, a tailored approach to professional development is crucial. The adaptive nature of CAT allows for shorter testing times, which is particularly beneficial in a busy academic environment. Faculty can be quickly and accurately assessed, enabling institutions to identify specific areas where support is needed. This rapid screening process can help allocate professional development resources based on the specific needs of individual faculty members.
By using a CAT approach to evaluate AL, higher education institutions can provide customized resources that address individual gaps in AL. This approach has the potential to not only enhance the overall quality of assessment practices in general, but also foster a more supportive and responsive professional development environment. Ultimately, the adoption of CAT for assessing AL underscores a commitment to improving educational outcomes through targeted and efficient faculty development.
Method
Research Design
We used a Mixed-Methods, Multi-Stage Developmental Research Design (Richey & Klein, 2007) to systematically develop and evaluate our AL CAT. Specifically, we integrated quantitative (e.g., Rasch-based calibration, simulations, real test administrations) and qualitative (e.g., expert reviews) methodologies to ensure an evidence-based CAT system.
We used a structured, iterative approach in which we developed and refined an initial item bank through expert reviews and calibration studies. Following these steps, we used hybrid simulations to optimize item selection algorithms, exposure control, and test precision. Finally, we administered the CAT to real test-takers to evaluate it with respect to validity, reliability, and practical feasibility. The design adheres to principles of developmental research, which emphasize iterative refinement and empirical validation (Richey & Klein, 2007). The steps of the process in this study are illustrated in Figure 1. To further clarify the alignment between our research questions and the research procedures, the study addressed each question through separate methodological steps. RQ1 was addressed through Rasch-based item calibration and psychometric analyses of the item pool, including fit, dimensionality, and reliability assessments. RQ2 was investigated via hybrid CAT simulations that tested item selection and stopping rules to optimize efficiency and measurement accuracy. RQ3 was explored using data from a post-test feasibility survey, which gathered faculty members’ perceptions of the CAT format, its usability, and practicality.
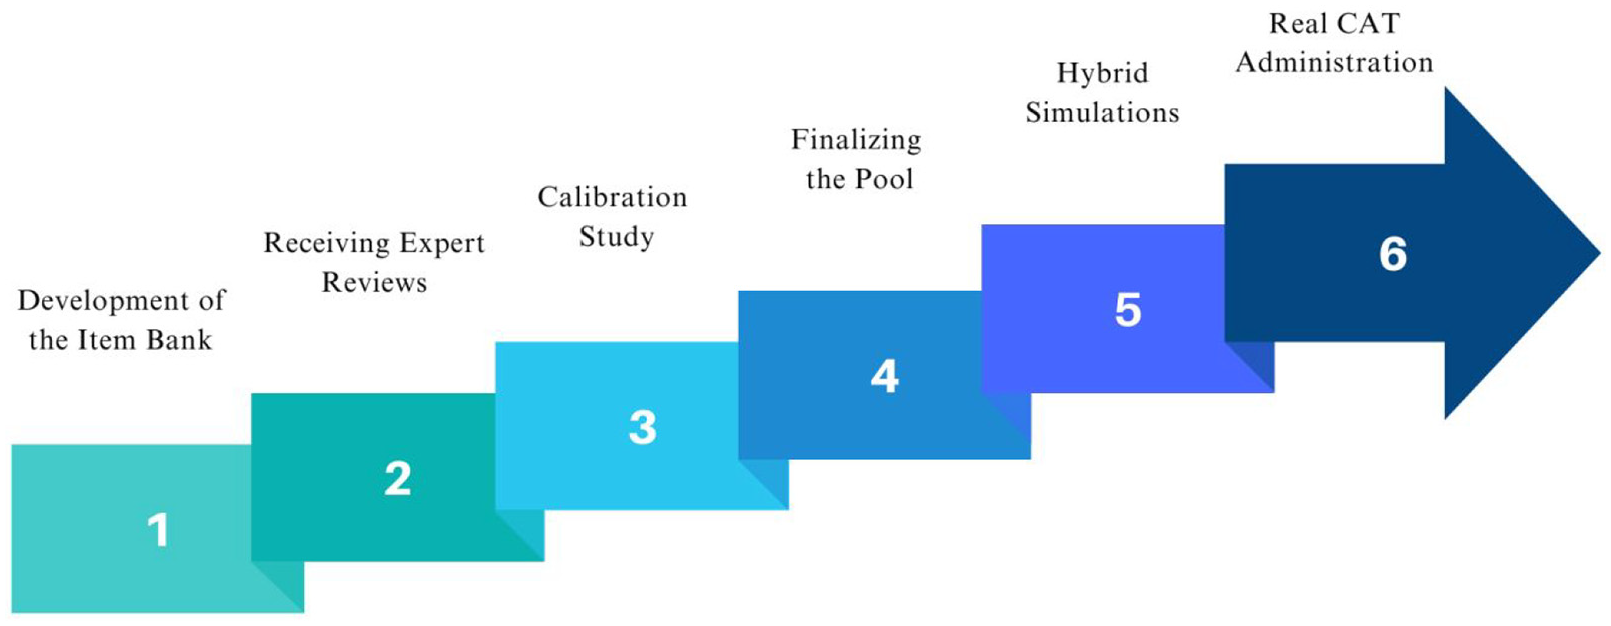
Steps of the research.
Sampling and Ethical Considerations
At each stage of this developmental research study, we aligned our sampling approach with the specific requirements of the research process. Our study was conducted at a public university, where Institutional Review Board (IRB) approval was obtained prior to data collection. Given that no sensitive personal data were collected, the study was granted exempt status under IRB guidelines. For the expert review stage, we used a convenience sampling approach, selecting two subject matter experts based on availability and expertise in the relevant domain. In subsequent stages, calibration and real CAT administration samples were also drawn using convenience sampling, with participants recruited via emails and professional listservs. All data were collected through a secure online platform, with access restricted to authorized researchers. Participants were informed about the purpose of the study, and consent was obtained where applicable. Identifiable data were not recorded, and all responses remained anonymous. These measures ensured adherence to ethical research standards while facilitating multiple data collection stages.
Development and Psychometric Evaluation of the CAT Item Bank (RQ1)
Given that faculty members come to the practice of assessment with varying levels of preparation, we designed our item pool to evaluate a range of skill levels. Item difficulty ranged from easy to complex, and the cognitive skills assessed varied from recalling to application, utilizing multiple-choice items. During the item writing phase, we generated assessment scenarios relevant to various fields to ensure the test’s relevance across a wide range of academic disciplines. The initial item bank consisted of 100 multiple choice items with a single best answer for each. Some items had 4 options while the majority of the items had 5 response options. Most items featured scenarios drawn from academic fields such as health sciences or engineering education as illustrated in the sample item shown in Table 1.
Sample Item.

Two content experts, who also specialize in measurement and assessment, evaluated each item against the following criteria: (a) Relevance to the construct definition and theoretical framework; (b) Accuracy of the item stem and options; and (c) Suitability of the item for diverse faculty profiles. Their evaluations were recorded using structured Excel sheets designed to capture both qualitative feedback and quantitative ratings on a scale from 0 to 5 for each domain. To ensure consistency and reliability in the item review process, Cohen’s kappa (κ) an inter-rater agreement coefficient was calculated for each of the five evaluation domains, providing a chance-corrected measure of the agreement between the experts’ ratings. Additionally, three online think-aloud sessions were conducted and recorded with faculty members. During these sessions, participants were asked to review the items while verbalizing their thought processes and reactions. This approach allowed for real-time observation of item interpretation and evaluation, offering qualitative insights into potential areas of confusion or misalignment. The inter-rater agreement coefficients, along with their average, minimum, and maximum values across the five domains, were as follows: 0.84 for construct relevance (min: 0.78, max: 0.89), 0.79 for scientific accuracy (min: 0.75, max: 0.83), 0.80 for clarity (min: 0.76, max: 0.85), 0.82 for faculty applicability (min: 0.77, max: 0.86) and 0.81 for cognitive demand (min: 0.78, max: 0.84).
These coefficients indicate substantial agreement between the experts, providing confidence in the consistency and reliability of the evaluation process. Qualitative feedback from the five evaluation sheets highlighted necessary revisions for 12 items. Common issues included ambiguous wording, which was refined to enhance clarity, and adjustments to the cognitive demand of items, ensuring that they aligned with the intended difficulty level and theoretical framework. Additionally, revisions were made to better accommodate diverse faculty backgrounds, including modification of examples or phrasing to increase accessibility. During three think-aloud sessions with faculty members, five items were flagged for potential misinterpretations. The think-aloud sessions provided real-time insights into how faculty understood and responded to specific items, further supporting refinements to wording and response options. Following these iterative revisions, the final set of 65 items was completed, ensuring that they met the study’s research objectives and evaluation standards.
Following this evaluative process, including revisions and removals, the final set of 65 final items were allocated to 3 separate forms (form A, B, and C), which were linked through common item equating. Each form included 5 items per content domain to ensure content balancing. The relevance of the scenarios and the targeted fields for each form, along with the number of individual and common items in each form, are detailed in Table 2.
Forms for Calibration Study.

Before proceeding to the calibration study, three faculty members from distinct academic backgrounds—specifically, one from social work, one from language and arts, and one from business—participated in a think-aloud session(van Someren et al., 1994) via Zoom (2023). We used these interviews to ensure that the items on each form were understood as intended. Participants’ thought processes and feedback were utilized in revising some of the items’ wording and the ordering of options. Following these adjustments, we initiated the calibration study.
Calibration Study
The linked forms were distributed in a computer-based, non-adaptive format using Qualtrics (2023). The objective of this phase was to calibrate item parameters according to the dichotomous Rasch model while also evaluating the fit of the data to model requirements. The calibration sample included 211 faculty members actively teaching at different higher education public institutions in the US. To ensure statistical stability in the analysis using the Rasch model (Linacre, 1994), a minimum sample size range of 16 to 30 respondents for the dichotomous model was established for each form. Each test form included responses exceeding the minimum value within this range, resulting in a total of 105 complete responses, after removal of missing/unreached data. The calibration sample characteristics are presented in Table 3.
Calibration Sample Characteristics.

Item Fit, Dimensionality and Targeting
The main purpose of this phase was to calibrate item parameter estimates for the operational CAT item bank based on a Rasch model. We selected the dichotomous Rasch dichotomous model (Rasch, 1960) for item parameter calibration due to its robustness to small sample sizes compared to other IRT models (e.g., De Ayala, 2009; Spoden et al., 2018). The Rasch model can be stated mathematically as:

where
In the Rasch measurement context, item fit analysis provides evidence related to the internal structure of an instrument, which has implications related to construct validity. Construct validity refers to the extent to which there is evidence that test scores reflect the theoretical construct that an instrument is intended to measure. By examining the fit of individual items to the Rasch model, we assessed whether the items were functioning as expected in relation to the AL construct. Misfitting items may indicate issues such as ambiguity, bias, or misalignment with the construct, which can undermine the validity of the score interpretations.
We analyzed participant responses to each test form with the dichotomous Rasch model using Winsteps version 5.7.3 (Linacre, 2024) via Joint Maximum Likelihood Estimation (JMLE). After parameter estimation, we conducted item fit analyses for each form individually and a combined form fit analysis for all data based on the linked forms through common item equating. Rasch model item fit statistics, specifically infit and outfit mean square error (MSE), provide insights into the consistency of item performance relative to the model’s expectations. Infit MSE is calculated as the mean of the standardized residuals weighted by statistical information (i.e., response variance) as follows:
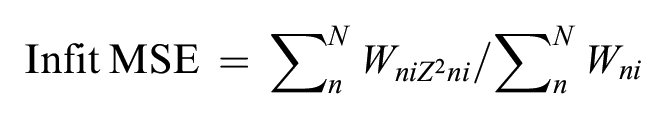
where

Infit MSE is sensitive to patterns among responses that are close to the respondent’s ability level, while outfit MSE is influenced by outlier responses, which might not be indicative of typical behavior (Wright & Masters, 1982). In our analysis, Outfit MSE was particularly useful for identifying items that may behave erratically and affect the reliability of test results. Consistent with the guidelines found in the literature (Müller, 2020), we flagged items with outfit MSE values exceeding 2.0 as potentially problematic since in a low-stakes assessment situation, extreme high values of MSE statistics (e.g., values greater than 2.0) are generally considered cause for concern (Linacre, 2012). In addition, several researchers have suggested that MSE values between 1.5 and 2.0 are unproductive for construction of measurement but may not be substantially degrading (Engelhard & Wang, 2020). Therefore, we focused on items with outfit MSE values greater than 2.0 as an initial indicator of severely misfitting items. Moreover, we considered the point-measure correlation, which indicates the extent to which an item discriminates between respondents along the trait being measured. A positive point-measure correlation suggests that the item appropriately differentiates between higher and lower ability levels, while a negative value could indicate that the item works contrarily to the trait being measured (Bond & Fox, 2013).
We assessed the structural validity of the instrument, which also fulfills the Rasch model requirement for unidimensionality, through Principal Component Analysis (PCA) of standardized residual correlations (Chou & Wang, 2010; Linacre, 1998). This approach involves first estimating item and person parameters via a measurement model, and then examining standardized residual correlations for evidence of potentially meaningful secondary dimensions after controlling for first component (the primary construct). In this application of PCA, eigenvalues are called “contrasts” because they reflect evidence of potentially contrasting dimensions. As a general guideline, researchers suggest interpreting eigenvalues greater than 3.0 (indicating the strength of at least 3 items) as evidence of potentially meaningful secondary dimensions. Conversely, an eigenvalue less than 3.0 may suggest that the observed contrast reflects random noise in responses rather than a meaningful secondary dimension (Linacre, 2002). We followed these guidelines as well as graphical exploration of person measure plots to evaluate adherence to the Rasch model unidimensionality requirement. We also utilized Steven’s (2002) guidelines as follows: a contrast with an associated eigenvalue greater than 2.0 may constitute a separate dimension if certain conditions are met: (a) a minimum of three items with absolute loadings on the contrast that exceed 0.8, (b) a minimum of four items with absolute loadings surpassing 0.6, and (c) a minimum of 10 items with absolute loadings greater than 0.4. To further provide unidimensional evidence, we utilized the Simulated Data (SD) function in Winsteps. The program offers two primary methods for simulating data: generating data probabilistically based on anchored parameter estimates and resampling with replacement from the existing dataset. For our analysis, we instructed the program to simulate a dataset using the estimated measures. This simulated, model-fitting data allowed us to test the unidimensionality of the item bank.
For reliability evidence, we utilized the calibration results. Specifically, the item reliability value is a crucial indicator of measurement precision, with low values (<0.7) suggesting a limited range of item measures (item difficulty variance) or an insufficient sample size to precisely locate the items on the latent continuum (Bond & Fox, 2013). Similarly, a person reliability value is used to evaluate measurement precision for test-takers (Linacre, 2023). A value that is greater than 0.7 is recommended to conclude that an assessment accurately differentiates between individuals with different ability levels. In addition, item reliability and separation values are used to verify the item hierarchy, which is an indicator of construct validity (Bond & Fox, 2013). According to Bond and Fox (2013), an item separation reliability value exceeding .8 is considered good and strongly acceptable. We also checked the item separation index to evaluate the reliability of the item hierarchy. According to Linacre (2005), a critical value exceeding 2.0 is considered satisfactory and indicative of an adequately distinct distribution of item difficulties across the continuum.
Lastly, we checked the targeting between the item pool and the examinees to determine if the test was appropriately calibrated and suitable for the adaptive algorithm. This algorithm requires both very easy and very hard items, but the mean difficulty of the items should be well-targeted to the examinees. In Rasch applications, researchers have recommended a general guideline of a maximum difference of 1.5 logits between person and item locations with dichotomous data (see Linacre, 1994 and Wright & Stone, 1979). Additionally, we conducted a visual inspection of Wright map, an output from the Rasch analysis software. The Wright map, or person-item map, is a graphical display that shows item difficulties and examinee abilities on a common same scale, providing a clear visual representation of how well the item difficulties are matched to examinee abilities. This visualization helps researchers identify any significant mismatches in the item difficulty spectrum and ensures that the test items are appropriately challenging for the intended population.
Evaluating CAT Efficiency and Accuracy Through Simulation (RQ2)
To optimize the efficiency of the CAT implementation, we conducted a series of hybrid simulations to determine the ideal termination and test-taker ability estimation rules for our purpose. We used hybrid simulations instead of post-hoc simulations due to the sparsity in our data matrix (Nydick & Weiss, 2009; Weiss & Guyer, 2012). In our hybrid simulation approach, we used participant responses provided from each form to predict their performance on unanswered items. Following Weiss and Guyer (2012), we applied Monte Carlo simulations to impute responses for missing and non-attempted items. Our hybrid simulation included eight unique CAT conditions, involving a combination of four termination rules and two estimation rules, with the initial item selection rule and the procedure for selecting subsequent items held constant across all scenarios. We used ten replications for each conditions, and averaged the results over these replications. Using the CATSIM software (Weiss & Guyer, 2012), we initiated each simulation by specifying a baseline ability level of zero for examinees and selecting items through a randomesque procedure. We used two methods to estimate test-taker ability (i.e., theta): Maximum Likelihood Estimation (MLE) and Bayesian Expected a Posteriori (EAP). We selected these methods because of their robust theoretical foundations and practical utility. Specifically, MLE is particularly effective when the sample size is large, as it maximizes the likelihood function to estimate the most probable ability level given the observed responses (Hambleton et al., 1991). We also used Bayesian EAP in the simulation design due to its ability to incorporate prior knowledge about the distribution of abilities. This leads to more stable estimates, particularly in cases with small sample sizes, making it suitable for adaptive testing environments (Bock & Mislevy, 1982; Segall, 1996; van der Linden & Pashley, 2010).
We considered a variety of test termination strategies, including fixed-length CATs with 10 and 15 items. To explore a variable-length approach, we also considered a standard error of measurement (SEM) termination rule with thresholds of SEM < 0.3 and SEM < 0.4. To determine the optimal specifications for the AL-CAT, we assessed both the mean test length and the mean theta difference, as well as the standard deviation of the theta difference for each simulation condition. We calculated theta difference values by comparing the theta estimates produced by the CAT with the theta values derived from the entire item bank. Because our primary goal was to create a quick screening tool for evaluating overall proficiency in AL, we emphasized minimizing test length over minimizing error in estimation. To test the main effects, we estimated factorial ANOVA models to understand the effect of independent variables, namely estimation rule and stopping rule, on test length.
Faculty Perceptions of CAT Usability (RQ3)
After determining the most effective CAT specifications for our objectives based on the simulations, we extended a second invitation to faculty members to participate in the CAT session delivered via the FastTest adaptive testing platform (Assessment Systems Corporation, 2024). Given the six-month interval between the fixed-format and CAT administrations, and the use of different set of items to each faculty member in the CAT, the potential for item memorization was minimal. To assess differences in the average number of items presented and the time expended and given the low-stakes nature of our CAT, we implemented a stopping rule of SEM < 0.4 for half of the participants (as the simulations suggested), while the remainder concluded when SEM < 0.5. Our preliminary results from the SEM < 0.4 condition revealed that most tests concluded with SEM values lower than what we observed in the initial stages, prompting us to explore the SEM 0.5 threshold for the other half of our sample, aligned with results from previous research on low-stakes CAT (Ferrando, 2003; Zhang et al., 2019). This methodology not only allowed us to evaluate the efficiency of our testing in terms of duration and the length of the test, but also allowed us to navigate the trade-offs between precision and practicality. By anchoring our decisions in both simulation-based and empirical evidence as well as previous research, we aimed to find a balance that considers the aims of low-stakes testing and CAT. Following the AL-CAT session, participants completed a brief feasibility survey via Qualtrics, enabling a comparison of their experiences with the CAT versus the traditional fixed-format assessment.
Results
RQ1: Psychometric Evaluation of the CAT Item Bank
We conducted item fit analysis separately for each form to identify potential misfitting items. Items failing to meet the fit criteria within a specific set were consequently excluded from consideration in the overall analysis (Bond & Fox, 2013; Linacre, 2002). Across all three forms, 65 items yielded positive Point Measure Correlation (PTMEA) values, suggesting a positive correlation between item difficulty and respondent ability. Our fit analysis identified three items that did not meet the specified criteria based on high outfit MSE values. Given the relatively small size of our item pool, we exercised caution in excluding items, emphasizing a careful approach supported by a limited calibration sample. To inform our decision-making process, we drew upon multiple sources of evidence, including quantitative results and expert opinions accompanying the fit results. Specifically, we solicited feedback from measurement and content-area experts about the item-level results. Specifically, a panel of three experts evaluated the three items with relatively high outfit MSE values. The MSE values for the remaining items did not exceed 2.00. Table 4 displays the model-data fit indicators and expert judgment results for these three items.
Evaluation of Removal of the Items.

After expert evaluation of the misfitting items in the individual forms, we analyzed the combined forms, which were linked through common items. Analysis of outfit MSE values indicated that only items 216 and 35 exhibited values slightly above 2.0 (2.07 and 2.06, respectively). After a thorough evaluation and considering their positive point-measure correlation values, we decided to retain these items in the item pool. This decision was based on their potential value given the low-stakes nature of the assessment and the small size of the CAT item pool.
Table 5 illustrates the outcomes of the Rasch PCA conducted on the AL item bank while Table 6 shows the PCA results for the Rasch-fitting simulated data. For the AL item bank, the Rasch measures accounted for 34.6% of the variance observed in the scores. We interpreted eigenvalues for the contrasts using guidance from Stevens (2002), as discussed earlier. Based on these criteria, we concluded that the AL item pool exhibited sufficient evidence to support a unidimensional interpretation. Using the estimated item measures, we conducted a simulation to inform our interpretation of the dimensionality assessment results. In the Rasch-fitting simulated data, the Rasch dimension explained 40.5% of the variance. This investigation revealed that the variations in the data, as produced by the Rasch model, align with the anticipated values derived from the simulated data. The unexplained variance in the first contrast (4.4%) remains well below the 10% threshold (as cited in Shaw & Zhang, 2021), supporting our conclusion of no significant secondary dimensions. As Linacre (2011) explains, the degree to which multidimensionality is concerning depends on the test’s purpose. While our item bank covers various aspects of assessment literacy, it is designed to measure a general construct rather than separate subskills. The close match between the empirical (4.4%) and simulated (4.5%) first contrast variance further suggests that any residual variance is likely measurement noise rather than a competing latent trait. These results confirm that our instrument meets the unidimensionality requirement necessary for assessing faculty assessment literacy using a Rasch model approach. The substantial proportion of variance explained by the Rasch dimension in both the real and simulated datasets suggests that the generated item bank remains adequately unidimensional. Together, this collection of evidence supports adequate unidimensionality of the item pool, affirming its suitability for assessing broad AL skills for faculty.
PCA Results on the AL Item Bank.*
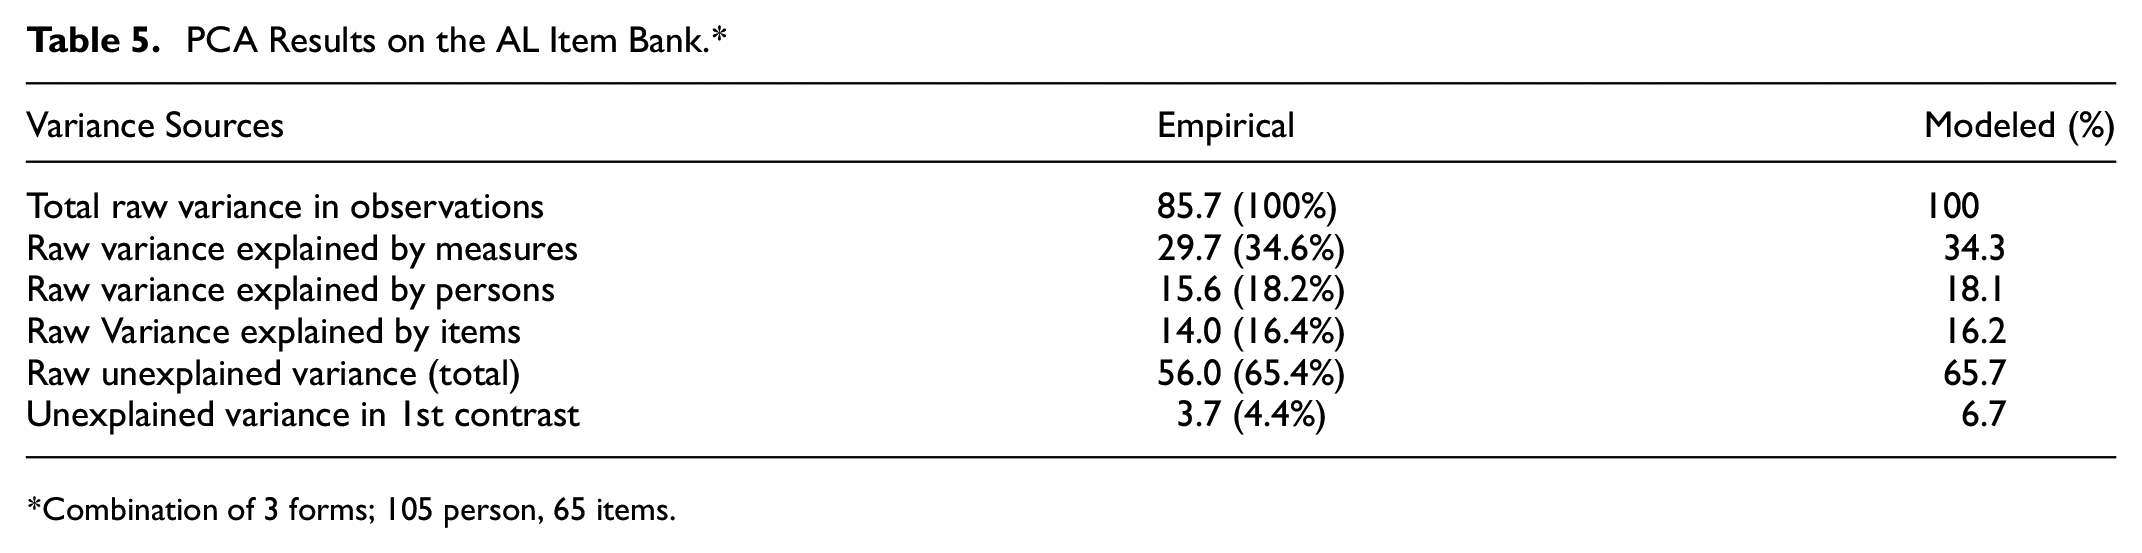
Combination of 3 forms; 105 person, 65 items.
PCA Results With Rasch-Fitting Simulated Data.*
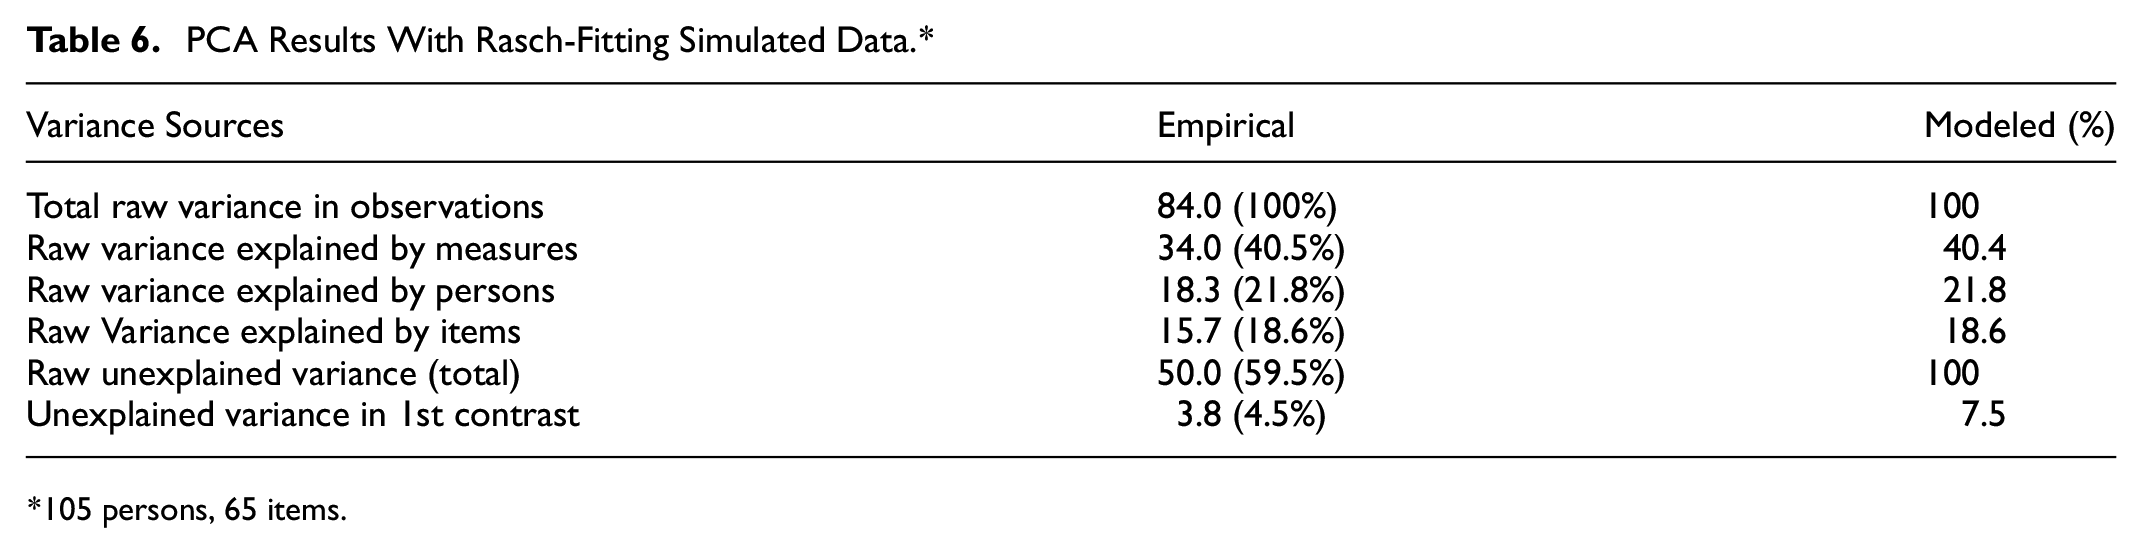
105 persons, 65 items.
As shown in Table 7, the item reliability estimate was .86, and the item separation estimate was 2.45; these results support interpreting the hierarchy of item difficulty values from our analysis.
Item and Person Fit Statistics.

Lastly, we inspected targeting between items and persons. Both visual inspection of the Wright map (see in Figure 2) and analysis of numerical values indicate that the CAT item pool was well-targeted to the examinee population. The mean examinee ability of 1.5 logits was slightly higher than the mean item difficulty of −0.19 logits (SD: 2.09, min: −4.08, max: 8.06), suggesting a good match in the context of a CAT application. The relatively wide spread in item difficulties compared to examinee abilities ensures a broad range of assessment, but also indicates potential areas for optimization, such as introducing more challenging items. Overall, these results suggest that the current item pool effectively covered the range of abilities present in the examinee population, providing a robust CAT administration.
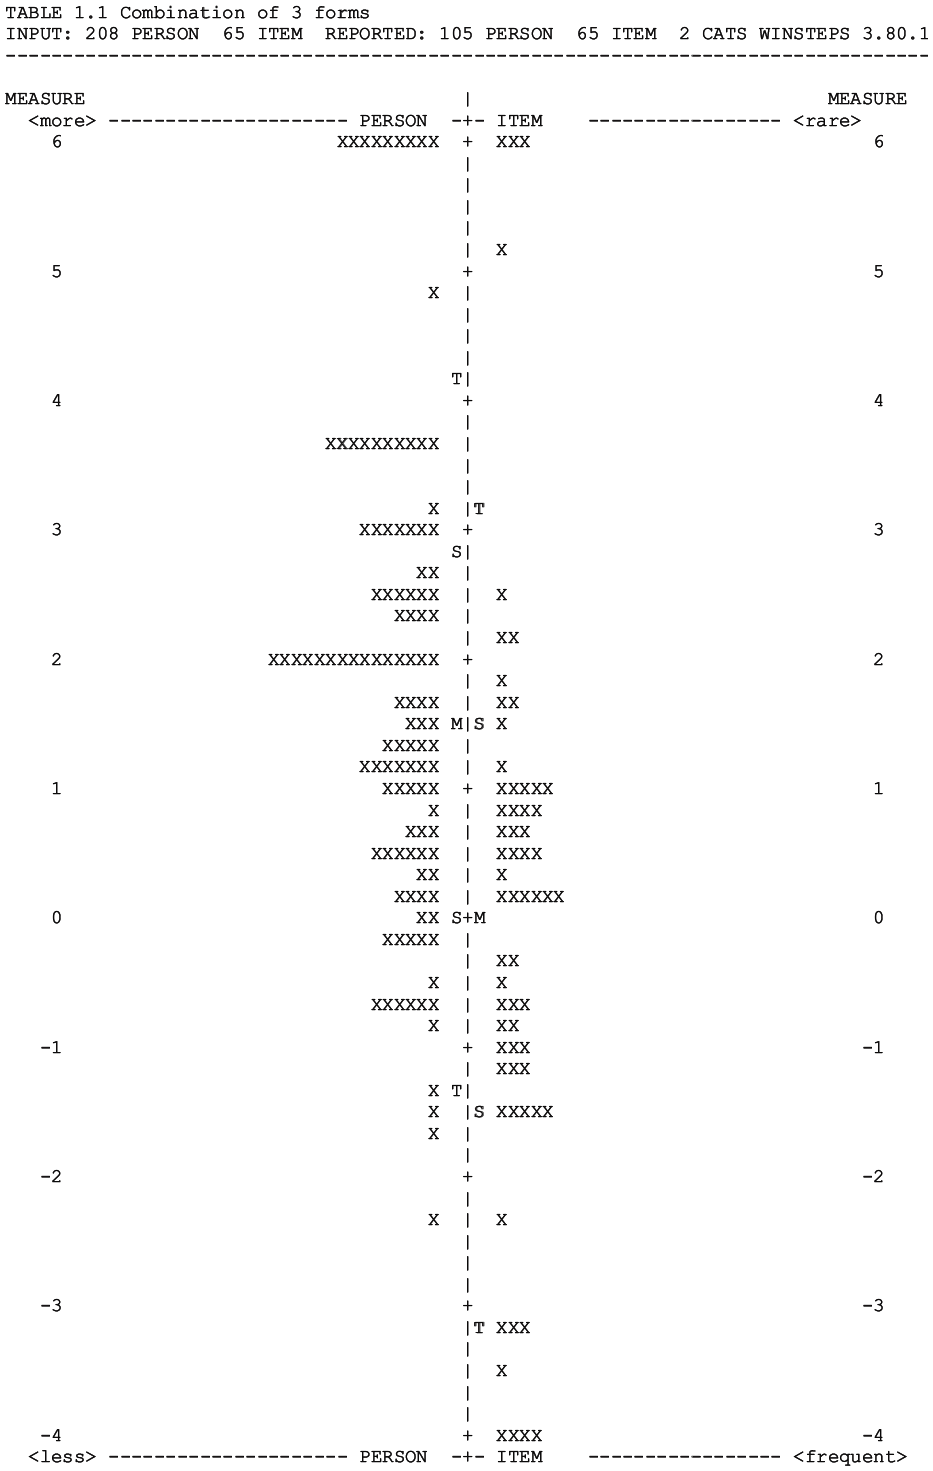
Wright map.
RQ2: Findings From CAT Simulation Analyses
The hybrid simulation results that considered both test duration and the variance between estimated abilities from the full item bank and the CAT revealed key insights. First, the SEM < 0.4 stopping rule significantly reduced the length of the tests compared to the SEM < 0.3 and 15-item stopping rules. However, this stopping rule also resulted in longer tests than the 10-item rule. Regarding the differences in theta and standard deviation of the mean theta difference, we did not identify statistically significant differences among the various SEM stopping rule conditions, although they consistently surpassed the fixed item test conditions in performance. Table 8 provides descriptive statistics related to these results.
Hybrid Simulation Descriptive Statistics.

Based on the results from the factorial ANOVA and the descriptive statistics, we selected the MLE method for the CAT system. The ANOVA results indicated no significant difference in test length between the MLE and Bayesian EAP estimation methods (mean difference = −0.0230 logits, p = .999, Cohen’s d = −0.00230). Additionally, both methods demonstrated similar levels of bias and precision under the SEM < 0.4 stopping rule, with MLE showing a mean theta difference of 0.13 logits (SD = 0.34) compared to EAP’s mean theta difference of −0.12 logits (SD = 0.35). Given these comparable results and the computational simplicity and broader software support for MLE, we determined that MLE was a more efficient and practical choice for our CAT system. This result suggests that we can maintain optimal test lengths and precise ability estimates, enhancing the overall effectiveness of our testing process.
RQ3: Faculty Perceptions of CAT Feasibility and Usability
The average number of items administered by the CAT to each participant is a critical measure of the test’s adaptivity and efficiency. Accordingly, we compared the average test length between the two SEM-based termination criteria, SEM < 0.4 and SEM < 0.5. The administration details are presented in Table 9.
Pilot CAT Administration Details.
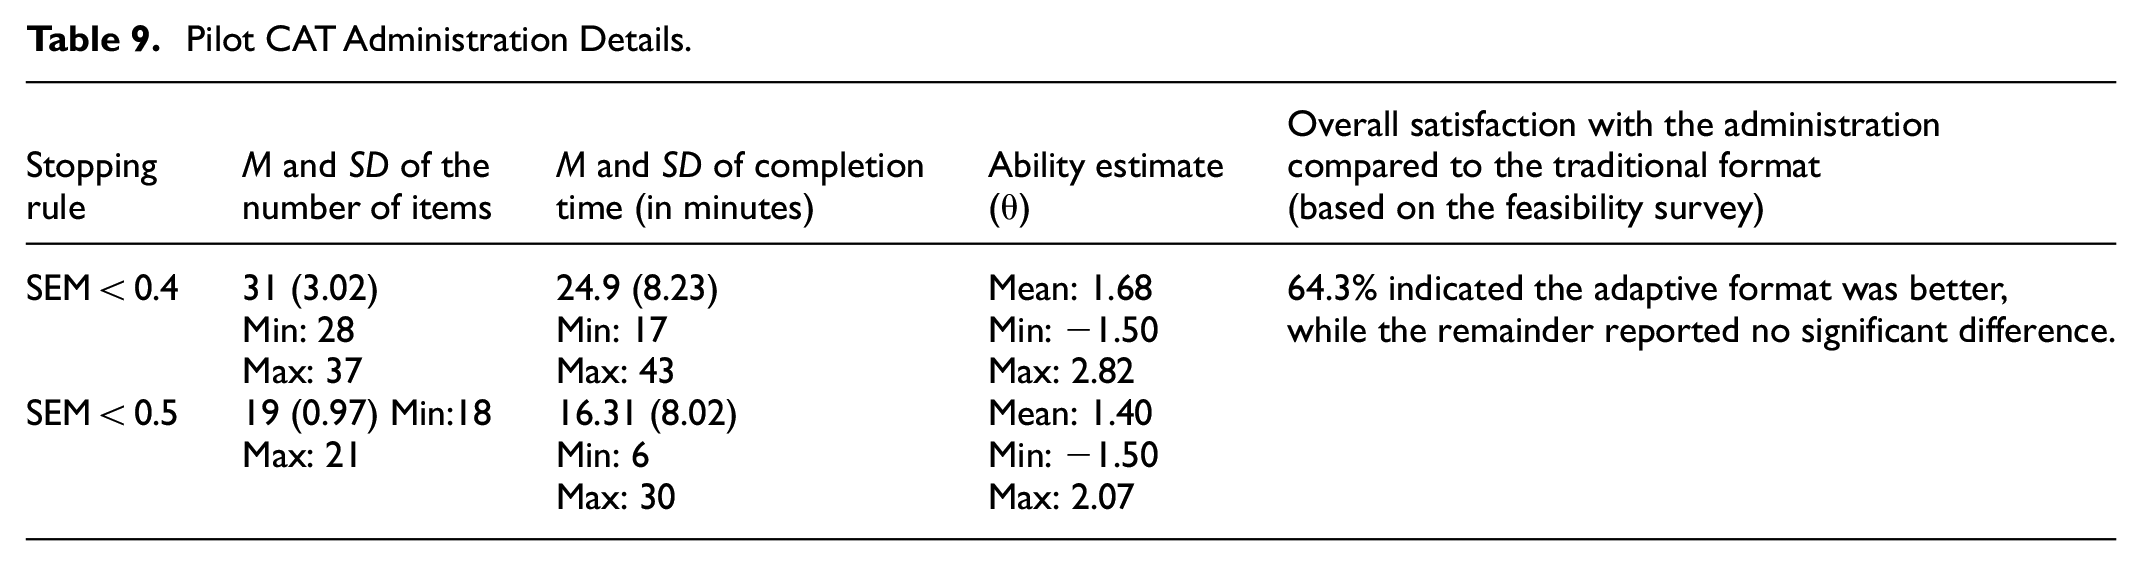
The mean examinee ability estimate (θ) for the SEM < 0.4 stopping rule was 1.68 logits, with a range from −1.50 logits to 2.82 logits. This range of values indicates that the CAT system was able to assess a wide range of abilities. The SEM < 0.4 rule used an average of 31 items per test, taking approximately 24.9 min to complete. The administration time varied between 17 and 43 min. For the SEM < 0.5 stopping rule, the mean examinee ability estimate (θ) was slightly lower (M = 1.40), with a range from −1.50 logits to 2.07 logits. This stopping rule required fewer items, averaging 19 items per test, and had a shorter average completion time of 16.31 min. The completion time ranged from 6 to 30 min, demonstrating efficiency in test administration duration. Overall, both stopping rules provided efficient assessments, with the SEM < 0.4 rule offering a more detailed evaluation at the cost of longer test times, while the SEM < 0.5 rule provided quicker assessments with fewer items.
After each examinee concluded their test, their theta score was converted to a standardized t-score, and they received feedback based on the interval in which their score fell. We established these intervals in accordance with a normal distribution using the following criteria: scores below 40 suggest that examinees should focus on mastering fundamental assessment concepts, scores between 40 and 50 indicate a satisfactory baseline with an opportunity for refinement, scores between 50 and 60 demonstrate a solid foundation in assessment concepts, scores between 60 and 70 suggest a good understanding with room for deeper insight, and scores above 70 suggest a very strong understanding of assessment.
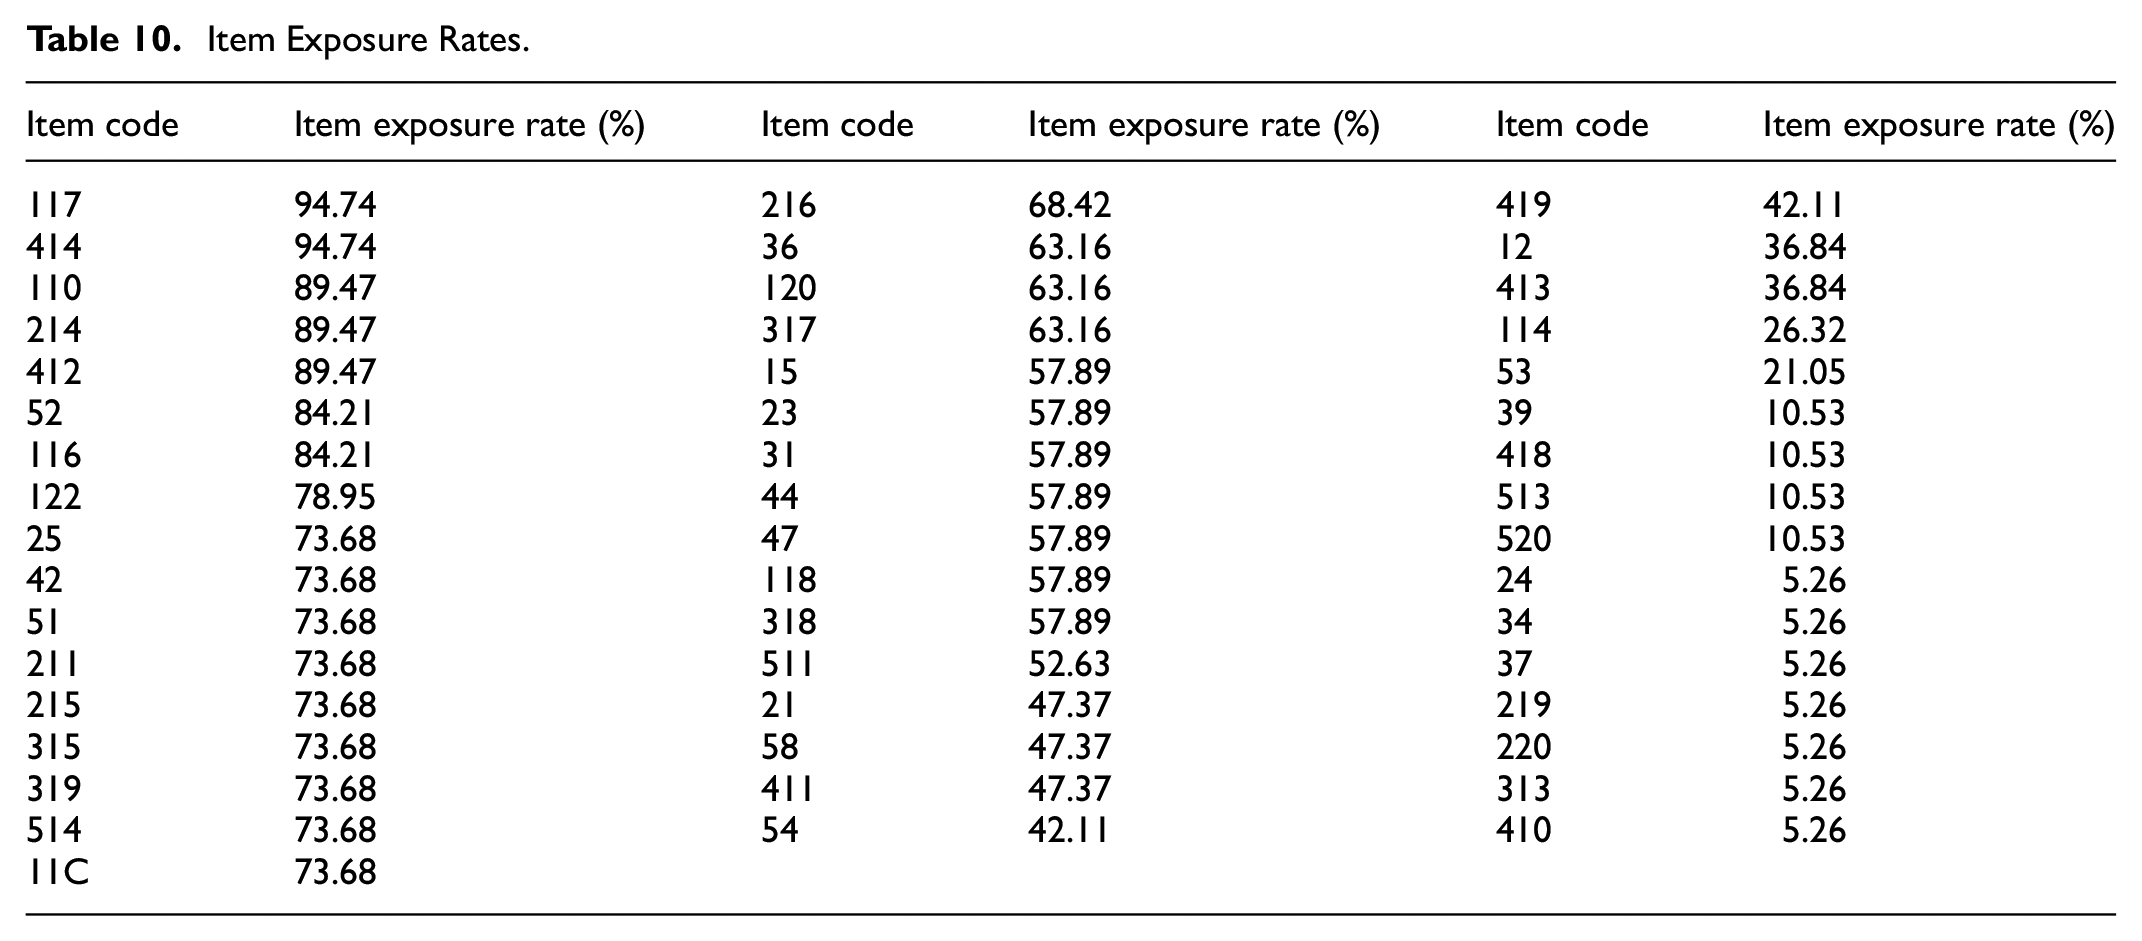
We calculated item exposure rates for each item within the test bank, aiming to identify patterns of over- or under-utilization. The detailed breakdown for each item is presented in Table 10. Several patterns are evident. Items such as 117 and 414 have very high exposure rates (nearing 95%), indicating frequent selection. Although such rates may suggest these items are well-suited to the common ability range among test-takers, they may also pose risks related to test predictability and security in high stakes testing conditions. Moderately exposed items such as item 216 and item 317, with exposure rates between 50% and 68%, suggest a balanced use that adequately targets middle ability levels without becoming overly predictable. Finally, items such as item 410 and item 313 show very low exposure rates around 5%. These low values could indicate that these items were too easy or too difficult for most test-takers.
Item Exposure Rates.
Lastly, in our feasibility survey to evaluate participant experiences with the adaptive test format, a significant majority expressed positive feedback. Specifically, 57% of participants agreed that they were satisfied with the length of the adaptive test compared to a traditional fixed form, highlighting its efficiency. This same percentage (57%) also reported feeling more engaged with the adaptive test, suggesting that the dynamic nature of the test format was more captivating. Moreover, 64% of the participants felt that the adaptive format presented questions that were more relevant to their expertise, indicating a higher perceived personalization and relevance of the content. These findings suggest that the adaptive test format not only enhances engagement but also aligns better with the individual’s specific assessment knowledge, potentially leading to a more effective assessment experience.
Discussion
This manuscript described a pilot study in which we developed a CAT system for AL and explored the effectiveness of a low-stakes CAT for measuring AL among higher education faculty. Our analysis focused on several key aspects: item bank development and calibration, hybrid simulations for determining CAT specifications such as stopping rules, and administering a live CAT to gather participant feedback on the adaptive test format. Our findings highlight several strengths and areas for potential enhancement in our current CAT system.
As a foundational stage of the study, the item bank development and calibration process (RQ1) were critical for ensuring measurement accuracy and maintaining a functional item pool for subsequent CAT administrations. Given the low-stakes nature of the assessment, we used a threshold of outfit MSE > 2.0 for item fit analysis to allow for greater item inclusivity and construct representation. This decision aligns with previous research suggesting that flexible MSE thresholds are acceptable in low-stakes testing, as they support broader coverage of examinee abilities without compromising test validity (Bond & Fox, 2013; Linacre, 2002). Our results contribute to the ongoing discussion on optimizing CAT systems with small item pools, which is a recurring challenge in educational measurement.
One of the practical challenges in CAT development is the extensive workload involved in writing and testing new items. Whenever feasible, researchers and practitioners rely on pre-existing item pools, but access to these pools is often restricted due to usage rights (Spoden, et al., 2018). In this study, it was necessary to develop a new item bank to ensure alignment with our definition of the AL construct. The findings highlight the importance of balancing item quality with practical constraints in item development, particularly in specialized assessment domains. At this point, the role of expert judgment in item selection emerged as a key factor. Experts carefully evaluated items with relatively high MSE values, focusing on their point measure correlation values and overall contribution to the item bank. This balanced approach—which integrates quantitative psychometric indicators with qualitative expert evaluation—is consistent with best practices in test development (Downing, 2006; Haladyna, 2004). These findings emphasize the importance of combining statistical and domain expertise when designing adaptive assessments in emerging research areas like AL in higher education. One of the central findings of this study pertains to the selection of stopping rules, a crucial aspect of CAT administration. We found that the SEM < 0.4 stopping rule provided a balanced trade-off between test length and measurement precision, reducing test length while maintaining accuracy. Comparatively, the SEM < 0.5 stopping rule resulted in a more efficient but potentially less precise assessment, a well-documented trade-off in adaptive testing research (Flens et al., 2022; Tian, 2018).
Moreover, our findings align with recent research indicating that small item pools can support satisfactory performance in low-stakes CATs, particularly when examinee targeting is adequate and a variable-length test with a standard error stopping rule is implemented (Aksu Dunya & Wind, 2025). Despite our relatively small item pool, the spread of item difficulties effectively covered the range of examinee abilities, ensuring adequate differentiation among participants. This finding is especially relevant for higher education context, where faculty members have diverse levels of AL and require a broad range of item difficulties to capture individual differences effectively.
Additionally, our analysis showed that the spread of item difficulties exceeded the range of examinee abilities. This difference was useful in our application, because it enhanced the CAT’s ability to accurately assess individuals at varying proficiency levels. Given the diverse levels of AL among faculty members, including both very hard and very easy items ensured plausible measurement precision across ability levels. These results align with prior research on item exposure control in adaptive assessments, which highlights the risks of overusing certain items in small item pools (Georgiadou et al., 2007). However, our findings suggest that even with a relatively small item pool, issues of item over exposure were successfully handled, supporting the feasibility of implementing small-scale CAT procedures in specialized domains.
Beyond psychometric considerations, participant perceptions provide practical additional validity evidence related to the practical implementation of the CAT in our context. Our findings showed that participants generally favored the adaptive test structure, expressing high satisfaction with test length and engagement. This finding aligns with those from previous studies suggesting that CAT enhances engagement due to its dynamic and tailored nature (Linacre, 2000; Mead & Drasgow, 1993; Wainer, 2000). In contrast, a meta-analysis by Akhtar et al. (2023) found no overall difference in motivation or anxiety between CAT and fixed-item tests (FIT), except when CAT was designed to be easier, leading to a more positive experience. Given the low-stakes nature of our CAT, this finding is particularly relevant, as reduced pressure may have contributed to the positive participant experience observed in our study. Overall, while our results reinforce the potential of CAT for faculty assessment literacy evaluation, they also highlight the importance of test design elements that influence psychological responses, such as perceived difficulty and test stakes.
Practical Implications
This study provides key insights into higher education assessment practices, particularly related to measuring AL among higher education faculty. Our findings indicate that small-item-pool CATs can function effectively in low-stakes environments when appropriate CAT specifications and expert judgment in item development are applied. This finding has direct implications for academic institutions, professional development programs, and faculty assessment bodies. The developed AL framework and modeled-CAT procedure can serve as a flexible assessment resource, functioning as either an adaptive testing tool or a source of fixed-item test samples for faculty evaluations, training programs, and self-assessment initiatives (Horst & Prendergast, 2020). Institutions can integrate this assessment framework into their faculty development programs to better understand faculty AL levels and tailor training accordingly.
Additionally, the study emphasizes the importance of enhancing CAT feedback systems. In this study, test-takers received generic feedback based on estimated ability levels at the end of the test administration. Future implementations should explore machine learning-powered adaptive feedback systems to deliver personalized insights and targeted recommendations, further aligning the test with learning and professional development goals. This improvement would benefit universities, accreditation bodies, and faculty training organizations by providing a more comprehensive and supportive assessment environment that fosters continuous professional growth.
Limitations
Our study has several limitations that should be addressed in future research. First, while teachers’ AL has been discussed and measured in prior studies, to our knowledge, this is the first study to focus on faculty members in higher education. We encountered resistance from participants regarding the necessity of measuring their AL. Overcoming this resistance required considerable effort, and it may have influenced the study’s outcomes.
Second, item pool calibration typically requires a large sample size to effectively utilize IRT models. Our study was limited by a smaller sample size, which led us to use a Rasch model approach. Future studies may benefit from calibrating the item pool using larger samples with the 2PL or 3PL models (Birnbaum, 1968). Lastly, the size of our item pool could be improved by including more items at both the high and low ends of the difficulty spectrum. Expanding the item pool with additional difficult and easy items would enhance the CAT system’s ability to accurately assess the full range of examinee abilities, particularly in diverse higher education contexts. Addressing these limitations in future research will help to refine the assessment tool and ensure more comprehensive and accurate measurements of faculty assessment literacy.
Footnotes
Appendix
Author Contributions
The corresponding author conceived and designed the study, secured funding, and conducted the primary data collection. The second and third authors contributed to data analysis and interpretation. All authors were involved in drafting and revising the manuscript and approved the final version for submission.
Funding
The authors disclosed receipt of the following financial support for the research, authorship, and/or publication of this article: This research was supported by the Scientific and Technological Research Council of Türkiye (TÜBITAK) to conduct the study at a research site in the United States.
Declaration of Conflicting Interests
The authors declared no potential conflicts of interest with respect to the research, authorship, and/or publication of this article.
Data Availability Statement
The dataset analyzed during the current study are available from the corresponding author on reasonable request.