
Abstract
As considered one of the most important sustainable transportation, the development of urban rail transit has been thriving over the last decade, especially in the densely populated cities. Using an accurate measurement tool to find out the shortage factors in the rail transit service is the vital prerequisite for improving the services, increasing ridership, and implementing the sustainable transport policy. The purpose of the study is to use structural equation model (SEM) to assess the important dimensions of service quality and customer satisfaction on rail transit passengers’ reuse intention. Data are collected from a questionnaire survey and an empirical study is conducted by using SEM to test the hypotheses, as well as the structural relationships among these factors. The results of the empirical study confirmed that service quality can be conceptualized as functional service quality, technical service quality, comfort and cleanness, and service planning and reliability. And it has positive effect on reuse intention by enhancing customer satisfaction, as customer satisfaction has intermediary effect on passengers’ repurchase intention. This study contributes to transport agencies for analyzing the relationship between service quality attributes and passengers’ reuse intention for improving the supplied service, increasing the ridership, and implementing the sustainable transport policy.
Keywords
Introduction
The heightened popularity of sustainability issues, sustainable transportation in particular, has led to the booming of urban rail transit in many high-density cities. Given many advantages such as high transport capacity, safe and punctuality, and low energy consumption (Canming & Jianjun, 2011), urban rail transit has been considered as one of the most important sustainable transportation by the authorities and researchers to overcome the problems of traffic congestion, environmental pollution, and energy shortage caused by the rapid urbanization and popularization of private cars (Aydin et al., 2015; Givoni & Banister, 2012; Holmgren, 2007; Özgür, 2011; Scherer, 2010). Therefore, there is a growing preference to switch over to urban rail transit in many countries of the world.
With the largest population in the world, China has experienced serious traffic congestion in many mega cities following its rapid urbanization in recent years (Sun et al., 2015). This has stimulated government administration to establish sustainable transport policies and adopt urban rail transit as a tool to attract people to use. A variety of approaches have been used by the transport agencies and planners to improve the service quality according to passengers’ needs, such as increasing investment in public transport, assessing the current passenger satisfaction, and finding out the deficiency to overcome. Despite this, it still has not come up to the expectation of passengers in delivering service (Pan et al., 2010). Urban rail transit operation companies in China also lack the accurate measurement tool to find out the shortage factors in their product service, which is the vital prerequisite for improving the services, increasing ridership and implementing the sustainable transport policy. There are abundant studies on passengers’ service quality in developed countries (de Oña et al., 2014; Eboli & Mazzulla, 2012; Hassan et al., 2013). Most relevant literature comprises case studies and passengers’ questionnaire survey, which identified critical factors and provided useful advice through different perspectives (Eboli & Mazzulla, 2011; Nathanail, 2008). But limitations exist with regard to the high-density population environment in China. For example, the total population of Beijing reached 21.5 million in 2018 (National Bureau of Statistics of the People’s Republic of China, n.d.), which is almost the same as the total population of Australia. In comparison with Western countries, there is diverse national conditions in terms of socioeconomic and population aspects. Therefore, the models developed in Western countries need to be validated across different countries (Tandon et al., 2017). To fill this gap, this article attempts to use structural equation model (SEM) to examine the important dimensions of service quality that lead to passengers’ reuse intention and customer satisfaction in China. A better understanding of the relationship will inform decision-making of future rail transit service and the implementation of sustainable transport policy.
This article is structured as follows. Section “Literature review and hypotheses development” reviews the related studies and develops the hypotheses. Section “Research methodology” addresses the research methodology and the results are then provided in section “Results.” Section “Discussion” describes the discussion of the findings. Conclusions are drawn in section “Conclusion.”
Literature Review and Hypotheses Development
Service Quality, Customer Satisfaction, and Reuse Intention in Public Transportation
Service quality is the provision of service that can meet the expectations of customers (Reeves & Bednar, 1994). Parasuraman et al. (1988) had defined service quality as “function of difference between service expected and customer’s perceptions of the actual service delivered.” A number of researchers have pointed out that service quality leads to customer satisfaction (de Oña & de Oña, 2015; dell’Olio et al., 2010). Service quality is perceived as an overall quality of travel behavior according to passenger’s viewpoint. Therefore, many researchers pay attention to evaluate the service quality of public transport and explore which aspects of the service are preferred by the passengers. de Oña et al. (2016) proposed that the quality of service was a key element to attract people to use public transport. Nathanail (2008) proposes a multicriteria evaluation framework for measuring the quality of service for passengers on Hellenic railways. Cavana et al. (2007) extended the SERVQUAL instrument to assess the quality of passenger rail services in Wellington, New Zealand by adding three more dimensions of comfort, connectivity, and convenience. A stated preference test to measure the service quality of public transport can be found in Eboli and Mazzulla (2008). Geetika and Shefali (2010) emphasized that availability of transit service, service monitoring, travel time, safety and security, and maintenance and construction activity on passenger trips are important dimensions of railway service quality. de Oña et al. (2015) stated that service quality is a measure of safety, cleanliness, comfort, information, and personnel. Machado-León et al. (2017) accentuated the role of availability, accessibility, information, time, comfort, and safety in service quality. Isikli et al. (2017) found waiting time, crowdedness in cars, and fare as important dimensions of rail transit service quality.
Customer satisfaction is the overall emotional response of customers to a perceived difference between prior expectations and perceived performance after consumption (Oliver, 1980). Generally speaking, customer satisfaction depends on the quality of the service provided (Anderson & Sullivan, 1993). del Castillo and Benitez (2013) found time satisfaction, comfort, accessibility, connectivity, and information as important factors of customer satisfaction. It is important to identify which factors of service quality have the important effect on customer satisfaction. A study by Shen et al. (2016) showed that safety and security were the most important factors that influence the passengers to use the urban rail transit in Suzhou. Canming and Jianjun (2011) studied the mediating role of customer satisfaction between service quality and customer loyalty, and the results showed that service quality had a direct effect on customer satisfaction and an indirect effect on customer loyalty for Nanjing–Shanghai high-speed rail. There is a notable relationship between service quality and customer satisfaction, and it affects the passengers to use the urban rail transit (Celik et al., 2014; Diana, 2012; Yilmaz & Ari, 2017). In this article, functional service quality, technical service quality, comfort and cleanness, and service planning and reliability are used as indicators of service quality because when passengers use the urban rail transit, these factors may be well distinguished.
In the past few years, reuse intention has received much attention from researchers and it is widely used in models related to customer loyalty. de Oña et al. (2015) pointed that positive customer satisfaction are directly related to customer reuse intention. Jen et al. (2011) examined the relationship among service quality, satisfaction, perceived value, and passenger reuse intention. The results showed that customer satisfaction is the bridge between service quality and passenger reuse intention, meanwhile perceived value is the most important predictor of passenger reuse intention. Yilmaz and Ari (2017) tested the relationships among service quality, image, satisfaction, complaints, and passenger reuse intention, and the results found significant effect of service quality and corporate image on customer satisfaction, which lead to the loyalty of passengers. J. S. Chou and Kim (2009) in their study found that service quality had a positive impact on customer satisfaction, and it had a significant impact on future reuse intentions. Shen et al. (2016) concluded that service quality is an important factor to enhance passenger reuse intention. Passenger reuse intention is influenced by service quality (Canming & Jianjun, 2011; J. S. Chou & Kim 2009).
Summarizing the above, lots of attributes should be taken into account when assessing the service quality, customer satisfaction, and reuse intention of urban rail transit, and these attributes may belong to different categories. As widely treated in the previous literature, service quality, customer satisfaction, and reuse intention are multidimensional construct, and then, the variation of the quality level perceived by the users depends on how passengers’ satisfaction with the various service aspects changes over time. The SEM model seems very appropriate for describing a complex phenomenon like transit passenger perception of the used service. All these researches have emphasized key factors of rail transit service quality but have been tested in countries that have less population than China. As a developing country, people in China are paying more attention to the safety and availability of rail transit rather than the comfort. By taking this in mind, this article has identified functional service quality, technical service quality, comfort and cleanness, and service planning and reliability as important service quality factors, and the hypothesis is proposed:
Interrelationship Between Customer Satisfaction and Reuse Intention
In the field of the interrelationship among service quality, customer satisfaction, and reuse intention, researchers have paid attention on the role of service quality provided by the metro operator and have pointed out that positive customer satisfaction created by service quality lead to reuse intention (P. F. Chou et al., 2014; Yilmaz & Ari, 2017). Agarwal (2008), in the study of the Indian railway, found that service quality can affect passengers’ reuse intention by enhancing customer satisfaction. Eboli and Mazzulla (2015) analyzed the relationship between customer satisfaction and service quality of rail transit, and the results confirmed that service quality had an impact on customer satisfaction and it could influence the passenger to reuse the rail transit. Stuart et al. (2000) verified how different service attributes directly and indirectly influence the passengers’ satisfaction and passenger reuse intention of urban rail transit in New York by using SEM model. Allen, Eboli, et al. (2019) analyzed the relationship between transit passengers’ satisfaction and loyalty, and they introduced the concept of critical incidents (CIs), which affected any attribute-specific satisfaction construct, and the results showed that CIs decreased satisfaction with all attribute-specific service elements. Overall satisfaction and specific service quality attributes directly affected loyalty. Meanwhile, Allen, Muñoz, and de Dios Ortúzar (2019) took Santiago de Chile Metro system as an example, developed a SEM model with users’ perceived attributes, and the results showed that safety, ease of boarding, response to CIs, the number and type of CI endured, and information were the variables that mostly affected satisfaction. Based on these, to test the influence of customer satisfaction on reuse intention, the following hypothesis is proposed:
Research Methodology
The SEM Model
SEM is a multivariable statistical technique which allows researchers to resolve the complex structures expressed in a series of equations. It can evaluate causal relationships between latent variables and test the hypothesis. The latent variables can be divided into exogenous variables and endogenous variables (Fornell & Larcker, 1981). The basic equation of the structural model can be defined with the following equation (Bollen, 1989)
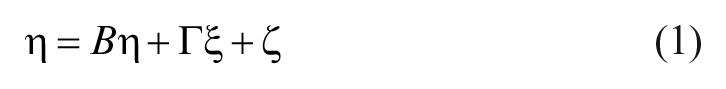
where
The basic equations of the measurement model are the following


where x is the column q-vectors related to the observed exogenous variables,
The maximum likelihood (ML) method is used to estimate the model parameters. The ML method is estimated in a way that minimizes the difference between the predicted variance–covariance matrix and the observed variance matrix and considers the constraints of the model.
Data Collection
To obtain accurate responses and reduce ambiguity, a preliminary questionnaire was distributed to a pilot group of 30 people on the basis of a convenient sampling. The questionnaire survey was conducted in Tianjin, China. The pilot group consisted of academics and relevant experts. The pilot group not only answered the questions but also proposed some advices in language to obtain a better understanding of the questions. Their advices were included to refine the questionnaire. The final questionnaire mapped the scale from 1 to 10 points to represent the different level of the passengers’ attitude (1 = strongly disagree; 10 = strongly agree). A total of 300 questionnaires were conducted and 220 effective responses were received. The surveys were conducted at stations in the morning and afternoon on different days in a week. The questionnaires were randomly given face-to-face to passengers from July 7 to August 5, 2018. A cluster sampling is conducted to collect the data, first we divided the metropolitan area into 30 collection blocks. Ten blocks were then chosen at random. Next, we sent 30 highly trained graduate interviewers to the collection blocks. Each block is assigned three students as a team, and they were responsible for station interviews in each collection block.
Results
Demographic Profile of Passengers
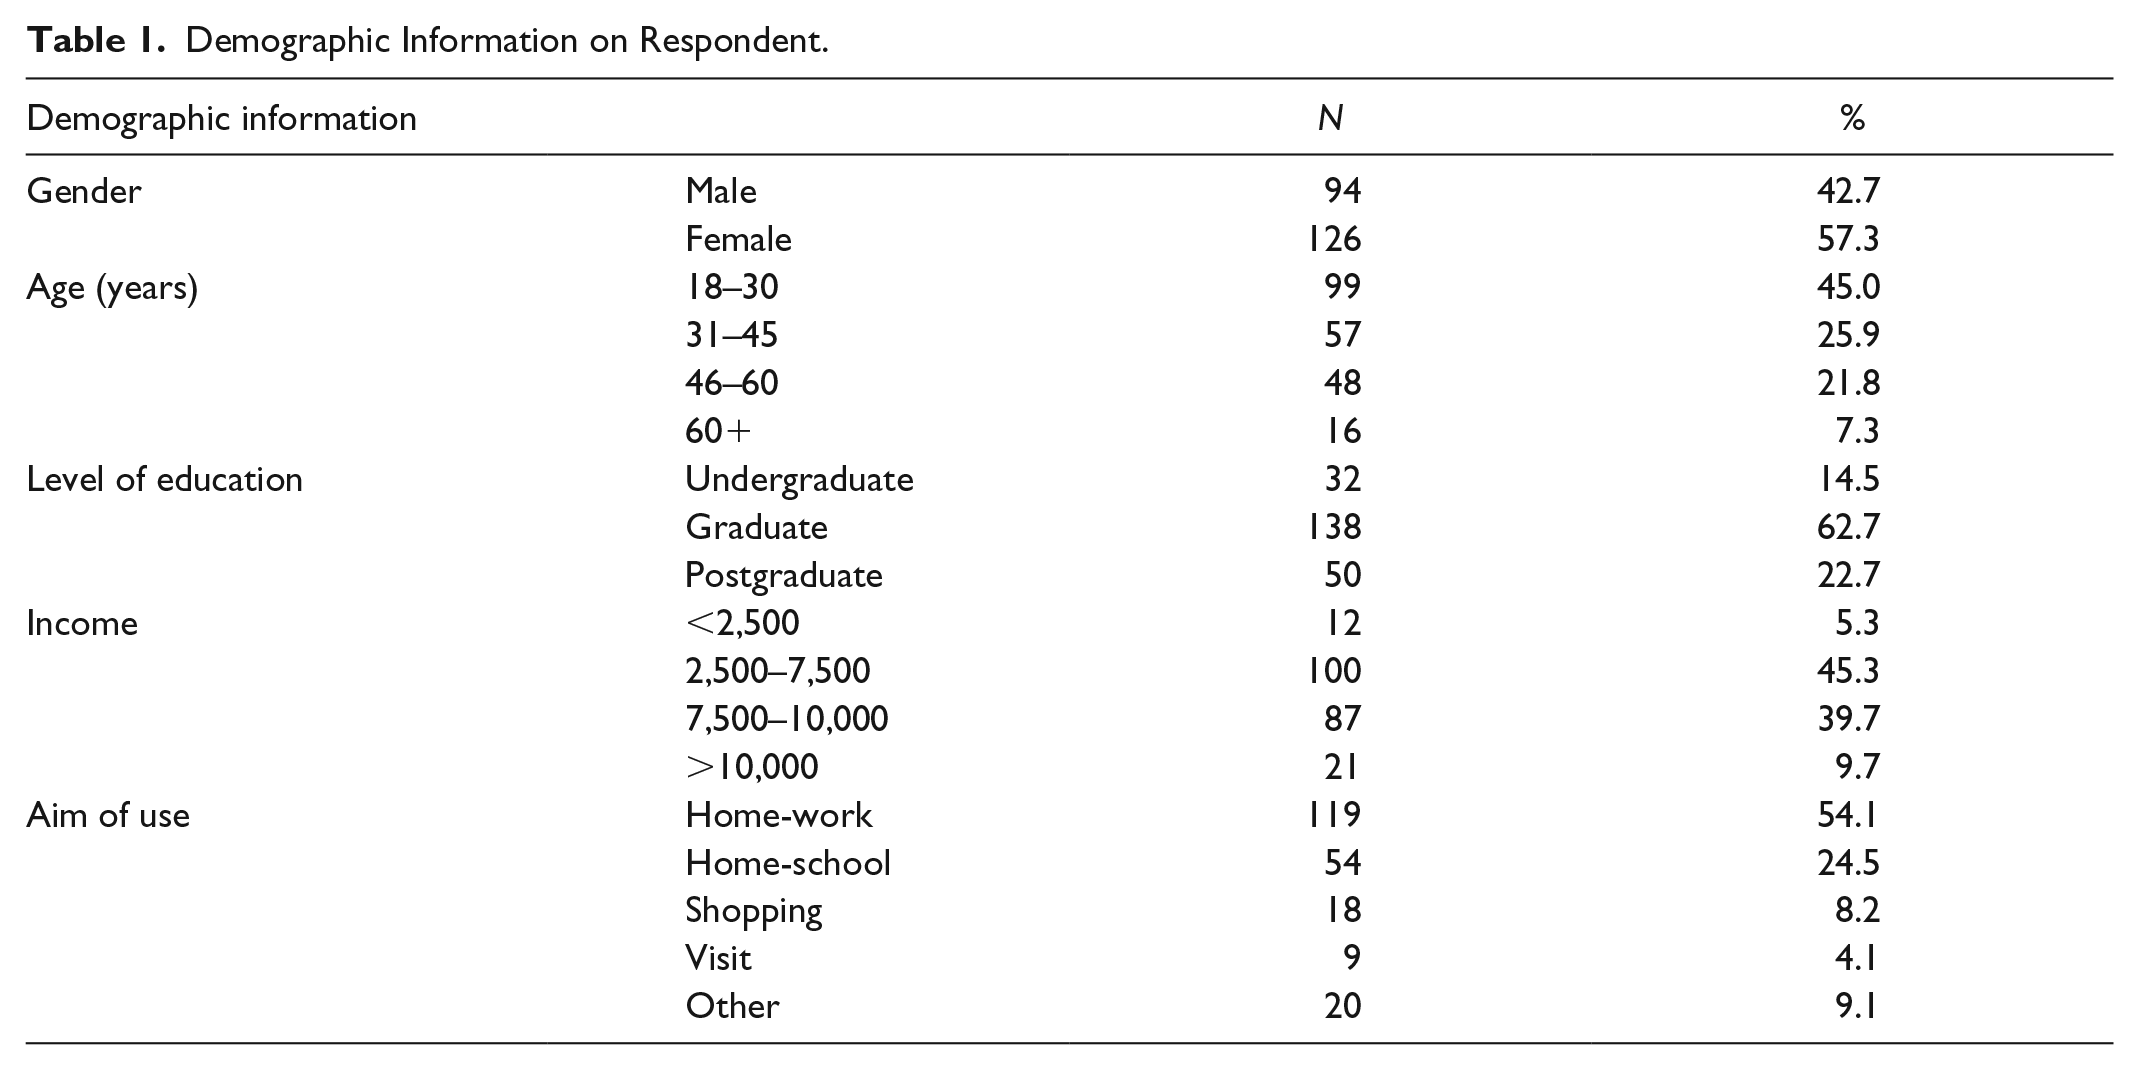
The survey instrument consists of three parts that collect information related to passengers’ perception: Part A, which aims to know the sociodemographic characteristics of passengers. Part B, regarding the use of trains, which collects the passengers’ travel habits. Part C contains the attitude statements relating to dimensions such as service quality, customer satisfaction, and reuse intention. The basic characteristics of the passengers are shown in Table 1. As shown in Table 1, the sample was made up of more females (57.3%). Most of the respondents were well educated, and 45.0% were aged between 18 and 30 years, 25.9% were aged between 31 and 45 years, and 92.7% were younger than 60 years of age. A substantial number of passengers (35.5%) stated that they use urban rail transit lines every day, and 25.9% occasionally use urban rail transit lines. Most of the passengers choose urban rail transit lines to go to work and school. As shown in Figure 1, most of the passengers go to the station by walking and 19.5% of passengers ride bicycle; this is due to the introduction of bike-sharing schemes and it is convenient to get to the destination by using Mobike. Only 6.3% of the passengers use their private cars to get to stations. This is because it is not convenient to park the cars near the stations. As shown in Figure 2, 35.45% of the passengers indicated that they use the urban rail transit lines every day and 25.91% of the passengers reported that they use the urban rail transit lines occasionally. Table 2 shows the mean value and standard deviation of the attitude statements relating to dimensions such as service quality, customer satisfaction, and reuse intention.
Demographic Information on Respondent.

Assess type.

Journey frequency.
Service Quality, Customer Satisfaction and Reuse Intention Statistics.

Note. FSQ1: sense of security against accidents while traveling, FSQ2: noise level and vibration during the journey, FSQ3: train crowding. TSQ1: equipment and facilities, TSQ2: ticket service, TSQ3: air conditioning system inside the trains; CC1: cleanliness of inside the trains, CC2: cleanliness of metro stations, CC3: seat available, CC4: information available; SPR1: access to metro stations, SPR2: speed of the trip, SPR3: itinerary accuracy. FSQ = functional service quality; TSQ = technical service quality; CC = comfort and cleanness; SPR = service planning and reliability; SQ: service quality; CS = customer satisfaction; RI = reuse intention.
Test the Validity and Reliability of Measures
To explore the scale of service quality, exploratory factor analysis was conducted to analyze the correlations of the indicators. The results showed that the Cronbach’s alpha value was 0.727 (>0.6), which shows the validity of the measures. The Bartlett’s Test of Sphericity was 2640.84 and the associated significance level was 0.000, which shows that there is correlation among variables, and the factor analysis is effective. The value of the Kaiser–Mayer–Olkin was 0.876 (>0.7), which shows that the data are suitable for factor analysis. After the exploratory factor analysis, confirmatory factor analysis was conducted to measure the convergent validity, average variance extracted (AVE) >0.5 in all occasions. And the correlation between the constructs ranged from 0.012 to 0.586, and there is no correlation between the pair of measures exceeding the criterion (above 0.9). Table 3 shows the estimated results for the confirmatory analysis.
The Validity and Reliability of the Measures.
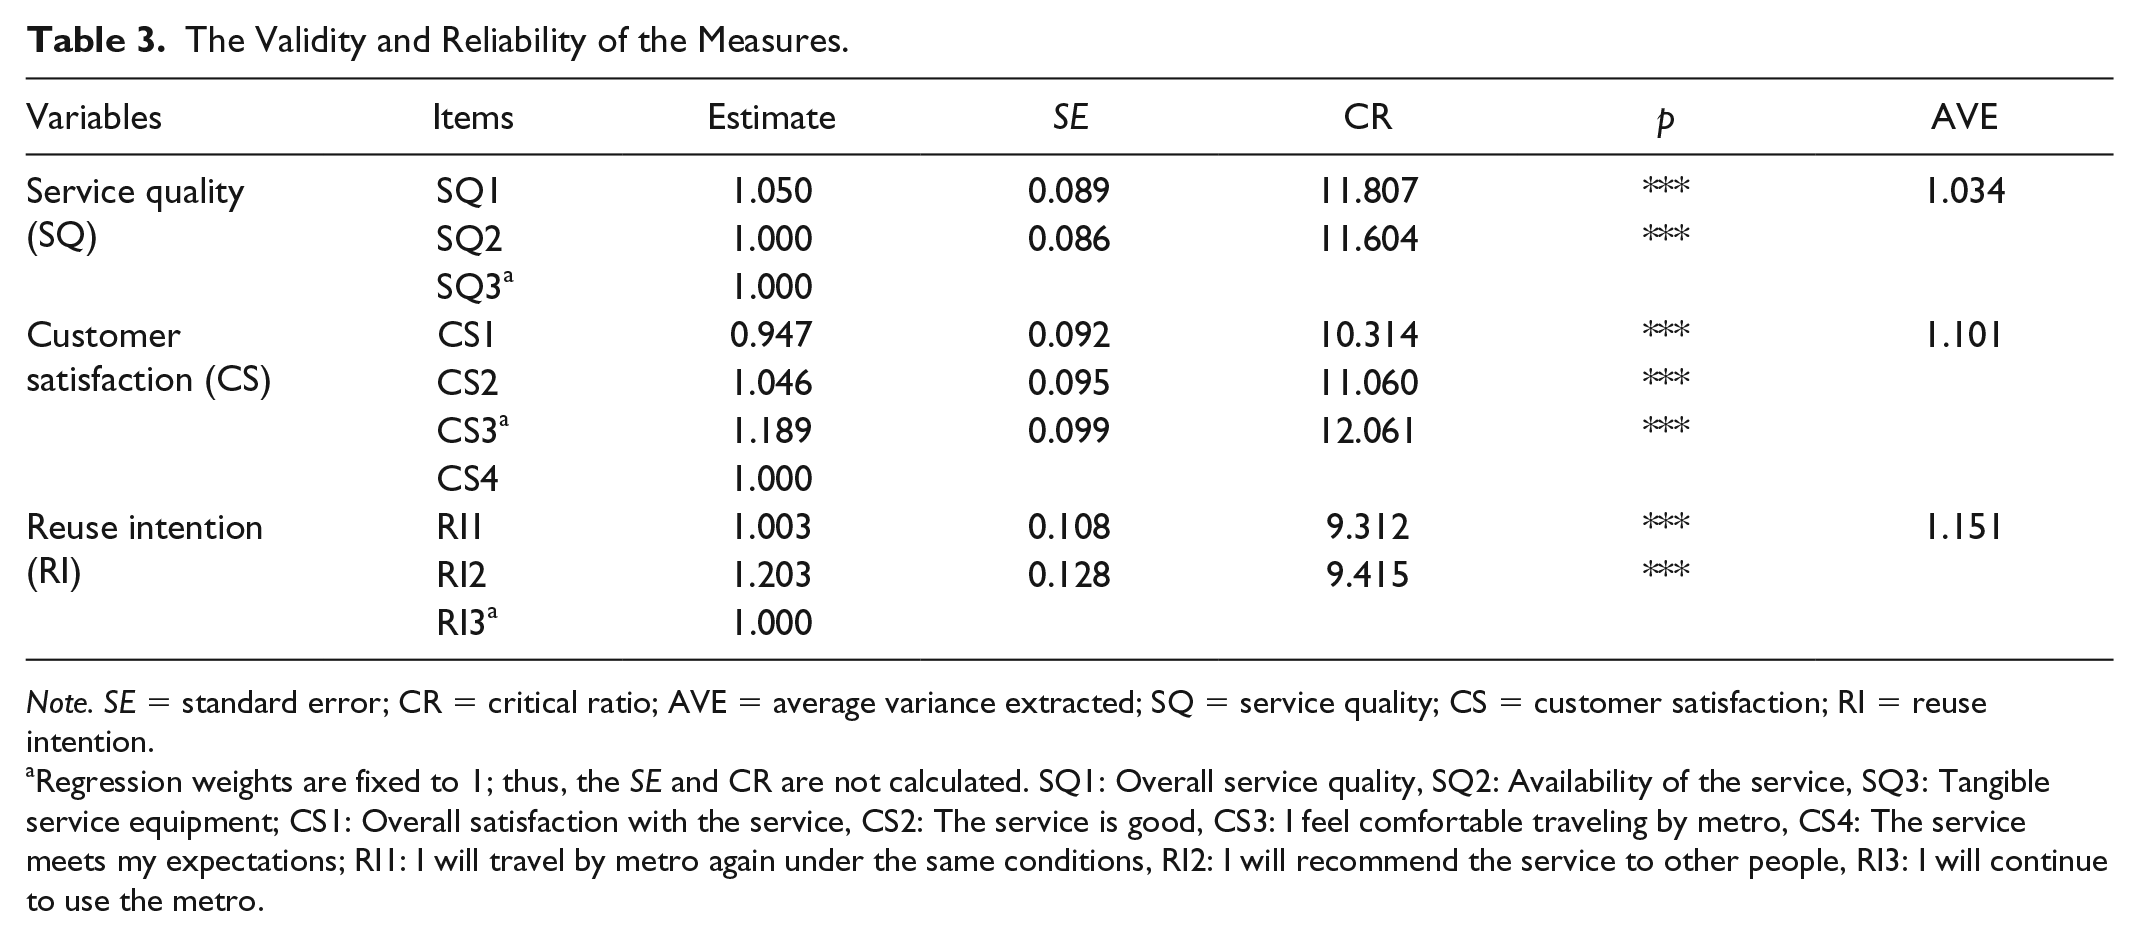
Note. SE = standard error; CR = critical ratio; AVE = average variance extracted; SQ = service quality; CS = customer satisfaction; RI = reuse intention.
Regression weights are fixed to 1; thus, the SE and CR are not calculated. SQ1: Overall service quality, SQ2: Availability of the service, SQ3: Tangible service equipment; CS1: Overall satisfaction with the service, CS2: The service is good, CS3: I feel comfortable traveling by metro, CS4: The service meets my expectations; RI1: I will travel by metro again under the same conditions, RI2: I will recommend the service to other people, RI3: I will continue to use the metro.
Measurement Model
In the model, service quality was conceptualized as functional service quality, technical service quality, comfort and cleanness, and service planning and reliability. So, a second round confirmatory analysis was conducted to determine the importance of each section. Table 4 showed the estimated results for the second round confirmatory analysis; from it we can see the results support the confirmatory analysis. The whole fit indices indicated that the model can meet the requirements of the goodness-of-fit indices as the various fit indices are within the prescribed limits, and the main fit indices of the model are presented in Table 5.
The Validity and Reliability of the Second Round Factor of Service Quality.

Note. SE = standard error; CR = critical ratio; AVE = average variance extracted; FSQ = functional service quality; TSQ = Technical service quality; CC = comfort and cleanness; SPR = service planning and reliability.
Regression weights are fixed to 1; thus, the SE and CR are not calculated. FSQ1: Sense of security against accidents while traveling, FSQ2: Noise level and vibration during the journey, FSQ3: Train crowding. TSQ1: Equipment and facilities, TSQ2: Ticket service, TSQ3: Air conditioning system inside the trains; CC1: Cleanliness of inside the trains, CC2: Cleanliness of metro stations, CC3: Seat available, CC4: Information available; SPR1: Access to metro stations, SPR2: Speed of the trip, SPR3: Itinerary accuracy.
The Results of the Model’s Goodness-of-Fit Test.

Note. RMSEA = root mean squared error approximation; CFI = comparative fit index; DF = degree of freedom; GFI = goodness-of-fit index; CMIN = likelihood-radio chi-square.
Path Analysis
The path relationships in the research model were analyzed by SEM. Based on the results of Amos 22, the overall fit indexes of the study model were acceptable (Bollen, 1989): root mean square error approximation (RMSEA) = 0.057 (<0.08); root mean square residual (RMR) = 0.098 (<0.05); goodness-of-fit index (GFI) = 0.875 (>0.9); adjusted goodness-of-fit index (AGFI) = 0.841 (>0.9); non-normed fit index (NNFI) = 0.929 (>0.9); incremental fit index (IFI) = 0.940 (>0.9); comparative fit index (CFI) = 0.939 (>0.9); parsimony goodness-of-fit index (PGFI) = 0.691 (>0.5); and parsimony-adjusted normed fit index (PNFI) = 0.746 (>0.5).
Table 6 shows the results of the calculation of the SEM, which showed that the results support H2–H4. Service quality has a significant effect on customer satisfaction (H2 = 0.775), and service quality has an effect on reuse intention (H3 = 0.184). Meanwhile, customer satisfaction has an effect on reuse intention (H4 = 0.240), and the results support H4. The structural model with standardized weights is shown in Figure 3.
The Results of the Model’s Hypotheses Test.

Note. SE = standard error; SQ = service quality; CS = customer satisfaction; RI = reuse intention.
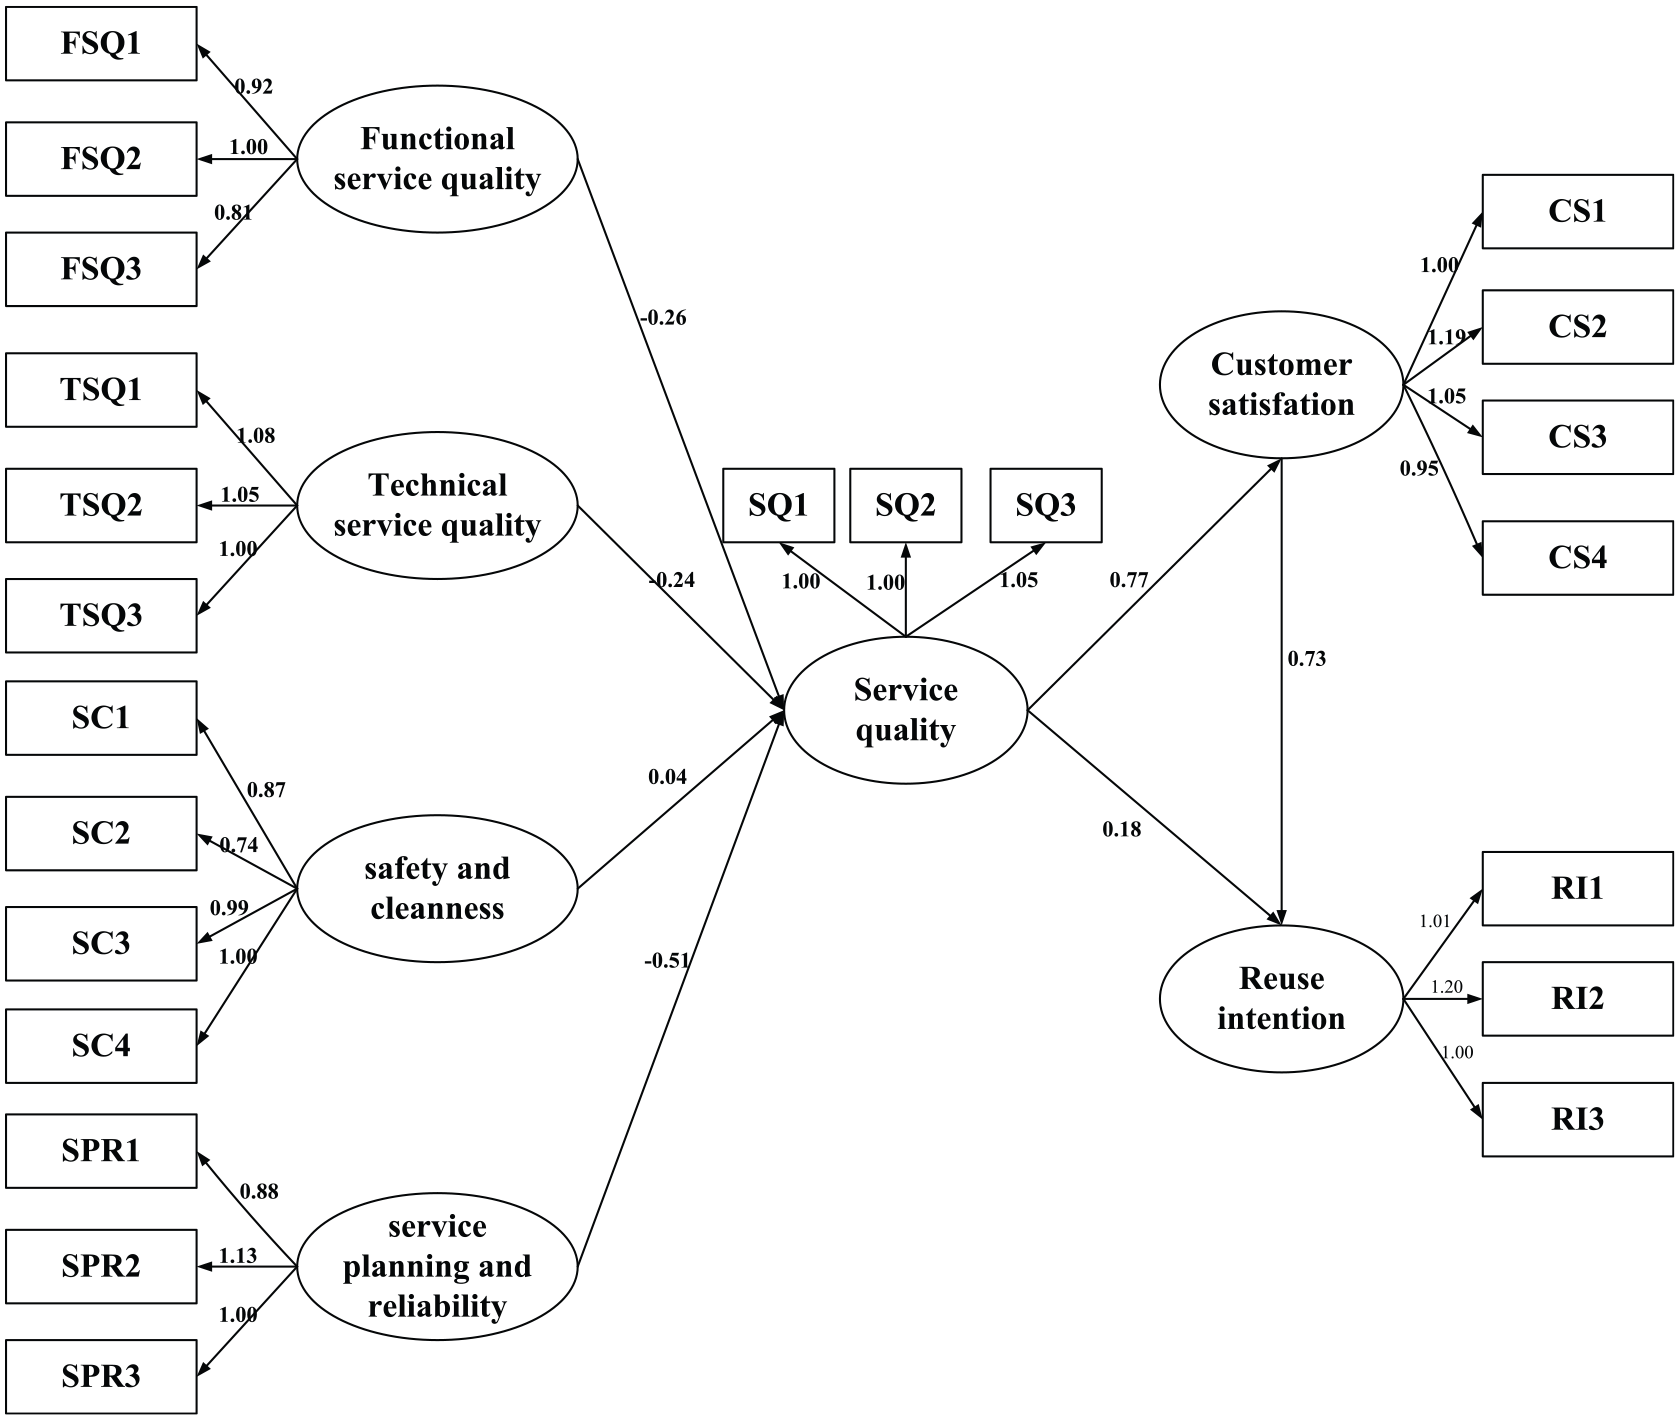
The hypothesized model with path coefficients.
Discussion
Service Quality
The study identified key dimensions that led to the service quality of urban rail transit. The structural model showed that service quality can be conceptualized as functional service quality, technical service quality, comfort and cleanness, and service planning and reliability. The validation test by AVE and composite reliability procedure showed that the proposed four dimensions of service quality scale had appropriate reliability and validity.
Service planning and reliability were the most important significant variable in this study. The findings are supported by the actual situation in China (Pan et al., 2010; Shen et al., 2016; Sun et al., 2015). In China, passengers consider urban rail transit that is convenient to use and the time is punctuality. As the passengers consider punctuality of time, easiness of access to metro stations, and itinerary accuracy to have a relatively high level of service quality, the operator of the urban rail transit should pay more attention to the operation management such as the access to stations and easier transfer. Sun et al. (2015) pointed out that operating hours and frequency of the transit should be paid more attention. A well-designed service planning and reliability structure can promote customer satisfaction and lead to reuse in terms of the time required to achieve the desired results.
The next important variables are the functional service quality and technical service quality. The functional service quality of the structure indicates that safety and train crowding have a high level of impact on service quality. The technical service quality of the structure indicates that equipment and facilities and ticket service have a high level of impact on service quality. From these we can see that in China, these attributes are not the most important ones in their overall customer satisfaction. Therefore, subway services can benefit from these dimensions such as safety of the trip, the presence of fare policy, and the good quality of tangible equipment.
Comfort and cleanness was found to be the least significant of all the variables of service quality. The results indicate that compared with passengers in developed countries, passengers in China pay less attention to comfort and cleanness in the train, and they can tolerate these conditions. This issue can be solved by improving the quality of station environment and providing more seats at stations.
Interrelationship Among Service Quality, Customer Satisfaction, and Reuse Intention
This study assumed that the service quality has a direct impact on customer satisfaction and reuse intention, and customer satisfaction has a direct impact on reuse intention. Service quality is positively related to customer satisfaction. The findings are consistent with the previous studies (de Oña et al., 2015; Eboli & Mazzulla, 2015; Shen et al., 2016; Yilmaz & Ari, 2017; Van Lierop & El-Geneidy, 2016). Similarly, the results of this study also showed that customer satisfaction is positively related to reuse intention. This indicates that customer satisfaction is positively affecting passengers’ willingness to reuse the urban rail transit. Both service quality and customer satisfaction have a direct impact on reuse intention, and the findings showed that the operator of the urban rail transit needs to devise strategies focusing on service quality and customer satisfaction such as on-time performance, safe travel, and temperature of air conditioning system inside the trains, which, in turn, can lead to reuse intention. Therefore, it needs further in-depth verification in different cultures of different countries.
Conclusion
China now is accelerating the construction of urban rail transit. How to attract more people to choose urban rail transit instead of private cars and increase the occupancy rate of urban rail transit has become a major issue to be considered. The purpose of this study has three aspects: (a) to understand the passengers’ perception and expectation of service quality, (b) to develop and test the measurement tools of the service quality dimension, and (c) to study the interrelationship among service quality, customers satisfaction, and reuse intention. From the results we can see that the service quality plays a very important role on customer satisfaction, and it has a positive impact on passengers’ reuse intention. By analyzing the passengers’ perceptions, operator of urban rail transit can understand the travel demands of passengers and improve service quality according to passengers’ demand. In addition, customer satisfaction can help the operator to understand the effectiveness and acceptance of passengers’ dairy travel, and it plays a positive role in attracting the passengers to reuse. This has deepened our understanding of the factors that influence the passengers to choose urban rail transit.
The conclusions drawn from this study have important implications for both researchers and operators of urban rail transit. This research is mainly focused on Chinese cities, where the construction of urban rail transit is accelerating; however, it is still lagging behind the Western countries. The model generated in this study can be extended to other developing countries, particularly the countries with high-density population and relatively low income, to fully assess the factors that lead to reuse intention. This study refines the interrelationship among service quality, customer satisfaction, and reuse intentions. And the results show that service quality has a significant impact on customer satisfaction and the service quality, and customer satisfaction has impact on passengers’ reuse intention. Service quality can be conceptualized as a convergence of four dimensions, namely functional service quality, technical service quality, comfort and cleanness, and service planning and reliability, which are at the second abstract level. These findings have implications for policy makers who are responsible for implementing and promoting urban rail transit development, as well as for researchers who are interested in developing theories that explain the interrelationship among service quality, customer satisfaction, and reuse intention. Compared with public transport, for the individual, private car is appealing. Therefore, we recommend that policymakers should pay more attention to service quality. According to our research, service planning and reliability is the most important factor, and comfort and cleanness is the least important factor. We recommend that well-designed facilities can enhance resident’s walking pleasure, improve the accessibility to metro stations, and is of great significance to the promotion of trip. Meanwhile, management should reduce the waiting time for trips.
Despite the above-mentioned theoretical and practical implications, this study still has several limitations. First, the existing researches mainly focus on the data for a period of time. In further research, data from different periods should be obtained, and the research with different periods should be combined. Second, every city has its own cultural, geographic, and economic background, so there is a need to analyze more empirical cases and supplement the data with more interviews, and this will undoubtedly increase the effectiveness of the research results. Thus, further research can explore the relevance and relative importance of factors, including reliability, safety, and frequency and provide accurate and accessible information in multicultural and multiregional contexts.
Footnotes
Acknowledgements
The authors are indebted to the students of Tianjin Normal University for their contributions to collect the data.
Author contributions
Y.W. involved in the conceptualization, methodology, and analysis. Y.W. and Z.Z. involved in the writing and original draft preparation. M.Z. and H.W. involved in writing review and editing.
Declaration of Conflicting Interests
The author(s) declared no potential conflicts of interest with respect to the research, authorship, and/or publication of this article.
Funding
The author(s) disclosed receipt of the following financial support for the research, authorship, and/or publication of this article: This research was funded by the National Natural Science Foundation of China (grant number 51608363), Tianjin Normal University’s high research and high visit to young teachers, and the Natural Science Foundation of Tianjin Education Commission (grant number 043-135202-JW1717).