
Abstract
The Behaviour Rating Inventory of Executive Function–Preschool Version (BRIEF-P) is a hand-storable instrument that permits evaluation of the executive functions in children between the ages of 2 years and 5 years 11 months by parents, teachers, or other usual child caregivers, thus facilitating early intervention. It is a standardized questionnaire that is derived from the school version. It has been translated into different languages and adapted to different cultures and recently it has been translated into Spanish. It is answered using a Likert-type frequency scale. It is composed of 63 items that measure various aspects of executive functioning: five clinical scales, three broad indexes, one composite score or Global Executive Composite, and validity scales. The objective of this study was to analyze the psychometric properties related to the validity and reliability of BRIEF-P in children with neuropsychological, psychological, and developmental disorders that begin to manifest during early years. Non-experimental or ex post facto research was the method used. The participants were 107 parents and 98 teachers, evaluating 205 children. We analyzed several psychometric properties, related to reliability and validity, and compared the results with normative and clinical samples in the versions (parents and teachers). It is confirmed that BRIEF-P is a valid and reliable instrument with which to evaluate executive functions in children having neurodevelopmental disorders. We believe that BRIEF-P can be an especially useful and advisable instrument to be applied by educational psychologists and children’s clinicians in a population. BRIEF-P is discriminative and sensitive to executive deficits in the clinical population.
Highlights
Parents and teachers are reliable sources for assessing the development of executive functions of children in early childhood education who have neurodevelopmental disorders.
It is confirmed that Behaviour Rating Inventory of Executive Function–Preschool Version (BRIEF-P) is a valid and reliable instrument with which to evaluate executive functions in children having neurodevelopmental disorders.
Differences are obtained depending on whether children have neurodevelopmental disorders or typical development when evaluated by parents and teachers.
Introduction
The application of Behaviour Rating Inventory of Executive Function–Preschool Version (BRIEF-P) has been chosen because it has been recently validated and adapted to English in the Spanish population. This is justified in its novelty, in comparison with other studies in other contexts where the originally version has been applied (Liogier d’Ardhuy et al., 2015; Sherman & Brooks, 2010; Yarnell et al., 2015).
BRIEF-P is an instrument to evaluate executive functions in children between the ages of 2 years to 5 years 11 months, and it is applied by parents, teachers, or other habitual child caregivers (informants).
It is used to evaluate executive functions in children with different neurodevelopmental disorders: (a) underweight (Anderson, McNamara, Andridge, & Keim, 2015), (b) Neurofibromatosis Type 1 (Lorenzo, Barton, Arnold, & North, 2013), (c) specific language disorder (Vugs, Hendriks, Cuperus, & Verhoeven, 2014), (d) Attention Deficit Hyperactivity Disorder (ADHD; Holt, Beer, Kronenberger, Pisoni, & Lalonde, 2012; Skogan et al., 2015; Veleiro, Peralbo, & Artigas, 2012), (e) Down Syndrome (Liogier d’Ardhuy et al., 2015), (f) hearing impairment (Holt et al., 2012), and (g) glutinic acid type (Beauchamp, Bonch, & Anderson, 2009).
The application requires 10 to 15 min. It is answered using a Likert-type frequency scale with three response options: never, sometimes, and frequently. It is composed of 63 items under five clinical scales (Inhibition, Emotional Control, Flexibility, Working Memory, and Plan/Organize), three clinical indexes (Inhibitory Self-Control, Flexibility, and Emergent Metacognition), Global Executive Composite, and two validity scales (Negativity and Inconsistency).
There are scales according to informant (parents and teachers) with respect to the development contexts (family or school), by sex and age groups (T-scores). T-scores greater than or equal to 65 reflect higher levels of problems or difficulties.
It is a standardized questionnaire that has recently been translated, adapted, and arranged in our particular context by Bausela and Luque were adapters the BRIEF-P in 2016 (Gioia, Espy, & Isquith, 2016).
Present Study
This study is aimed at analyzing the psychometric properties (reliability and validity) of BRIEF-P in a sample of children with neurodevelopmental disorders who have been evaluated by parents and teachers. Also, this study compares the development of executive functions in children in early childhood—those who present neurodevelopmental disorders that are evaluated by their parents and teachers—with a normative and clinical population.
Method
Design
Non-experimental methodology, ex post facto, descriptive, cross-sectional development study.
Participants
Participants were 107 parents and 98 teachers, evaluating 205 children, including those with various neurodevelopmental disorders, who participated in the adaptation and validation process for the BRIEF-P test in Spanish population (Gioia et al., 2016): ADHD, prematurity, language disorders, autism, language, epilepsy, Attention deficit disorder (ADD), mixed clinical group (maturational delay, neurofibromatosis, specific learning disorders, hypoxia, etc.). Neurodevelopmental disorders have been selected which, according to the body of literature, are accompanied by deficits in executive functions (Tirapu, García, Ríos, & Ardila, 2011).
Table 1 presents the distribution of children, according to their age, as evaluated by the informants: (a) 66.3% (n = 65) of the children evaluated by the teachers are 4 to 5 years of age and (b) 66.4% (n = 71) of the children evaluated by the parents are 4 to 5 years of age.
Description of the Evaluated Children in Terms of Age (Frequency and Percentage).

Source. BRIEF-P (Spanish adaptation).
Note. BRIEF-P = Behaviour Rating Inventory of Executive Function–Preschool Version.
Procedure
BRIEF-P was completed by parents, guardians, and teachers of children from 2 years to 5 years 11 months, who had knowledge of the child for a minimum period of 6 months. The study was conducted between 2013 and 2016.
Analysis of Data
For the analysis of reliability, internal consistency has been studied, based on Cronbach’s alpha. For the analysis of construct validity, the internal structure has been analyzed using confirmatory factorial analysis. To compare the development of executive functions between different samples (normative and clinical), the Student’s t test was applied for independent samples pertaining to the parent and teacher versions.
Results
Descriptive
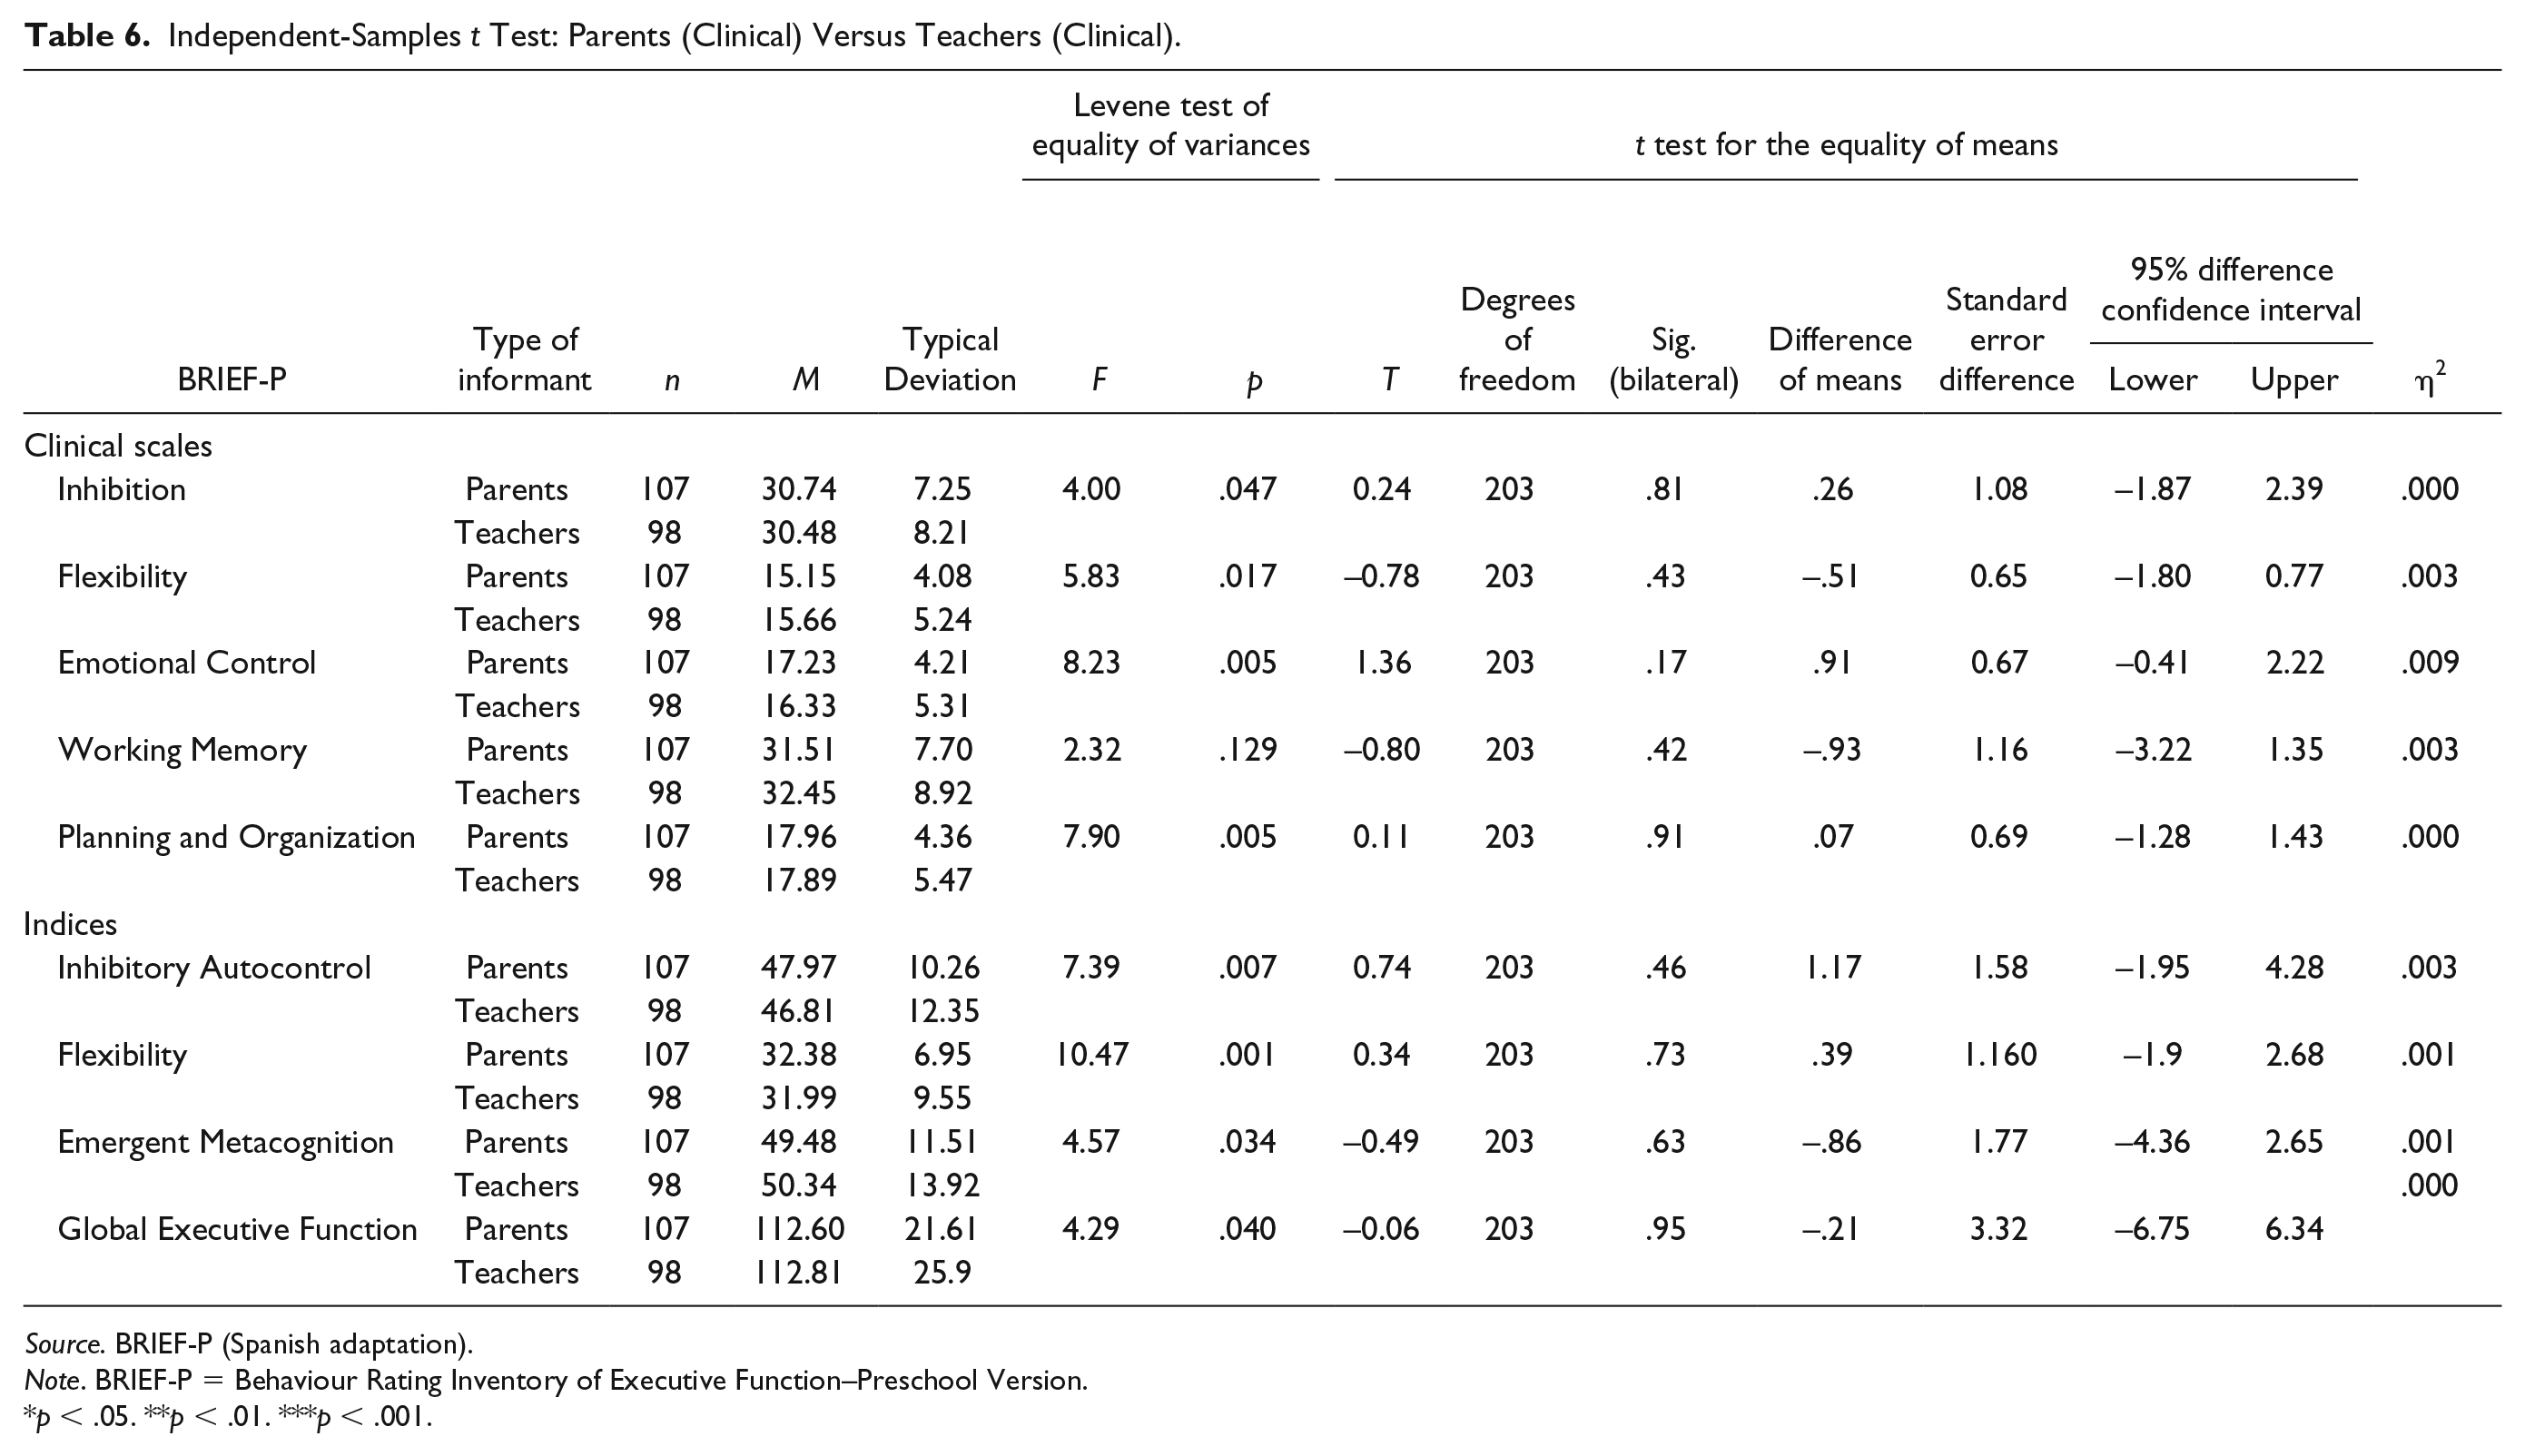
There are differences depending on the informants, so when the respondents are (a) teachers, the highest scores correspond to Working Memory (M = 32.45, DT = 8.92) and Emergent Metacognition Index (M = 50.34, DT = 13.92); (b) parents, the highest scores correspond to Working Memory (M = 31.51, SD = 7.70) and Emergent Metacognition Index (M = 49.48, SD = 11.51). Table 2 presents descriptions of BRIEF-P clinical scales and indexes according to the informants: parents and teachers.
Descriptive Statistics (Scales and Clinical Indexes of BRIEF-P; Parents and Teachers).

Source. BRIEF-P (Spanish adaptation).
Note. BRIEF-P = Behaviour Rating Inventory of Executive Function–Preschool Version.
Psychometric Properties: Reliability and Validity
For the reliability analysis, the internal consistency has been studied, based on Cronbach’s alpha. For the analysis of construct validity, the internal structure was analyzed using confirmatory factorial analysis.
Reliability of the Scales: Internal Consistency
Reliability is a psychometric property that refers to the absence of measurement errors, in other words, to the degree of consistency and stability of the scores obtained along successive measurement processes using the same instrument. Reliability has been analyzed when considering internal consistency. Reliability is a quality of test scores that indicates that they are useful because they are sufficiently consistent and free of measurement errors. Internal consistency has been calculated using Cronbach’s alpha at the different scales in the different subsamples. All alpha coefficient values are greater than .8: (a) Teachers (α = .89) and (b) Parents (α = .89). The alpha coefficient can be rated as very good (>.90) in Flexibility of teachers and parents and Global Executive Composite for parents. The values proposed by George and Mallery (2003) suggest that an alpha coefficient value >.08 is good and >.09 is very good.
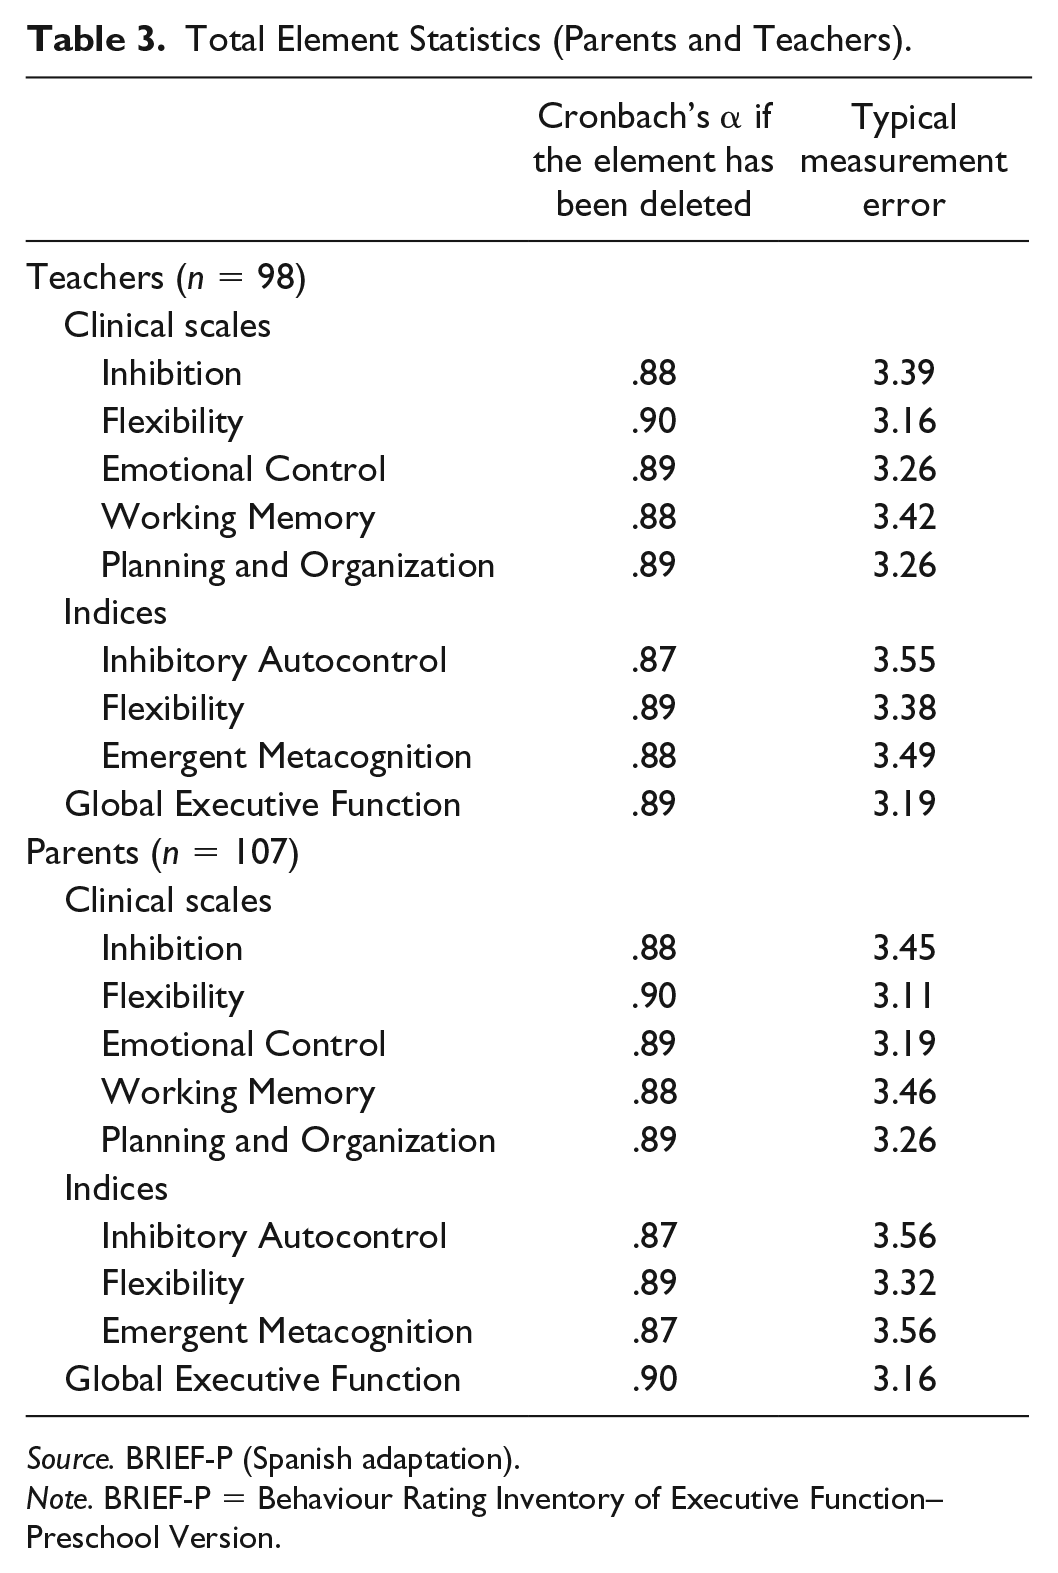
The reliability coefficients of Cronbach’s alpha are shown in Table 3. All alpha coefficient values are greater than .8. The alpha coefficient can be rated as very good (>.90) in Flexibility of teachers and parents and Global Executive Composite for parents. The values proposed by George and Mallery (2003) suggest that an alpha coefficient value >.08 is good and >.09 is very good.
Total Element Statistics (Parents and Teachers).
Source. BRIEF-P (Spanish adaptation).
Note. BRIEF-P = Behaviour Rating Inventory of Executive Function–Preschool Version.
Typical Measurement Errors for clinical scales and indexes of BRIEF-P as a function of the respondent in T-scores were calculated by applying the generic formula that is available in the Spanish version of BRIEF-P (Gioia et al., 2016).
Validation: Factor Analysis
The highest correlation coefficients are obtained from between (a) Emotional Control With Inhibition (r = .57, p = .000) and (b) Plan/Organize (r = .81, p = .000) with Working Memory. The lowest coefficient corresponds to the association between Flexibility and Inhibition (r = .27, p = .005).
The highest correlation coefficients are obtained from between (a) Inhibitory and Emotional Control (r = .65, p = .000) and (b) Plan/Organize (r = .86, p = .000) with Working Memory. The lowest coefficient corresponds to the association between Flexibility and Plan/Organize (r = .29, p = .005). Table 4 presents the intercorrelations matrix of the five clinical scales for the teacher and parent version of the test.
Matrix of Intercorrelations (Parent and Teacher).

Source. BRIEF-P (Spanish adaptation).
Note. Teachers (n = 98), (a) Determinant = .052. Top part table teachers. Parents (n = 107), (a) Determinant = .092. Bottom part table parents. BRIEF-P = Behaviour Rating Inventory of Executive Function–Preschool Version.
p < .05. **p < .01. ***p < .001.
To check if the correlation matrix is an identity matrix, that is, the intercorrelations between the variables are zero, we use Bartlett’s sphericity test, which consists of an estimate of the chi-square transformation of the determinant of the correlation matrix. If the variables are not intercorrelated, then Bartlett’s sphericity test must have a value (significance) higher than the limit of.05. The data matrix is valid for continuing with the factor analysis process, as in our case this analysis had a significance that was much lower than the limit of .05, it was .000.
The Kaiser–Meyer–Olkin (KMO) and Bartlett’s Test measure of sampling adequacy of teachers was used to examine the appropriateness of factor analysis. The approximate of chi-square is 279.00 with 10 degrees of freedom, which is significant at .000 level of significance. The KMO statistic of 0.61 is also large (greater than 0.50). Hence factor analysis is considered as an appropriate technique for further analysis of the data.
The KMO and Bartlett’s Test measure of sampling adequacy of parents was used to examine the appropriateness of factor analysis. The approximate of chi-square is 247.14 with 10 degrees of freedom, which is significant at .000 level of significance. The KMO statistic of 0.70 is also large (greater than 0.50). Hence factor analysis is considered as an appropriate technique for further analysis of the data.
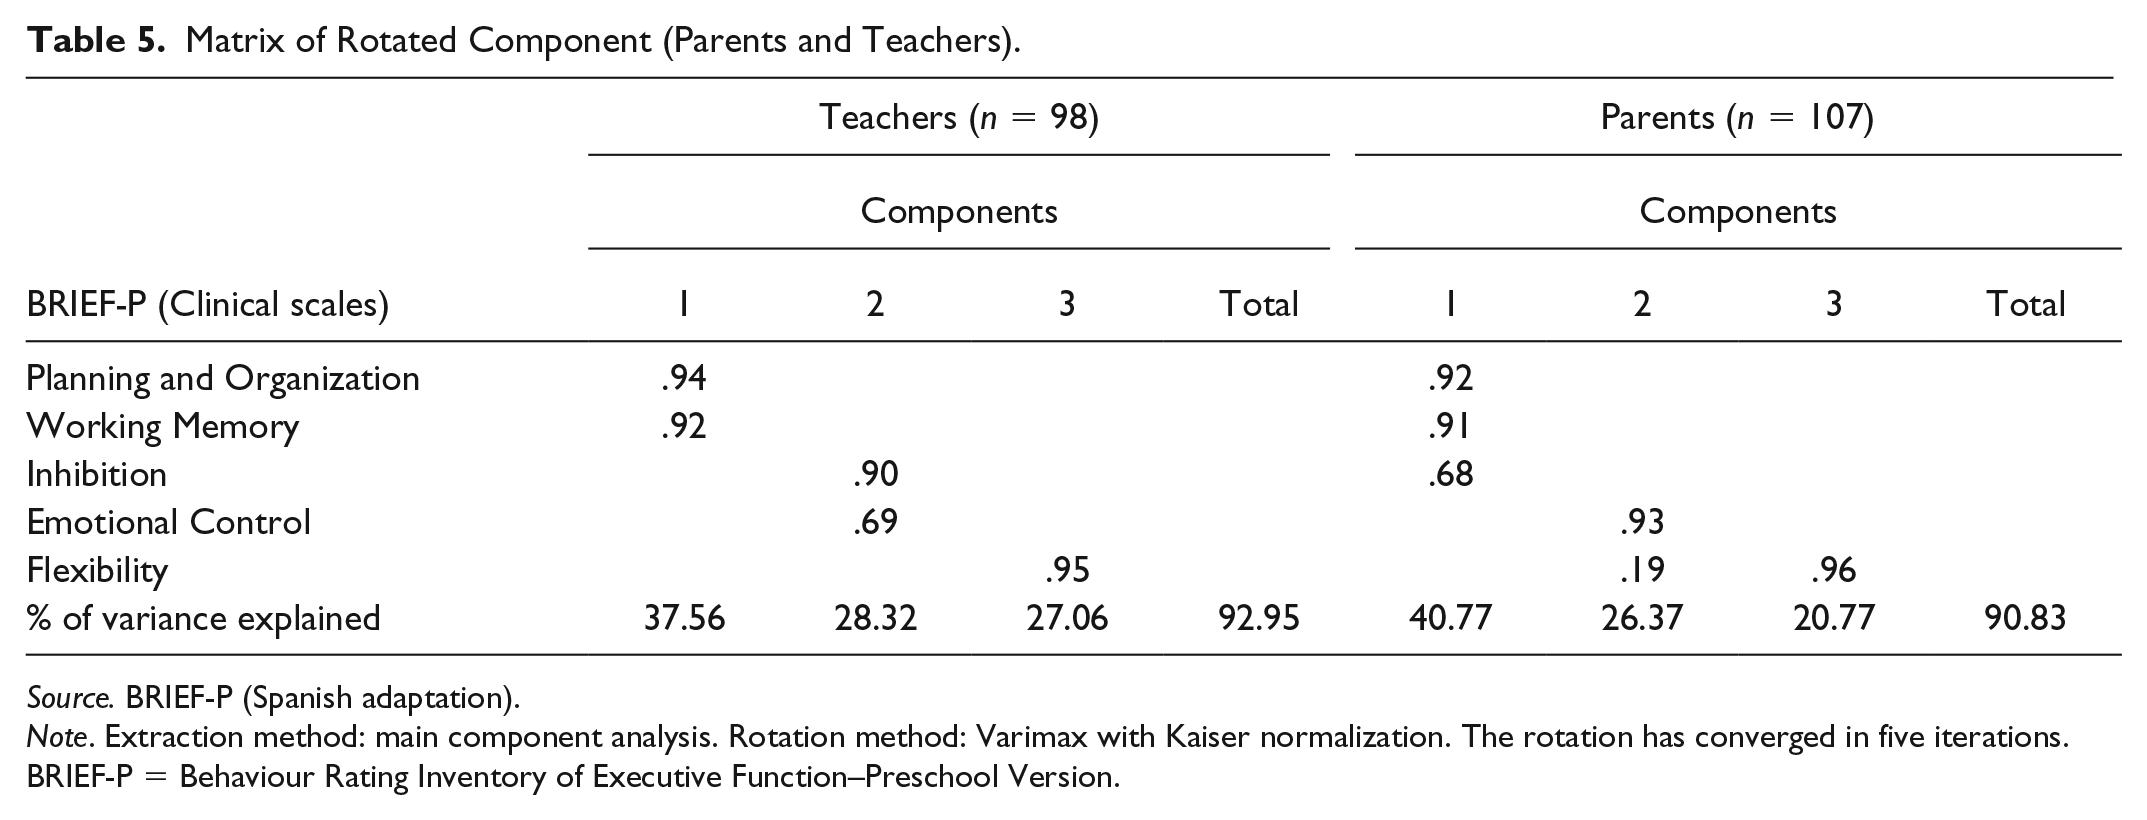
In the factor analysis, it was considered that a scale belongs to a component above a value of 0.40. When there are two or more values above this limit, the scale considered in the component is the higher value. As shown in Table 5, the model obtained for teachers (n = 98) is made up of three factors that explain 92.95% of the variance. Subsequently, we discuss the scales that make up the three factors: (a) Component 1 explains 37.56% of the variance and includes Plan/Organize and Working Memory; (b) Component 2 explains 28.32% of the variance and includes Inhibition and Emotional Control; and (c) Component 3 explains 27.06% of the variance and includes Flexibility. The model obtained for the parents (n = 107) is configured by three factors that explain 90.83% of the variance. Furthermore, we discuss the scales that make up the three factors: (a) Component 1 explains 40.77% of the variance and includes Plan/Organize, Working Memory, and Inhibition; (b) Component 2 explains 26.37% of the variance and includes Emotional Control; and (c) Component 3 explains 20.77% of the variance and includes Flexibility.
Matrix of Rotated Component (Parents and Teachers).
Source. BRIEF-P (Spanish adaptation).
Note. Extraction method: main component analysis. Rotation method: Varimax with Kaiser normalization. The rotation has converged in five iterations. BRIEF-P = Behaviour Rating Inventory of Executive Function–Preschool Version.
Difference Between Groups: Parents (Clinical) Versus Teachers (Clinical)
We compared the scores of parents and teachers in the scales and clinical indexes of BRIEF-P. The results of the Student’s t test for independent samples indicate that there are no statistically significant differences, depending on the respondents (see Table 6).
Independent-Samples t Test: Parents (Clinical) Versus Teachers (Clinical).
Source. BRIEF-P (Spanish adaptation).
Note. BRIEF-P = Behaviour Rating Inventory of Executive Function–Preschool Version.
p < .05. **p < .01. ***p < .001.
Difference Between Groups: Parents (Normative vs. Clinical) and Teachers (Normative vs. Clinical)
The teachers in the clinical sample scored higher with respect to the behaviors manifested by children at all scales clinical and indices of the test compared with the normative sample. Table 7 shows that there are statistically significant differences between teachers (normative vs. clinical) in all scales and clinical indexes of BRIEF-P.
Independent-Samples t Test (Teachers: Clinical vs. Normative).

Source. BRIEF-P (Spanish adaptation).
Note. BRIEF-P = Behaviour Rating Inventory of Executive Function–Preschool Version.
p < .05. **p < .01. ***p < .001.
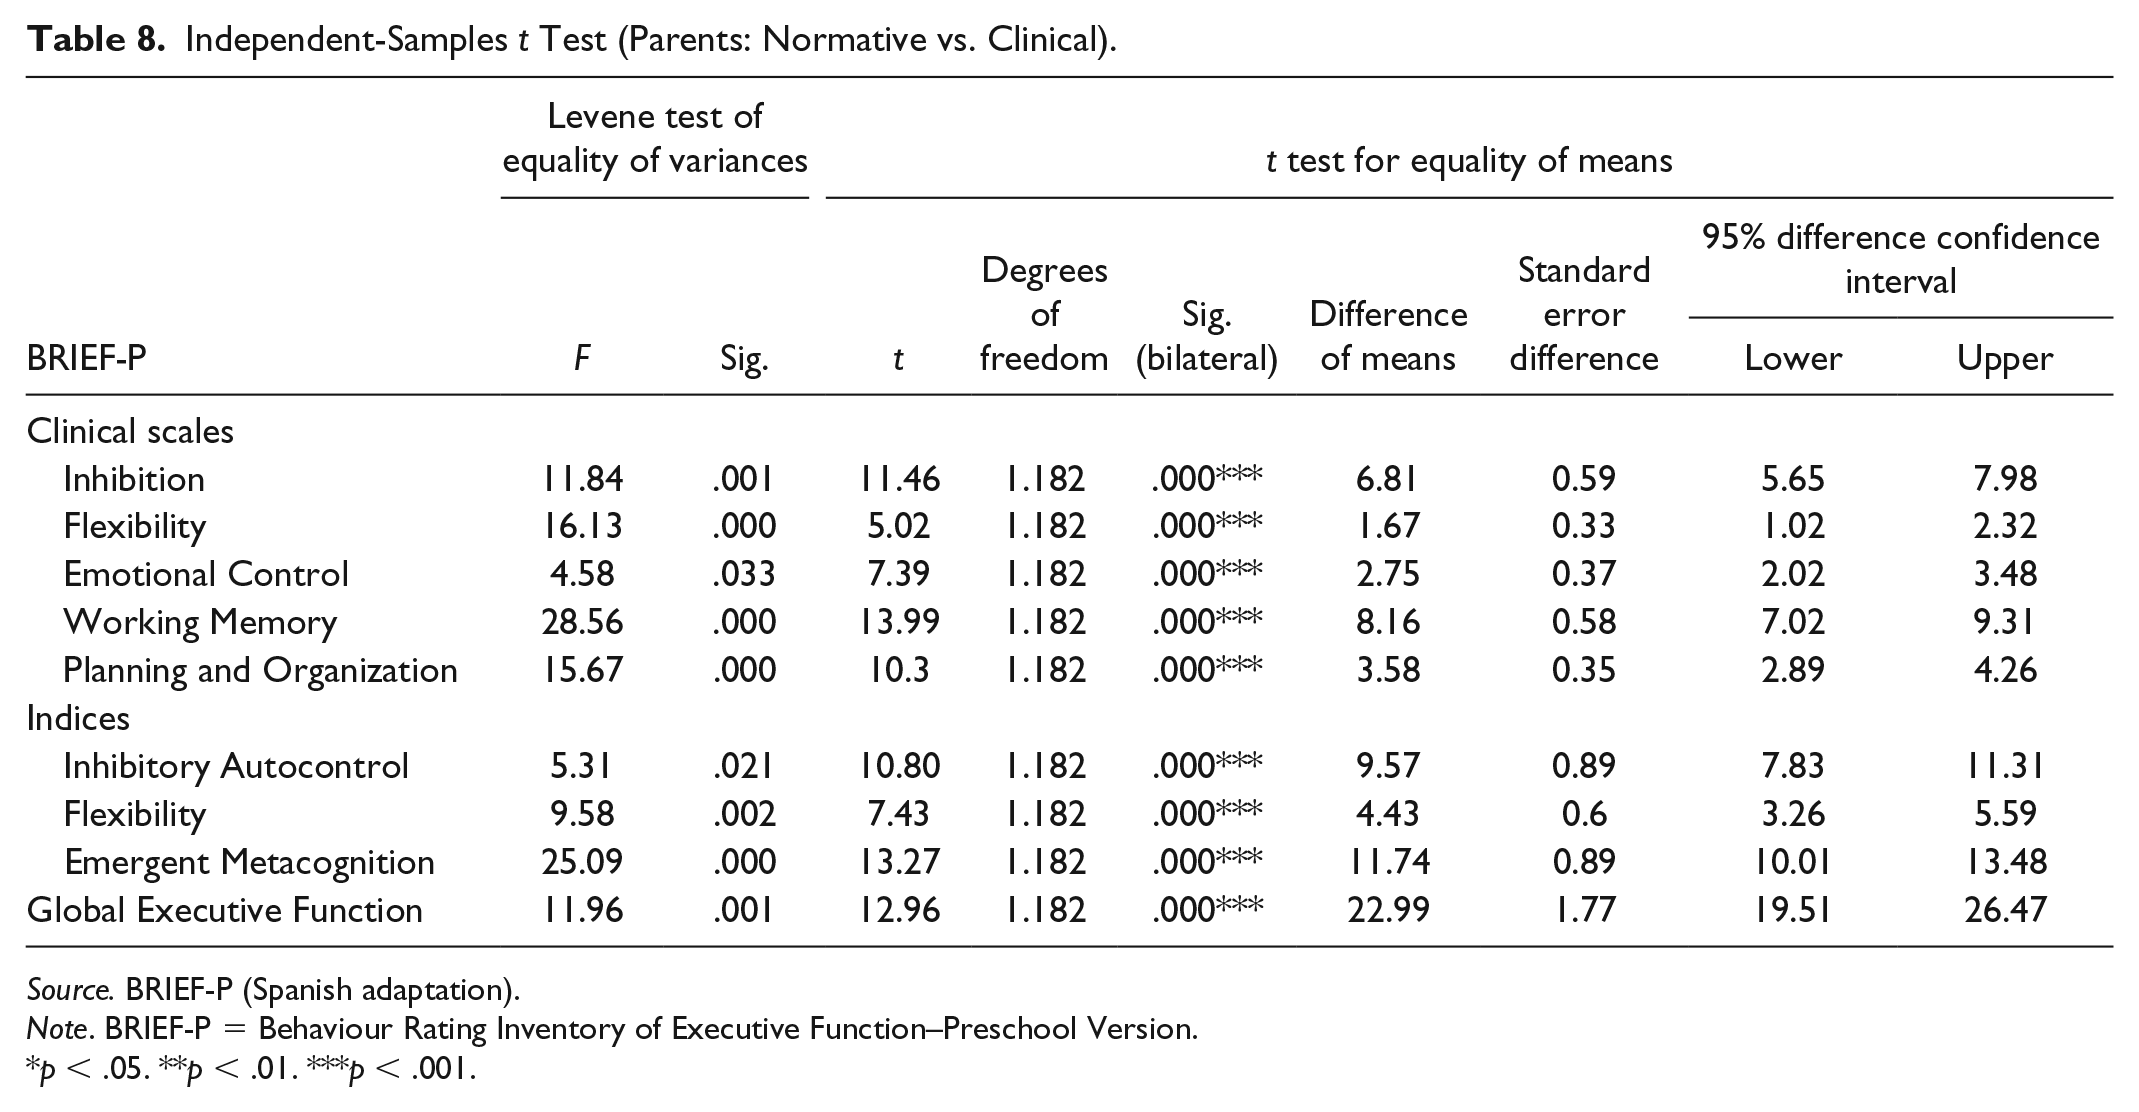
The parents of the clinical sample scored higher with respect to the behaviors manifested by children at all scales clinical and indices of the test compared with the normative sample. Table 8 shows that there are statistically significant differences between parents (normative vs. clinical) at all scales clinical and indexes of BRIEF-P.
Independent-Samples t Test (Parents: Normative vs. Clinical).
Source. BRIEF-P (Spanish adaptation).
Note. BRIEF-P = Behaviour Rating Inventory of Executive Function–Preschool Version.
p < .05. **p < .01. ***p < .001.
Discussion
The first objective of this study relates to the analysis of the psychometric properties of BRIEF-P in a sample of children with neurodevelopmental disorders who are evaluated by parents and teachers in an unprepared manner. In relation to this objective, we highlight two aspects:
i. Reliability: In the assessment of the internal consistency of the test, the results of the reliability of clinical scales and indexes in BRIEF-P are between .874 (Autocontrol Inhibitory scale in the teacher version) and .90 (Clinical Flexibility Scale in the parent version). We can conclude from the results that there is an adequate value for reliability.
ii. Validity: The results of the factorial analysis coincide with the results found in an American test (Veleiro et al., 2012), with three factors. Confirmatory factor analysis (CFA) repeats the same structure in both the parent questionnaire and the teacher questionnaire. The proposed factor structure, therefore, suggests that the scales of the test capture three types of difficulties.
The second objective of this study was to compare the development of executive functions in children with neurodevelopmental disorders from the perspective of parents and teachers (with clinical and normative samples). In relation to this objective, we can affirm that parents and teachers are reliable sources for assessing the development of executive functions of children in early childhood education who have neurodevelopmental disorders. In that, there are no differences in their perception, which disagrees with the results obtained by other authors and studies in a normative population (Montiel & Peña, 2001; Ortiz & Acle, 2006). Differences are obtained depending on whether children have neurodevelopmental disorders or typical development when evaluated by parents and teachers. These results allow us to conclude that BRIEF-P is sensitive to discriminate deficits in the executive functions between a normative population and a clinical population.
We conclude by affirming that BRIEF-P is an instrument that is sensitive to the development of executive functions and the informant who interacts with the child having a neurodevelopmental disorder, and guarantees a pluralistic and diverse view depending on the development contexts (home vs. school) and the ecological validity of the scores. These results are in accordance with those obtained by other researchers (Ortiz & Acle, 2006).
One of the strengths that we estimate is that the sample which has been drawn from all of the national territory guarantees the representativeness and generalization of the results obtained in the present study.
In terms of future perspectives, we propose to analyze the concurrent validity of BRIEF-P using the initial Luria (Garon, Smith, & Bryson, 2014; Manga y Ramos, 2000) Battery with respect to the executive dimension.
Research Limitations
The multiple sizes (power of the effect) prevent us from generalizing the results in the rest of the population. It is necessary to be prudent when interpreting, for example, the factorial structure of BRIEF-P with this sample size. We also consider in the future to include the analysis of the concurrent validity of BRIEF-P with other instruments that evaluate the executive functions in the child population and consider a larger sample size.
Footnotes
Acknowledgements
The author would like to thank all the people who participated anonymously and disinterestedly and Tamara Luque Cuenca, co-author of the Spanish adaptation of the BRIEF-P test.
Declaration of Conflicting Interests
The author(s) declared the following potential conflicts of interest with respect to the research, authorship, and/or publication of this article: The signing author of this text is co-author of the adaptation of BRIEF-P in Spanish along with Tamara Luque Cuenca, receiving the first co-author of BRIEF-P as compensation for royalties.
Funding
The author(s) received no financial support for the research, authorship, and/or publication of this article.