
Abstract
The objective of this study is to refine the Patient’s Perception of Hemodialysis Scale and data quality and refine the Patient’s Perception of Life on Hemodialysis Scale (PPHS). Collecting data from a convenient sample (N = 236), data were collected and a cross-sectional design survey design was used. Item inclusion was based on the item’s theoretical underpinning, examination of data quality, findings from a multi-trait/multi-item correlation matrix, and criteria for item and scale characteristics. Data indicators were close to normal in terms of distribution. High and low statistics suggest that the entire scope of the characteristic being measured were experienced. All criteria related to this examination supported the inclusion/exclusion of remaining items and subscales. Subscales are able to measure the main concepts. Findings from this research have been analyzed, and the PPHS now includes five subscales (36 items) and is deemed a valid indicator of the hemodialysis patients’ perceptions of life. Nephrology nurses will be able to assess the patient’s illness and treatment experience, their perception of formal social supports, adjustment to life on hemodialysis, and design interventions.
Introduction
In 2013, the Canadian Institute of Health Information (CIHI) determined that since 1993, the number of patients with renal failure has tripled, and annually approximately 80% of patients start on hemodialysis (HD; CIHI, 2013). End stage renal disease (ESRD), its symptoms, and treatment may affect every aspect of life. Health care professionals have acknowledged their responsibility in addressing clients’ psychosocial status as well as their physiological needs. In an attempt to improve assessment of adjustment to HD, Twomey, Barrett, Churchill, Way, and Parfrey (2014) the Patient’s Perception of Life on Hemodialysis Scale (PPHS) was developed by Gregory, Way, Hutchinson, Barrett, & Parfrey, 1998. This article describes the steps taken to refinement of the PPHS and its subscales. Demographic factors are very important and played a role in the outcomes; level of education, income, and marital status are not considered in this article as its purpose is specifically related to evaluation of the questionnaire. Outcome/findings were reported in previous publications.
Background
While reviewing the literature on HD patients, it becomes evident that quality of life (QOL) is defined using a variety of concepts that overlap to some degree, making it challenging to differentiate among the various ways that it may be measured. The approach to evaluating the total experience of patients on HD has been fragmented, and it is difficult to get an overall picture of patients’ adjustment to living with the disease, its treatment, and, ultimately, quality outcomes. One of the main problems with measuring such a vague concept is that much of the research on QOL was completed using a variety of methods, and tools, with disparate findings that added misunderstanding to an already vague topic. This attitude is reflected in the reviews of QOL research with HD patients (Anderson & Burckhardt, 1999; Danquah, Wasserman, Meinger, & Bergstrom, 2010; Edgell et al., 1996; Gill & Feinstein, 1994; Kimmel & Patel, 2006; Prutkin & Feinstein, 2002; Rettig et al., 1997). In this study, Twomey et al.’s (2014) quality outcome has a broader scope than QOL, yet includes all of its characteristics and is defined as the changing experience of living with and adapting to life on HD on a subjective and objective level (Gregory & Way, 2008). The goal of this research was not to measure quality outcomes but to capture how patients interpret the meaning of their illness/treatment, support system, adjustment to ESRD/HD, and to examine the ability of the PPHS to predict quality outcomes.
The PPHS
The disjointed approach to assessment of HD patients’ experiences and quality outcomes, the lack of existing instruments that reliably and validly measure the process of living with ESRD/HD, and patient adjustment to these challenges were the impetus for a qualitative study that was the basis for the PPHS (Gregory, 1998; Gregory et al., 1998). Using a grounded theory approach, Gregory et al. (1998) examined the psychosocial and physiological experience of patients on HD. The theoretical constructs that emerged from the research were as follows: meanings of illness and treatment, social supports, and adjustment to a new normal. The meaning of illness and treatment is defined as dealing with the upset/stress of living with renal failure and HD, its symptoms, the varied comorbidities, the frustration of ambivalence, the clash between knowing what one should do to be healthy and actually being healthy according to their illness and treatment restrictions. Social supports consists of support from physicians, nurses, and technicians—formal support, and informal supports such as family and friends. Adjustment to a new normal is related to the burden of decision making combined with adapting to ESRD/HD of the burden of decision making associated with adapting to living with disease and HD. It also combines content from the subscales: Emotional Well-Being (EWD) and Psychosocial Distress (PSD). These constructs are consistent with concepts found in the literature on chronic illness, ESRD, and HD yet; the interactions among the variables present a unique holistic perspective on the resulting impact on quality outcomes. The theoretical constructs were the foundation for the construction of the PPHS and its subscales. Items from the theory were operationalized and examined by content experts, HD patients, and a specialist in adult literacy. The PPHS was modified to increase item clarity, decrease redundancy, and findings supported the use of a 5-point Likert-type scale. The number of items was reduced from 120 to 64. This theory was supported by the patients, the staff, and Gregory et al. (1998).
In 2003, O’Brien-Connors tested the tool with 112 HD patients in Newfoundland. Preliminary analysis supported the reliability and validity of the PPHS. However, length of the PPHS and preliminary results of the factor analysis were of concern. The instrument was modified slightly. Wells (2004) used the PPHS in a descriptive correlational design (N = 60). Following these studies, it was evident that the tool could not reliably and validly assess important aspects of certain constructs.
In the current project, the PPHS has been refined, shortened, and tested. Objectives of this research were to examine data quality and refine the PPHS, as outlined by Ware and Gandek (1998).
Method
Data Collection and Sample
Twomey et al. (2014) used cross-sectional design for data collection that was completed in four HD units in Canada. The accessible population was restricted to patients meeting the following criteria: (a) able to understand and speak English-center HD for at least 12 weeks, (b) mentally competent, (c) not experiencing an acute illness episode, (d) on HD at one of the four site, and (e) above 19 years of age. A convenient sample of 236 was obtained.
Contact with the clients was made by a HD nurse. This was designed to decrease any pressure that the patients may have felt about their decision to become involved in the research study. If the client agreed, a follow-up interview was arranged, and a research assistant was required to explain the purpose of the research, and get a signed consent form. In some sites, the assistant also collected data. The HD unit was the chosen setting as the patients were on HD and the time consumed by the interview would not interfere with their free time. Interviews took approximately 60 to 90 min. Data on demographics, clinical indicators, and comorbidity were collected from the patient and their chart. Human ethical approval including patient rights to confidentiality, anonymity, and storage of data was received from each site (Twomey et al., 2014).
Data Analysis
Twomey et al. (2014) analyzed data using the Statistical Package for Social Sciences (SPSS). Criteria for item inclusion in the subscales were dependent on the items’ theoretical fit, correlation coefficient, and conditions outlined by Ware and Gandek (1998).
A multi-trait/multi-item correlation matrix was used. Sixty-four items, from the original PPHS, were correlated with each other. A set cutoff of between 0.30 and 0.40 was used for examination.
Ware and Gandek’s (1998) conditions were based on item-level and scale-level characteristics. Characteristics were examined in terms of an item’s indices of central tendency, item internal consistency, equality of the item to scale correlations, and item discriminant validity. Examined were gender, education, income, and marital status. Nothing was significantly different (Twomey et al., 2014).
Items considered for removal were not theoretically fit, were below the designated range in the correlation matrix, and/or did not meet the criteria as outlined by Ware and Gandek (1998). Some items, close to the exclusion criteria, were kept in the PPHS when the content experts felt they were theoretically important for evaluating the patients’ experience of life on HD.
Results
Demographics
The sample consisted of 156 patients from Newfoundland (66%) and 80 patients from Ontario (34%). Twomey et al. (2014) found that the patients’ ages ranged from 21 to 91 with a mean age of 59 years. Fifty-four percent of our sample was male. The majority of patients (81%) lived with another adult or a family member.
Correlations
Using a multi-trait/multi-item correlation approach, 64 items in the original PPHS were assessed (Twomey et al., 2014). Removal of 28 items was considered. Five subscales (disease knowledge, activities of daily living, self-health management, allied health support, and family support) were removed because the items had low correlations with their own hypothesized scales and with all other items. In the revised PPHS, the subscale on illness and treatment just measures physical health (PH), social support assesses only formal supports, and adjustment to a new normal remained intact. Twomey et al. decided that the five remaining subscales are the following: EWD, PSD, Nurse Support, Physician Support, and PH.
Item-Level Characteristics
The PPHS was examined using Ware and Gandek’s (1998) criteria. Twomey et al. (2014) found that most of the items had no/minimal missing data and the spread of scores across the rating scales supported data quality. Item descriptive statistics are presented in Table 1. Item scores approximated normalcy, with some skewed more to the lower or higher ends of the subscale (data not shown). Indices of central tendency were assessed. Ware and Gandek suggested that the means of all items, in summative scales, be roughly equal and that the standard deviation be no greater than one. For three subscales, this was true; the PSD and PH subscales were exceptions.
Item Descriptives.
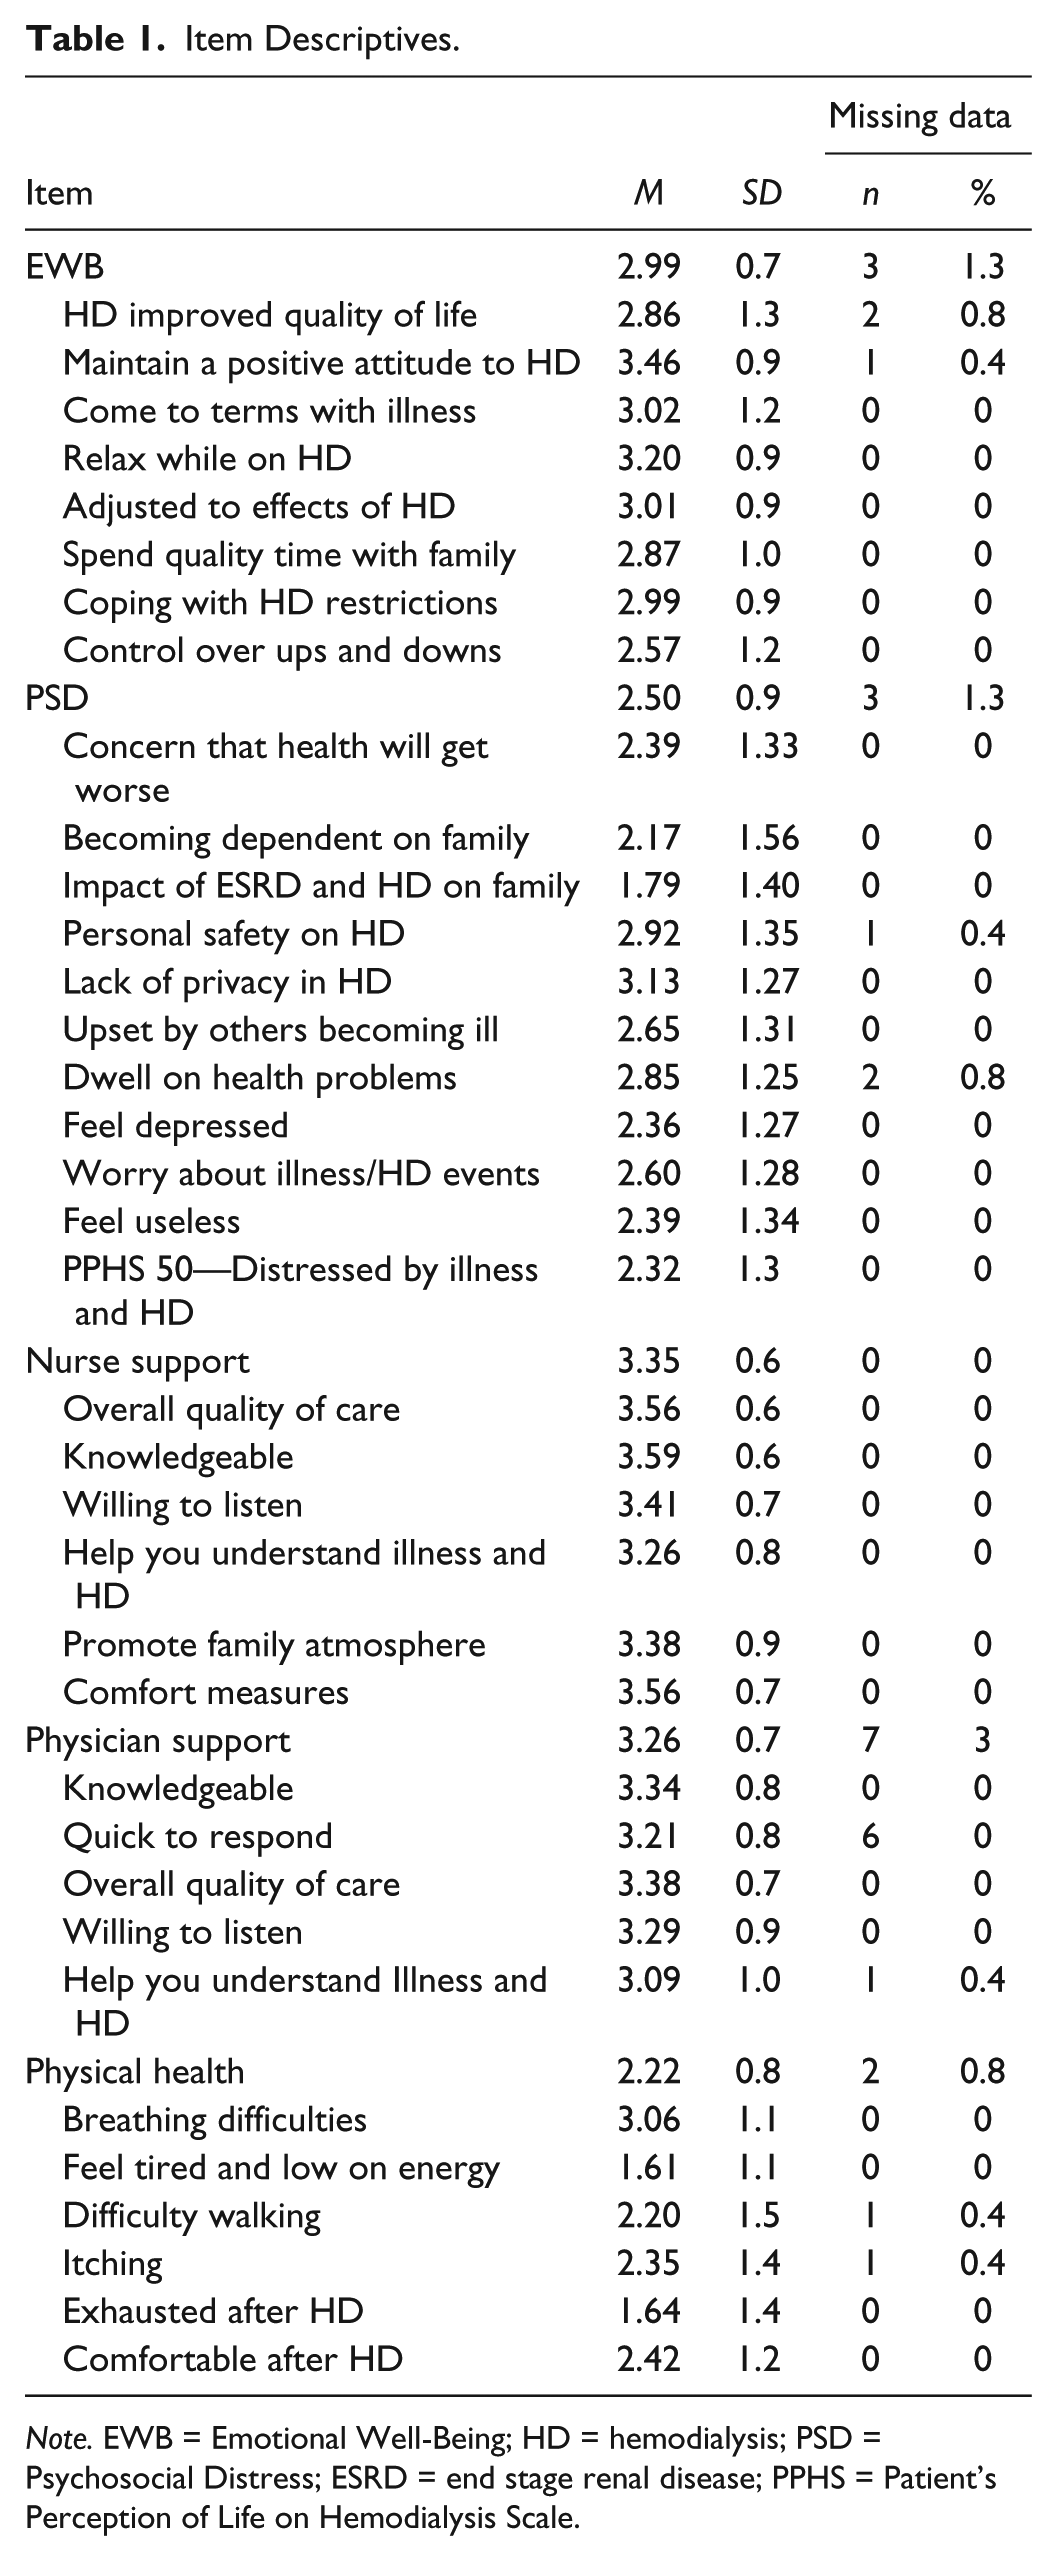
Note. EWB = Emotional Well-Being; HD = hemodialysis; PSD = Psychosocial Distress; ESRD = end stage renal disease; PPHS = Patient’s Perception of Life on Hemodialysis Scale.
Scale-Level Characteristics
Ware and Gandek (1998) define scale-level assumptions that include item internal consistency, equality of item-scale correlations, and item discriminant validity. The first step was examining the correlation between each item and other items in a subscale and the relationship between that item and the subscale itself (see Table 2). A corrected Pearson’s statistic (superscript letter a) is presented as the indicator for each item with the subscales to which it belongs. Ware and Gandek state that each item should be correlated at 0.40 or above with its target subscale to meet this criterion. Only two coefficients (itchiness and feeling comfortable after HD) in the PH subscale, r = .36, were below the criterion (see Table 2). Item internal consistency was also supported by calculating the subscale’s reliability statistic.
Item to Subscale Correlations.

Note. EWB = emotional well-being; PSD = psychosocial distress; Nurse = nurse support; Physician = physician support, PH = physical health; HD = hemodialysis.
Corrected Pearson’s coefficient.
Ware and Gandek (1998) state that the equality of item-scale correlations examines the relationship of all items with their purported subscale. The desired range for correlations is between 0.40 and 0.70 (Ware and Gandek). If the item-scale correlation is below 0.40, the item may not be relevant, whereas, if the statistic is above 0.70, the item may be redundant. All of the item-subscales coefficients, with the exception of the Support subscales, met this criterion
Item discriminant validity assesses the strength of relationship between items included in a scale with items not included in that subscale (Ware & Gandek, 1998). Scale items should have a higher correlation coefficient with their own subscale than with other subscales, and the difference between an item’s coefficient with its subscale and that item’s coefficient with all other subscales should be greater than 0.1. Three subscales met the criteria of discriminant validity while the EWB subscale and the PH subscale did not (see Table 2).
Scale-Level Descriptive Statistics
Each of the five subscales included in the PPHS were constructed to allow for summative scores reflecting the constructs of interest. A higher mean score represents a more positive outcome in all the subscales (see Table 3).
Descriptive Statistics for Subscales’ Transformed Scores.

The score spread or range for each subscale indicates that study participants used response categories from both ends of the Likert-type scale. The floor and ceiling percentages also reflect the range of responses. The Support subscales are definitely skewed to the higher end of the Likert-type scale, again reflecting the patients’ positive perceptions of the health care team.
Discussion
One of the main purposes of this project was to refine an instrument that captured the experience of living with ESRD/HD. The qualitative study gave the research team the theoretical basis for the items included in the PPHS. In 2003, the scale was tested and the resulting psychometric assessment data were promising, but the team wanted a shorter instrument that would be useful for clinical monitoring. The present research was the first step in assessment of the PPHS with a larger HD population. Using a correlation matrix and the guidelines established by Ware and Gandek (1998), PPHS items were examined. Each item was scrutinized and assessed before a decision was made to keep it in the subscale or to discard. The following discussion provides the reader with information related to sample demographics and item and scale examination.
Item and scale assessment of the PPHS resulted in a more valid instrument. Decisions to keep items in the PPHS were based on their correlation coefficients, theoretical fit, and/or the criteria outlined by Ware and Gandek (1998). Inter-item correlations were examined and some items/statements were considered for removal based on their coefficient and theoretical fit.
Item data quality was supported. There was minimal missing data suggesting that the items were relevant, clear, easy to understand, and that the subjects did not have a problem completing scale. Fox-Wasylyshyn and El-Masri (2005) state that it is not so much the amount of missing data that is important, but rather that it is missing at random and not related to a few specific items.
The item score spread approximated normalcy and the indices were roughly equal. Item score distribution was slightly skewed to the upper or lower end of the subscales and responses from both ends of the Likert-type scale were used by the patients. Dispersions are to be expected when measuring fluctuating traits such as feelings of dependence on family members, as the subjects had differing levels and types of support, or in an item such as difficulty walking when patients’ ages ranged from 21 to 91 and there was an array of comorbidities. If an item was heavily weighted at the top or the bottom of the subscale, it may have indicated that the trait was always present or nonexistent in this population and, ultimately, not worth measuring. The scores also give the researcher an idea of the amount of each construct that the sample was experiencing. Again, when measuring constructs with unpredictable states it is not surprising to find variation in their scores as subjects were experiencing different levels of stress and PH. A lower mean subscale score indicates a low to moderate level of the characteristic being measured, whereas a higher mean represents a more positive outcome. Overall, item examination and data quality were positive.
Scale-level assessment included examination of the item internal consistency, equality of item-scale correlations, and item discriminant validity (Ware & Gandek, 1998). Internal consistency of each item was supported by the correlation coefficient. The two outliers in the PH subscale (itchiness and feeling comfortable after HD) are common concerns for HD patient and were left in the subscale because they are symptoms that our subjects had experienced; sometimes too often, they were a theoretical fit and the correlation from the multi-trait correlations was strong.
Twomey et al. (2014) found that correlation statistics supported the equality of items, with three coefficients slightly above the criteria. These items relate to the physicians’ quick response to the clients’ needs, their willingness to listen, and their desire to help the patients understand their illness and HD requirements. After assessing the theoretical fit of individual items and taking into account that each item is measuring a different component of the doctor–patient relationship, it was felt that these items should remain in the subscale. Similar items on the Nurse Support subscale had high scores. These items were retained because they are believed to be an integral part of the support relationship between health care professionals and the client. Keller and Kelvin (2005) agreed that item correlation coefficients fall between .40 and .70; a score below .40 is not sufficiently correlated, and a score more than .70 may be an indication that the questions are possibly redundant.
Item discriminatory power was sustained by the difference in correlations between items within a subscale versus correlations with items in another subscale. Ware and Gandek’s (1998) criteria for item’s discriminant validity states that an item should have a higher correlation coefficient with their own subscale than with other subscales. The EWB subscale and the PH subscale did not meet this criterion. An item of concern in the EWB subscale relates to the coefficient corresponding to “spending quality time with family and friends” that overlapped with the Physician and Nurse Support subscales. These items were kept in the subscale because they are theoretically important; their correlations were good and just below the cut-off coefficient. A possible rationale for these scores is that with approximately 9 to 15 hr each week on HD, patients may come to view the physician and the nurse as their friends. The second item of concern was in the PH subscale “experiencing itchiness.” The correlation of the item with the PH subscale and the PSD subscale did not meet the criteria. A possible explanation for the closely similar statistics is that many of the PSD items were related to illness/HD events and itchiness may be seen as an aspect of the disease. These items will be further scrutinized in future research, and items may be altered slightly to decrease confusion. All other subscale items were correlated at an appropriate level, and it was confirmed that the items/subscales were able to discriminate between different levels of the characteristic being measured. Numerical differences between the coefficients also met the criteria for item discriminatory strength and inclusion.
Twomey et al. (2014) found that scale-level descriptives emphasized the level of satisfaction with health care providers. The formal support subscale means were higher than the three other scales suggesting that the HD population were very happy with the quality of care received, the doctors’- and nurses’ knowledge, and their willingness to listen. The next highest mean related to the HD environment and distress which indicated that patients were experiencing moderate to low levels of stress. The low stress levels may be related to the fact that our population considered themselves healthy, perceived a low level of stress, or had effective coping mechanisms. This was also supported in the mean scores for individual items comprising the two support subscales. This is an important result, and it bodes well for the instrument in terms of identifying areas of concern with the quality of care. During this examination of the subscales, data quality was maintained.
The end result of this process of item refinement is a tighter, more valid PPHS. There was no movement of items between the subscales, and the theoretical underpinning of each subscale was as originally defined in the preliminary analysis. The exception is the PSD subscale that may be divided into two subscales after further research.
Twenty-eight items were removed from the PPHS reducing it to 36 items and five versus 10 subscales. Items relating to activities of daily living, disease knowledge, self-health management, allied health, and family support were removed after examination of their correlation in the multi-trait/multi-item matrix (Twomey et al., 2014). The most surprising loss was the family support subscale as there is a substantial body of research on chronic illness that reinforces the relationship between family support and better outcomes (Cohen et al., 2007; Gregory et al., 1998; Kimmel et al., 1998; Kimmel et al., 1995; Kimmel et al., 1996; Untas et al., 2011). Despite the criteria outlined by Ware and Gandek (1998), some items that did not achieve high scores in the item analysis were deemed theoretically sound and remain in the PPHS. These items may be altered or reworded in future research.
Limitations of the research were the setting and the sample. A drawback of using the HD unit was that at times other patients or staff were close by and subjects may not have felt comfortable answering all questions honestly, especially those about fellow patients or the health care workers. Steps were taken to ensure that patients felt comfortable answering the questions, as a member of the research team not involved in the clients’ care administered the instrument. As well, the majority of the sample represented one province, Newfoundland. The population was not a representative sample of the HD patients; however, the HD group’s demographics are consistent with characteristics of HD patients in Canada in terms of their age, living situation, and gender (CIHI, 2013). Findings are not generalizable to the national HD population but may be interpreted with caution.
Implications
The findings have implications for clinical practice. The PPHS is a valid, reliable, and feasible instrument. It is practical for nephrology professionals to assess the patients’ illness and treatment experience, their perception of formal social support and adjustment to life on HD and to design interventions. Further research is required before the PPHS can be applied as a separate monitoring tool to measure improvements or declines in patients’ experiences in the three main areas.
Conclusion
The PPHS subscales were examined, and the number of items in each subscale was reduced based on statistical indicators and the theoretical underpinning of the item. The subscales are different from each other, yet similar in terms of the characteristics of interest. The final scale is valid and can be considered a suitable measure of the patient’s adjustment to ESRD/HD.
Footnotes
Declaration of Conflicting Interests
The author(s) declared no potential conflicts of interest with respect to the research, authorship, and/or publication of this article.
Funding
The author(s) received no financial support for the research, authorship, and/or publication of this article.