
Abstract
Consumer behavior in e-commerce platforms is one of the extensively researched area. Numerous studies in this field assessed consumer online shopping behavior from various aspects. However, literature review showed that most of the conducted studies do not carry out market segmentation analysis while accessing shopping behavior of online consumers. Therefore, the general conclusions made by these studies about consumer attitude, behavior, and decision-making process might not reflect actual behaviors of different consumer segments. In contrast to previous studies, this study initially carried out psychographic market segmentation analysis and found four different online consumer segments. Later, shopping behavior of each determined segment was assessed by using the developed behavior evaluation model. Findings of this study provide important information to e-retailers about the behavioral characteristics of each consumer segment. E-retailers can utilize this study findings to effectively allocate their marketing resources and design more successful marketing mix for each consumer segment.
Keywords
Introduction
Business-to-consumer (B2C) electronic commerce (e-commerce) allows consumers to directly buy goods and services from online retailers over the Internet. E-commerce technologies help companies expand their marketplace by enabling them rapidly, easily, and cost-efficiently to locate not only more customers but also the best suppliers and the most suitable business partners both nationally and internationally (Chaffey, 2015; Turban, Rainer, & Potter, 2005). On the other side, it increases buyers’ productivity by enabling them to carry out fast, convenient, and price transparent e-commerce transactions with many national and international sellers. The widespread adoption of e-commerce, which provides many benefits for countries ranging from social to economic, plays an important role in the development of countries. It improves the standard of living in rural areas by enabling people to reach the products and services that are not available in their present location. In addition, reduction of market entry and transaction costs, improvement of access to market information, better resource allocation, improvement of international coordination, an open economy stimulating competitions, diffusion of key technologies, less road traffic, and lower air pollution are some other positive impacts of e-commerce on economy and society (Chaffey, 2015; Turban et al., 2005). By considering the above-mentioned benefits of e-commerce, it is no surprise to see a steady increase in the global volume of e-commerce sales which is predicted to reach to US$4.9 trillion by 2021 (eMarketer, 2018).
In developing countries, e-commerce has a potential to add a higher value to businesses and consumers compared with developed countries. However, most companies and consumers in developing countries have failed to get the benefits of e-commerce enhanced by modern information systems and technologies (IS&T; Kshetri, 2007). Recent survey showed that in developing nations, while most of the Internet users use the Internet to socialize and get information, less people use it for e-commerce transactions (Pew Research Center, 2015). In 2017, the share of e-retailing constituted only 9.8% of total retailing sales in developed nations and this figure was only 4.8% in developing nations (TUBISAD, 2017). Financial, logistics, and IS&T infrastructures are vital parts of any e-commerce business operations. Despite the improvements in such infrastructures, e-retailing is not getting enough attention especially in developing countries.
Although IS&T are composed of hard physical technology (i.e., machines, devices), substantial social, organizational, and intellectual investments are required to make them work properly (Laudon & Laudon, 2018). That is, any given IS&T will not get proper attention by its potential users unless users’ behavioral issues are taken into consideration while designing and operating such systems. In e-commerce domain, it has also been realized that very good technical infrastructures and solutions are not enough for e-retailing to be successful in today’s highly competitive business environment. The problem in this domain is not solely technical but mainly behavioral. Therefore, a great deal of researches (Ariffin, Mohan, & Goh, 2018; Changchit, Cutshall, Lonkani, Pholwan, & Pongwiritthon, 2018; Chiu, Wang, Fang, & Huang, 2014; R. Davis, Lang, & Diego, 2014; Dwivedi, Rana, Jeyaraj, Clement, & Williams, 2017; Fortes & Rita, 2016; Huseynov & Yıldırım, 2016a; Y. J. Lim, Osman, Salahuddin, Romle, & Abdullah, 2016; Pappas, Kourouthanassis, Giannakos, & Chrissikopoulos, 2017; Pelaez, Chen, & Chen, 2019; Smith et al., 2013; O. Wang & Somogyi, 2018) were conducted to identify critical factors influencing online consumers’ adoption of e-commerce technologies. Online consumer behavior has been investigated in terms of demographic, psychological, cognitive, and online store–related factors such as design, functionality, content, and so on.
In this field, many segmentation studies (Ballestar, Grau-Carles, & Sainz, 2018; Brengman, Geuens, & Weijters, 2005; Huseynov & Yıldırım, 2017; Ladhari, Gonthier, & Lajante, 2019; Y. Liu, Li, Peng, Lv, & Zhang, 2015; Nakano & Kondo, 2018; Pandey, Chawla, & Venkatesh, 2015; Swinyard & Smith, 2003; Ye, Li, & Gu, 2011) were conducted and the results showed that a general consumer audience is composed of different consumer groups with different psychographic and behavioral characteristics. Despite the common agreement on the existence of different online consumer typologies, extensive literature review showed that while accessing consumers’ behaviors in online shopping platforms, most of the existing studies ignored this fact (Huseynov & Yıldırım, 2016a). Therefore, the general conclusions made by these studies about consumers’ behaviors, attitudes, and decision-making processes might not be valid for broad online consumer audience and might not reflect actual behavior of different consumer segments. Had these studies carried out segmentation analysis on online consumer audience and later assessed each segments behavior separately, they could have provided more reliable results.
In contrast to prior studies, this study aims to fulfill the existing gap in the relevant literature by initially carrying out consumer segmentation analysis to determine different online customer segments as well as their main characteristics. Comprehensive online consumer behavior evaluation model developed within the scope of this study was tested on each determined consumer segment. Segmentation process enhanced with behavior evaluation model is expected to explain much more reliable information about the critical factors influencing the adoption of e-commerce by different online consumer segments. Through the findings of this study, online retailers will have a clear understanding about the characteristics of different consumer segments, so they can positively influence the usage rate of e-commerce services by developing marketing strategies customized to the characteristics of each segment.
In line with the purpose of this study, two research questions were identified:
The rest of the article is organized as follows. Literature review and proposed hypotheses are presented in “Literature Review and Hypotheses” section. “Research Methodology” section describes the methodology of the study including procedures, instruments, study sample, and statistical techniques. “Data Analysis” section is about data analysis in which segmentation process and multigroup structural equation modeling (SEM) analysis are given. Finally, theoretical and practical implications as well as limitations and future research directions are given in “Discussion and Conclusion” section.
Literature Review and Hypotheses
Consumer Typologies
There is a steady growth in the number of Internet users globally. As of June 2018, 55.1% (4.2 billion) of world’s population has Internet access (Internet World Stats, 2018). As the number of Internet users increases worldwide, the size of online consumer audience also increases. This growing trend requires online consumers to be segmented very carefully for marketing efforts to be successful. The main objective of market segmentation is to divide a broad target market into groups of consumers who share common needs, expectations, and interests. Successful market segmentation enables online retailers to customize their products, services, and marketing efforts to appeal more specifically to each segment’s needs, expectations, and motivations.
There are different types of market segmentation approaches such as demographic, behavioral, psychographic, and so on. In demographic segmentation approach, market is segmented according to age, race, religion, gender, family size, ethnicity, income, and education of consumers. While psychographic segmentation groups market according to consumers’ personality traits, beliefs, values, attitudes, expectations, interests, and lifestyles, behavioral segmentation approach clusters consumers according to their actual behavior and the way they respond to, use, or know of a product.
In the relevant literature, researchers carried out various types of market segmentation analysis based on various factors. The prominent ones among these factors are consumer characteristics (Lu, Chang, & Yu, 2013), motivational factors (Ganesh, Reynolds, Luckett, & Pomirleanu, 2010; Hill, Beatty, & Walsh, 2013), cognitive style and involvement (H. C. Wang, Pallister, & Foxall, 2006), Internet usage pattern (Aljukhadar & Senecal, 2011), decision-making style (Rezaei, 2015), shopping intention (O. Wang & Somogyi, 2018), lifestyle (Brengman et al., 2005; Ladhari et al., 2019; Pandey et al., 2015; Swinyard & Smith, 2003; Ye et al., 2011), and online shopping patterns and activities (Ballestar et al., 2018; Huseynov & Yıldırım, 2017; Y. Liu et al., 2015; Nakano & Kondo, 2018; Park & Kim, 2018).
In their study, Swinyard and Smith (2003) carried out psychographic market segmentation analysis in United States based on Internet Shopper Lifestyle scale which they developed within the scope of their study. They identified four online shopper segments and four online non-shopper segments with different characteristics in terms of their perceptions about online shopping. Brengman et al. (2005) cross-culturally validated the Internet Shopper Lifestyle scale of Swinyard and Smith (2003) by replicating the segmentation analysis in the United States and Belgium. Similar consumer segments were also found in both countries. Ye et al. (2011) and Pandey et al. (2015) also replicated the study of Swinyard and Smith (2003) in China and India, respectively. In both of these countries, they showed the existence of different online consumer segments with different behavioral characteristics. Psychographic and behavioral segmentation analysis conducted on Generation Y female online shoppers by Ladhari et al. (2019) identified four different approaches to online shopping and six different shopping profiles each with different objectives. Park and Kim (2018) assessed multichannel shoppers’ purchasing patterns in Korea and the United States. They identified six different clusters in the Korean sample and four different clusters in the U.S. sample. Their study revealed significant difference between shopping patterns of Korean and U.S. consumers.
There also exist studies that carried out market segmentation analysis based on real online shopping activities of consumers that were extracted from online store transaction logs (Ballestar et al., 2018; Huseynov & Yıldırım, 2017; Y. Liu et al., 2015; Nakano & Kondo, 2018). Behavioral segmentation analysis of Y. Liu et al. (2015) which is based on real e-commerce transaction records of Chinese online consumers showed the existence of six different types of online consumers, namely, economical purchasers, active-star purchasers, direct purchasers, high-loyalty purchasers, risk-averse purchasers, and credibility-first purchasers. Huseynov and Yıldırım (2017) carried out behavioral segmentation analysis based on real e-commerce transaction records of Turkish online customers and found five different types of consumer segments that are opportunist customers, transient customers, need-based shoppers, skeptical newcomers, and repetitive purchasers. Both of these studies (Huseynov & Yıldırım, 2017; Y. Liu et al., 2015) showed that each determined online consumer segment has unique behavioral characteristics that differentiate it from other segments.
Results of these psychographic and behavioral studies showed that a broad online consumer audience is not a single market segment. Rather, it is a collection of different consumer segments whose members have different behavioral characteristics in terms of online shopping and respond differently to the marketing efforts.
Based on the findings of previous researches, the following hypothesis is put forward:
Perceived Ease of Use (PEOU) and Perceived Usefulness (PU)
According to the Technology Acceptance Model (TAM; F. Davis, 1989) which is one of the most commonly used theory in information systems literature, there exist several factors that influence users’ decision about whether to use a new technology or not. The most prominent among these factors are the PEOU and PU. While PU refers to the extent to which users perceive that using a particular technology would improve their job performance, PEOU refers to the extent to which users believe that using a particular technology would be effortless. TAM states that PU and PEOU are the fundamental determinants of attitude toward using a new information technology. TAM proposes that when users perceive a new information technology useful and easy to use, then they develop positive attitude toward using this technology. Furthermore, TAM proposes the existence of direct influence of PEOU on PU. That is, it states that when users perceive an information technology as easy to use, they find it to be useful as well. These proposals of TAM got a reasonable support in the relevant literature. A number of studies conducted in different cultural contexts found that PEOU (Agag & El-Masry, 2016; Bigné-Alcaniz, Ruiz-Mafé, Aldàs-Manzano, & Sanz-Blaz, 2008; Changchit et al., 2018; Fortes & Rita, 2016) and PU (Agag & El-Masry, 2016; Bigné-Alcaniz et al., 2008; M. Y. Chen & Teng, 2013; Fortes & Rita, 2016; S. Ha & Stoel, 2009; Pelaez et al., 2019) of online shopping systems positively affect users’ attitudes toward such systems. Numerous studies also showed that PEOU of online shopping systems positively affects PU of such systems (Agag & El-Masry, 2016; Bigné-Alcaniz et al., 2008; Fortes & Rita, 2016; S. Ha & Stoel, 2009; Smith et al., 2013).
Another claim of TAM is that there exists a direct relationship between PU of particular technology and users’ behavioral intention toward using that technology. More specifically, it states that when users perceive a certain technology as useful, then they develop a positive intention toward using such technology. This claim of TAM was also verified by a great number of studies conducted in different cultural contexts (Bigné-Alcaniz et al., 2008; M. Y. Chen & Teng, 2013; Fortes & Rita, 2016; S. Ha & Stoel, 2009; Y. J. Lim et al., 2016; Smith et al., 2013; Yoon, 2009). Studies conducted in the United States and China also showed direct and positive relationship between PEOU and behavioral intention toward using online shopping systems (Smith et al., 2013; Yoon, 2009). That is, users’ perceptions about online shopping systems being easy to use lead them to develop a positive intention toward using them.
Following the TAM and empirical investigations from the existing literature, the following hypotheses are put forward:
Perceived Enjoyment
In an online shopping context, there exist various motivational factors that influence consumers’ attitudes and behavioral intentions toward shopping at online stores. The prominent ones among these factors are consumers’ hedonic and utilitarian online shopping motivations. Hedonic shopping motivation refers to enjoyment, satisfaction, happiness, and similar types of emotions that consumers pursue during online shopping. On the contrary, utilitarian shopping motivation is defined as mission critical, need-based, and goal-oriented. From online consumer point of view, utilitarian benefits of online shopping can be stated as follows: convenience (i.e., saved time and effort), monetary savings, breadth and depth of offered products, and the quality of information obtained about products (Chiu et al., 2014). Both hedonic and utilitarian motivational factors were found to play an important role in influencing consumers’ online shopping intentions (Chiu et al., 2014; R. Davis et al., 2014; C. Kim, Galliers, Shin, Ryoo, & Kim, 2012). In their study, Chiu et al. (2014) found that hedonic and utilitarian motivational factors positively influence consumers’ intentions to repeat their online shopping activities. The studies of Cha (2011) and Elseidi (2018) also found positive and significant relationship between perceived enjoyment and intention to shop online. Perceived enjoyment not only influences consumers’ intention to shop online but also their perceptions about its usefulness. S. Ha and Stoel (2009) found that when consumers enjoy shopping at online stores, they develop positive perceptions about its usefulness. It was also found that when consumers enjoy online shopping, then they develop positive attitudes toward using it (Elseidi, 2018; S. Ha & Stoel, 2009).
Based on the discussion mentioned above, the following hypotheses are put forward:
Perceived Compatibility
In the e-commerce context, compatibility is the extent to which online shopping platforms are perceived to be consistent with the potential adopters’ lifestyle, existing values, previous experiences, expectations, and needs. According to Innovation Diffusion Theory (Rogers, 1995), compatibility is one of the main factors that affect the rate of adoption of an innovation by potential users. This theory states that the higher the perceived compatibility of the particular technology is, the faster the adoption of this technology will be. Study conducted by Vijayasarathy (2004) found a positive relationship between consumers’ attitudes toward online shopping and their perceptions about its compatibility with their existing values and lifestyle. This study showed that consumers whose shopping habits and preferences are better met by other alternatives to physical stores are more inclined to adopt online shopping methods. Other studies conducted in online shopping (Eri, Islam, & Daud, 2011), online banking (Al-Ajam & Nor, 2013), and online travel (Agag & El-Masry, 2016) contexts also found perceived compatibility to be a significant predictor of attitude toward a technology in question. In various information system contexts, a positive association was found between perceived compatibility of new technology and users’ perceptions about its usefulness (Gumussoy, Calisir, & Bayram, 2007; Wu, Wang, & Lin, 2007). Studies also showed that users’ behavioral intention toward using a new technology is positively related to their perceptions about the given technology’s compatibility with their previous experiences, existing values, and needs (Agag & El-Masry, 2016; Wu et al., 2007).
Following the Innovation Diffusion Theory and empirical investigations from the relevant literature, the following hypotheses are put forward:
Perceived Information Security
When compared with traditional commerce, in e-commerce environment, there exists higher anonymity, and there also exists lack of face-to-face interaction between buyers and sellers which creates privacy and security issues (Lian & Lin, 2008). While privacy assures that personal information are collected, processed, protected, and destroyed legally and fairly, security ensures the confidentiality, integrity, and availability of the given information. The privacy and security concerns are main reasons that keep many consumers away from the idea of online shopping (Ariffin et al., 2018; George, 2004; Lian & Lin, 2008). Surveys conducted in different cultural contexts showed that privacy and security issues in e-commerce are among the major concerns of online consumers (Huseynov & Yıldırım, 2016b; Teo, 2002). Privacy concerns were found to negatively affect consumer trust in e-commerce and increase consumers’ risk perceptions about e-commerce (Fortes & Rita, 2016). It was found that privacy of personal information and security of transactions significantly affect the willingness of consumers to shop online (Mapande & Appiah, 2018). Several studies also showed that consumers form positive attitude toward online shopping when they believe Internet is secure for conducting online transactions (Changchit et al., 2018; Eri et al., 2011; Lian & Lin, 2008).
Based on the discussions mentioned above, the following hypothesis is put forward:
Perceived Social Pressure (PSP)
According to Theory of Planned Behavior (TPB; Ajzen, 1991), PSP is one of the main factors that have an influence on individual’s intention to engage in a particular act. PSP indicates in what way the significant referents (e.g., relatives, friends, and media) influence the individuals’ particular behavior. Determinants of PSP can be categorized as interpersonal influence and external influence (Bhattacherjee, 2000). Interpersonal influence emerges from word-of-mouth influence by friends, colleagues, superiors, and other prior adopters while external influence emerges from mass media reports, expert reviews, and opinions. Studies in the relevant literature showed that PSP exerts a positive impact on consumers’ behavioral intention to shop online (Crespo & Bosque, 2008; Dwivedi et al., 2017; H. Kim, Kim, & Shin, 2009; Y. J. Lim et al., 2016; Lin, 2007). Studies of H. Kim et al. (2009) and Dwivedi et al. (2017) also showed that PSP significantly and positively influences attitude toward carrying out transactions on such platforms.
Following the TPB and empirical investigations from the existing literature, the following hypotheses are put forward:
Attitude Toward Online Shopping
Behavioral intention is about individuals’ readiness to engage in a particular behavior. Behavioral intention plays an important role in influencing individuals’ actual behavior. TAM (F. Davis, 1989) states that intention of individuals is a major determinant of their actual behavior, and intention itself is a function of individuals’ attitude toward a particular behavior. TPB also proposes the existence of a direct relationship between attitude toward behavior and intention to engage in a particular behavior. In the literature, a lot of studies applied TAM and TPB in various information systems contexts and confirmed what these two models suggest about the relationship between attitude and behavioral intention. Many studies (Bigné-Alcaniz et al., 2008; Dwivedi et al., 2017; Elseidi, 2018; Eri et al., 2011; Fortes & Rita, 2016; S. Ha & Stoel, 2009; O. Wang & Somogyi, 2018) found that individuals’ favorable attitudes toward online shopping positively influence their behavioral intention toward online shopping.
Following the propositions of TAM, TPB, and empirical investigations from the relevant literature, the following hypothesis is put forward:
Research models of the study are given in Figure 1. There are eight constructs in the model. While PU of online shopping, attitude toward online shopping, and behavioral intention to shop online are dependent variables, perceived enjoyment, PEOU, perceived compatibility, perceived information security, and PSP are independent variables. This model was tested separately for each segment determined as a result of psychographic segmentation analysis. Testing the developed model separately on each segment further helps to understand the differences between various segments in terms of their perceptions about online shopping.

Research model.
Research Methodology
Survey Instruments
This study makes use of quantitative research techniques; therefore, Likert-type surveys were administered to collect necessary data for the research. Participants of the study were required to fill two kinds of surveys. One of the surveys was used in psychographic segmentation process. Measurement scale of the segmentation survey changed between 1 (strongly disagree) and 5 (strongly agree). Survey items used in segmentation analysis were based on Internet Shopper Lifestyle scale of Swinyard and Smith (2003), which is a very strong scale with cross-cultural validation. The second survey was used to collect necessary data for theoretical model testing. Measurement scale of this survey changed between 1 (strongly disagree) to 7 (strongly agree). Survey items measuring PEOU (Cha, 2011; Juniwati, 2014), PU (Cha, 2011; Juniwati, 2014), perceived enjoyment (Cha, 2011), perceived information security (Flavian & Guinaliu, 2006; O’Cass & Fenech, 2003), perceived compatibility (Taylor & Todd, 1995), PSP (Järveläinen, 2007), attitude (Taylor & Todd, 1995), and behavioral intention (W. M. Lim & Ting, 2012; Lin, 2007) were retrieved from relevant literature and adapted to this study.
Study Sample
Participants of the study were limited to university students. Non-probability convenience sampling technique was utilized in selecting the respondents of the study. That is, respondents were chosen based on their ease of access. During the 4-month time period, 1,027 usable responses were obtained. In terms of gender distribution, the majority of respondents were female (57.6%). In regard to age group, most of the respondents aged from 18 to 20 years (50.2%), and in regard to educational level, most of the respondents were undergraduate students (82.9%). The majority of the respondents (88.9%) reported to have online shopping experience.
Procedures
Data collection was carried out at four universities located in Ankara, the capital city of Turkey. University students were distributed questionnaires in two forms: printed hard copy and electronic copy. Printed hard copies were distributed within faculties. On the contrary, electronic surveys were prepared by using online survey service and sent to student mail groups. Before filling the survey, the participants of the research were informed about the purpose of the study, what to be done within the scope of the study, potential benefits and risks involved, and confidentiality of provided responses.
Statistical Techniques
The main statistical tools used in this study are exploratory factor analysis (EFA), confirmatory factor analysis (CFA), SPSS two-step cluster analysis, and multigroup structural equation modeling (SEM). In psychographic segmentation process, SPSS two-step cluster analysis technique was utilized. The strength of this technique is that it can handle large datasets with both categorical and continuous variables (SPSS Inc., 2001). This technique is also capable of automatically determining optimal number of clusters given the input variables. Multigroup SEM technique was utilized to test developed theoretical model for each determined consumer segment. Multigroup SEM analysis allowed to test whether the different consumer segments have significant differences in the causal relationships put forward by the developed behavior evaluation model. SEM analysis was carried out by using IBM SPSS AMOS version 22.
Data Analysis
EFA
EFA was conducted to generate the dimensions of Internet Shopper Lifestyle scale. A principal axis factor analysis with orthogonal rotation (varimax) was conducted on the 23 scale items. Seven factors were found to have eigenvalues over Kaiser’s criterion of 1 and in combination explained 67.47% of the variance. The seven factors were labeled as follows: Privacy and Security Fear represents the extent to which consumers are worried about privacy of their personal information and security of their financial details in online shopping, e-Commerce Convenience represents how convenient online shopping is for consumers, Shopping at Physical Stores denotes the extent to which consumers like and enjoy shopping at physical stores, e-Commerce Self-Inefficacy denotes the extent to which consumers perceive online shopping to be difficult to understand and use, e-Commerce Logistics Issues indicates the extent to which consumers perceive online shopping as problematic in terms of product delivery and product refund processes, Internet Window Shopping refers to browsing of online products or services by consumers without a purchase intention, and e-Commerce Offers refers to the extent to which consumers believe that online stores provide better alternatives and better prices than physical stores (Table 1). For reliability analysis, Cronbach’s alpha was utilized. Reliability scores of all constructs were above the minimum requirement of .60.
Exploratory Factor Analysis on Internet Shopper Lifestyle Scale.

Segmentation Analysis
In this study, SPSS two-step clustering approach was utilized to carry out segmentation analysis. The factors determined as a result of EFA on Internet Shopper Lifestyle scale were used as input in the two-step clustering analysis. Along with these factors, three different themes of Internet usage (i.e., entertainment activities, information gathering, e-commerce activities) of respondents were also included in clustering analysis. The Anderson–Rubin coding method was utilized to produce each respondent’s factor scores on each determined factor. The Anderson–Rubin method produces factor scores which are standardized (i.e., M = 0 and SD = 1) and uncorrelated. Clustering analysis was run with log-likelihood distance measure and Schwarz’s Bayesian information criterion (BIC). The two-step clustering algorithm suggested four segments to be extracted from the data (Table 2). The results of cluster analysis provided enough evidence to accept Hypothesis 1. To visually show each segments’ average score on each factor, a radar chart was created (Figure 2). The value 0.0 in the chart represents entire sample mean and the numbers higher or lower than 0.0 show the number of standard deviations from the entire sample mean. The four determined segments are Shopping Lovers, Direct Purchasers, Suspicious Browsers, and Incompetent Consumers. These segments are given appropriate names by taking into consideration their average scores on various factors.
The Two-Step Cluster Analysis Result.

Standardized values (0.00 represents the entire sample average and +/– represents number of standard deviations above or below the entire sample average).
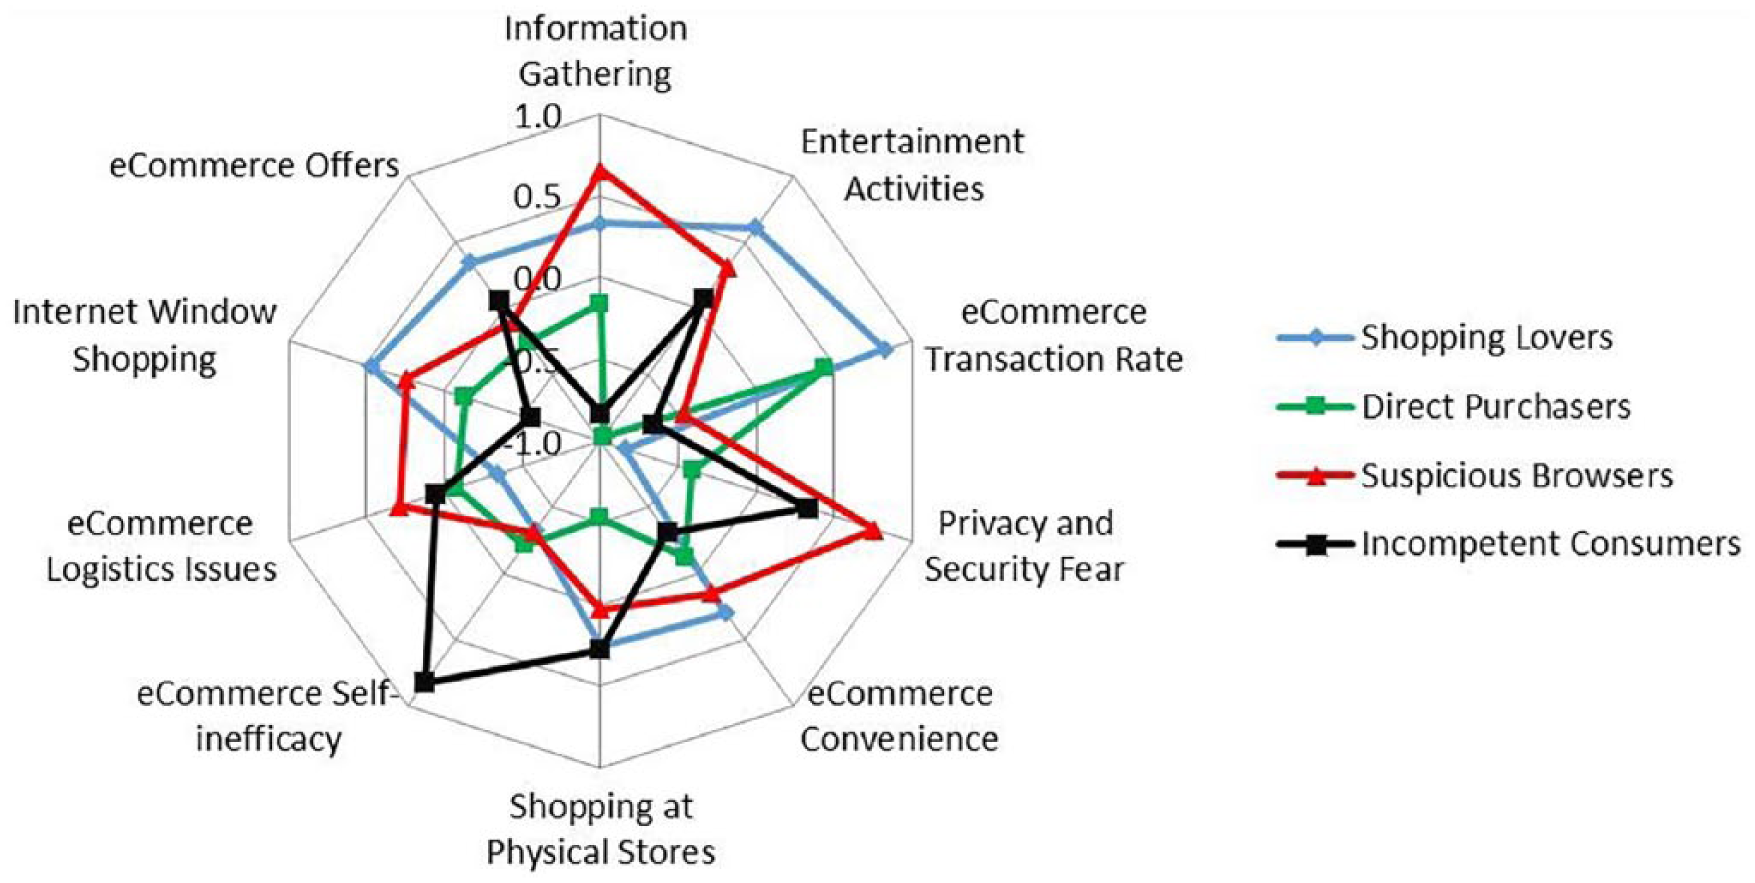
Radar chart (psychographic segments).
Shopping Lovers mostly spend their time on entertainment portals and social networking platforms on the Internet (EA = 0.61). This segment knows how to use online stores and place online orders very well (EI = −0.33). Perceived convenience of e-commerce is another factor which is reported to be very high for this segment (EC = 0.30). That is, this type of consumers stated that they do not have to leave home during online shopping and no transportation means are required to visit such stores. Furthermore, this segment thinks that online shopping platforms offer better prices and better product options than physical stores (EO = 0.35). Consumers in this segment do not worry as much as other consumers about the security of their private and financial information during online e-commerce transactions (PSF = −0.84). This type of consumers also does not have much worries about the delivery process of online products, the online shipping charges, and the complexities of returning online products (ELI = −0.34). As a consequence of the above-mentioned characteristics of consumers in this segment, it is not surprising that their reported e-commerce transaction rate is the highest one among four determined consumer segments (ETR = 0.82). Consumers in this segment actively use the Internet to purchase products and services. They also tend to visit online stores to examine products without any purchasing intention (IWS = 0.48).
Direct Purchasers, in contrast to Shopping Lovers, generally do not spend time on entertainment portals and social networking platforms on the Internet (EA = −0.97). They generally do not enjoy shopping at physical stores (SPS = −0.53). They prefer to meet their shopping needs over online stores as their online shopping rate was found to be above the average (ETR = 0.44). In contrast to Shopping Lovers, Direct Purchasers do not like spending time on looking through online products without any purchasing intent (IWS = −0.13). They visit the online stores with specific products in mind and purchase these products. Furthermore, this type of consumers does not think that online shopping platforms offer better prices and better product options than physical stores (EO = −0.25). Consumers in this segment do not have much concerns about the security of their private and financial information during online shopping (PSF = −0.41). Direct Purchasers know how to use online shopping websites and to place online orders very well (EI = −0.21).
Suspicious Browsers mostly spend their time on entertainment portals, social networking platforms, search engines, news portals, and email services on the Internet (EA = 0.32; IG = 0.66). Even though consumers in this segment agree with the idea that shopping on the Internet provides convenience and time-saving benefits (EC = 0.15), they usually do not prefer to purchase products and services over online shopping platforms (ETR = −0.47). Their unwillingness to adopt online shopping is not due to the perceived complexities of e-commerce (EI = −0.31). However, low level of e-commerce transactions rates in this segment can be related to this segment’s high level of distrust toward Internet (PSF = 0.76). This segment of consumers is concerned about the privacy of their personal information and the security of their financial details during online transactions. Furthermore, this type of consumers is also concerned about the delivery of products bought online and they think returning process of online products is complex (ELI = 0.29). Even though this segment agrees that shopping on the Internet provides convenience and time-saving benefits, their distrust toward Internet and their worries related to delivery and return process of online products prevent them from shopping online. Instead of making online purchases, this type of consumers most of the time uses online stores to learn about various types of products and services and discover the latest trends (IWS = 0.25).
Incompetent Consumers generally do not use search engines, news portals, and email services on the Internet (IG = −0.83). This type of consumers is not good at using online stores to purchase products or services (EI = 0.82). They think that it is difficult to learn placing orders at online stores. Therefore, e-commerce transaction rate of this segment was found to be well below the average (ETR = −0.66). Looking at the available products without any purchasing intent was also not found to be among the habits of this segment (IWS = −0.55). Consumers in this segment have fears related to online shopping due to perceived privacy and security issues on the Internet (PSF = 0.33). In addition, they do not think that online stores provide convenience in terms of shopping (EC = −0.31).
Multigroup SEM
The four consumer segments determined as a result of psychographic segmentation analysis were further analyzed through developed research model by conducting multigroup SEM analysis. To assess the reliability of the model constructs, composite reliability (CR) was utilized. Value of 0.7 and greater for CR was suggested for factor to be considered as reliable (Hair, Anderson, Tatham, & Black, 1998). CR values in all segments were found to be well above 0.7, which indicates that model constructs were reliable across the four segments. To assess convergent validity, average variance extracted (AVE) value of each construct was checked. Convergent validity refers to the extent to which measures of a construct that theoretically assumed to be related are in fact reasonably related. AVE should be 0.5 or greater for adequate convergent validity (Hair, Black, Babin, Anderson, & Tatham, 2006). Table 3 shows that in all segments, AVE values are either equal to or above 0.5. Based on the results of AVE, it can be concluded that convergent validity was satisfied. Discriminant validity ensures that there exists a low correlation between factors that assumed to be different. Discriminant validity is satisfied when square root of each factor’s AVE is higher than its correlations with other factors (Fornell & Larcker, 1981). In all given consumer segments, square root of each factor’s AVE is higher than its correlations with the other factors.
Construct Reliability Analysis.
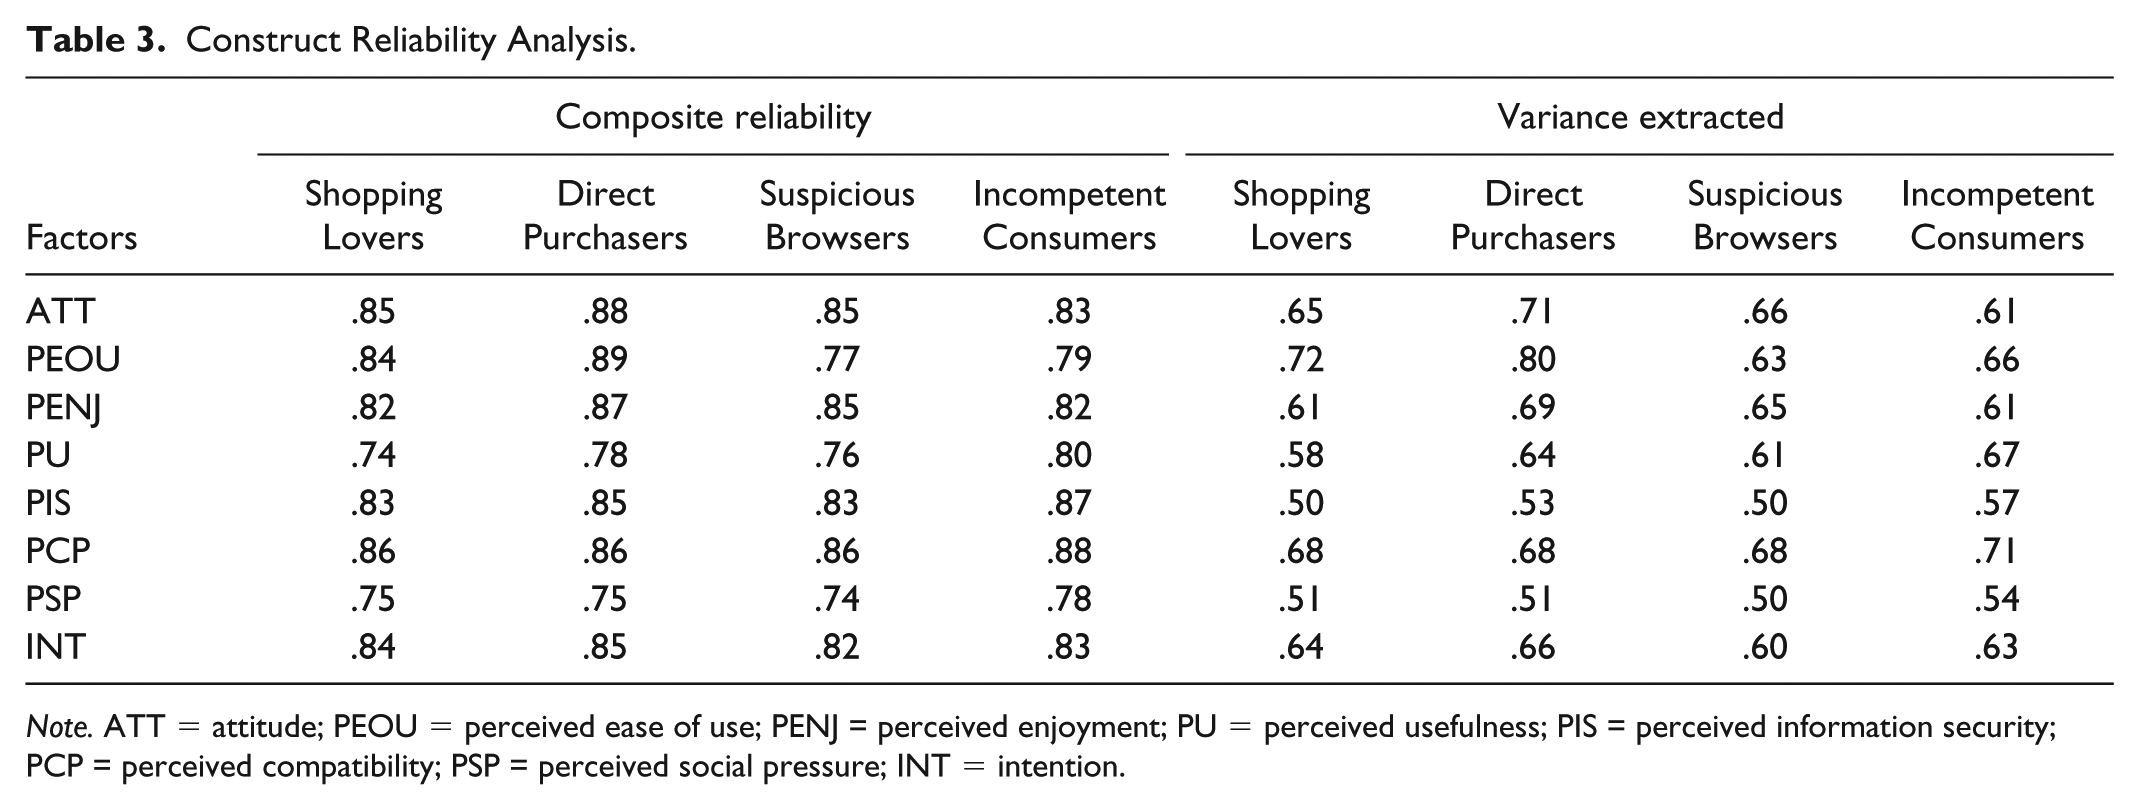
Note. ATT = attitude; PEOU = perceived ease of use; PENJ = perceived enjoyment; PU = perceived usefulness; PIS = perceived information security; PCP = perceived compatibility; PSP = perceived social pressure; INT = intention.
Testing for measurement and structural invariance
The first step in multigroup SEM analysis is the determination of the baseline model. Determination of the baseline model is not subject to the between-group constraints; therefore, its data analysis was carried out separately for each determined consumer segments (Byrne, 2010). Single-group CFA which is conducted (Table 4) in SPSS AMOS 22 resulted in a well-fitting hypothesized model in which 24 items were retained.
Goodness-of-Fit Indices of Single-Group CFA.

Note. CFA = confirmatory factor analysis; CMIN/DF = chi-squared mean/degrees of freedom; CFI = comparative fit index; NFI = normed fit index; TLI = Tucker–Lewis index; RMSEA = root mean square error of approximation.
The second step in multigroup SEM analysis is testing for configural invariance. Model tested in this step is a multigroup representation of the baseline model. While testing for multigroup equivalence, no equality constraints were enforced on any parameters of the model. The fit of this configural model provides the baseline value which can later be compared with follow-up (i.e., constrained) models (Byrne, 2010). Multigroup model testing for configural equivalence resulted in the following goodness-of-fit statistics: χ2 = 1,382.867 with 872 degrees of freedom, chi-squared mean/degrees of freedom (CMIN/DF) = 1.586, comparative fit index (CFI) = 0.962, Tucker–Lewis index (TLI) = 0.952, normed fit index (NFI) = 0.905, and root mean square error of approximation (RMSEA) = 0.025. By taking into consideration these goodness-of-fit statistics, it can be stated that the hypothesized multigroup model is considerably well-fitting across four determined segments.
Measurement and structural invariance tests assessed whether the parameters in the measurement and structural components of the model are invariant across the four segments. The main steps involved in invariance testing were as follows. In the first step, namely, measurement model, factor loadings were constrained to be equal and a model was run. If total change in the value of goodness-of-fit indices provides enough evidence that groups are equivalent in terms of factor loadings, then the second step is taken. In the second step, namely, structural model, factor loadings along with factor variances and covariances were constrained equal and the model was run. Once again, total change in the value of goodness-of-fit indices was checked to conclude whether groups are equivalent in terms of variance and covariance structures. Goodness-of-fit statistics for multigroup invariance testing are provided in Table 5.
Goodness-of-Fit Indices of Multiple-Group CFA Invariance Testing.

Note. Model A: configural model (unconstrained baseline model); Model B: measurement model (factor loadings are constrained to be equal); and Model C: structural model (factor loadings, factor variances, and factor covariances are constrained to be equal). CFA = confirmatory factor analysis; CMIN/DF = chi-squared mean/degrees of freedom; CFI = comparative fit index; TLI = Tucker–Lewis index; RMSEA = root mean square error of approximation.
While assessing the invariance of factor loading (i.e., measurement invariance), Model A which is configural baseline model free from any constraints was compared with Model B in which only factor loading was constrained to be equal. The difference of χ2 between Model A and Model B was significant (∆χ2 =77.2, ∆df = 42, p < .01). However, because χ2 difference test is very sensitive to the sample size (Teo & Liu, 2007; Whisman & Judd, 2016) and to the complexity of model, differences in CFI, TLI, and RMSEA were taken into consideration as an alternative criterion. Cheung and Rensvold (2002) and F. F. Chen (2007) recommended using CFI, TLI, and RMSEA in assessing the measurement and structural invariance. Cheung and Rensvold (2002) recommended that to ensure invariance across groups, total change in the value of CFI should not exceed .01. F. F. Chen (2007) stated that a change of .01 or more in CFI and TLI, and a change of .015 or more in RMSEA, is an indication of non-invariance across groups. The CFI difference between Model A and Model B was .003, and this value met Cheung and Rensvold’s (2002) recommended benchmark point of .01 for CFI change. The change in the value of TLI was .001 and the change in RMSEA was less than .015, and these changes met the recommended benchmark points proposed by F. F. Chen (2007). These changes in the value of CFI, TLI, and RMSEA implied that the factor loadings were the same for the four determined consumer segments. On the contrary, to assess equivalence of variance and covariance structure (i.e., structural invariance) across groups, Model B was compared with Model C. The CFI, TLI, and RMSEA differences between Model B and Model C were .009, .000, and .001, respectively. These differences met the recommended benchmarks of F. F. Chen (2007) and implied that factor variance and covariance structure was invariant across four segments.
Testing for the invariance of a causal structure
Measurement and structural invariance tests showed that factor loadings, and variance and covariance structure, were the same across the four segments. After ensuring measurement and structural invariance across groups, the next step involves testing for the invariance of causal paths across all segments. This test ensures that strength of relationships among model constructs holds across four segments. Initially, unconstrained model, Model A, was estimated without imposing any constraints on any model parameters. Later, constrained model, Model B, was estimated by imposing equality constraint on all causal paths across four segments (Bollen, 1989). Goodness-of-fit statistics of unconstrained Model A were above the recommended thresholds (Table 6). That is, CFI > .95, TLI > .95, and RMSEA < .05 imply that the current structural model applies well across all segments. The difference of CFI between Model A and Model B was found to be .004 (i.e., less than .01) which means that causal path structure was the same across all segments.
Goodness-of-Fit Indices of Multigroup SEM Analysis for Causal Structure.

Note. Model A: unconstrained model and Model B: causal (i.e., structural) paths are constrained to be equal. SEM = structural equation modeling; CMIN/DF = chi-squared mean/degrees of freedom; CFI = comparative fit index; TLI = Tucker–Lewis index; RMSEA = root mean square error of approximation.
Hypotheses testing
This research makes use of unstandardized coefficients to discuss the results of the study. When carrying out comparisons across different groups, the variances of the variables may exhibit differences. In this situation, using unstandardized coefficients are more meaningful as they are expressed in terms of construct’s scale and enable to carry out comparisons across various groups (Hair et al., 1998). In the structural model given in Figure 3, unstandardized coefficients and their significance levels were provided. While unstandardized coefficients and significance levels were provided on arrows, squared multiple correlations were given inside the latent variables. Squared multiple correlation shows the percentage of variance explained in dependent variable by independent variables. Table 7 provides goodness-of-fit statistics of structural model for each determined consumer segment. For each given consumer segment, CMIN/DF, CFI, TLI, and RMSEA values are within the recommended ranges.

Structural model.
Goodness-of-Fit Indices of Structural Model.
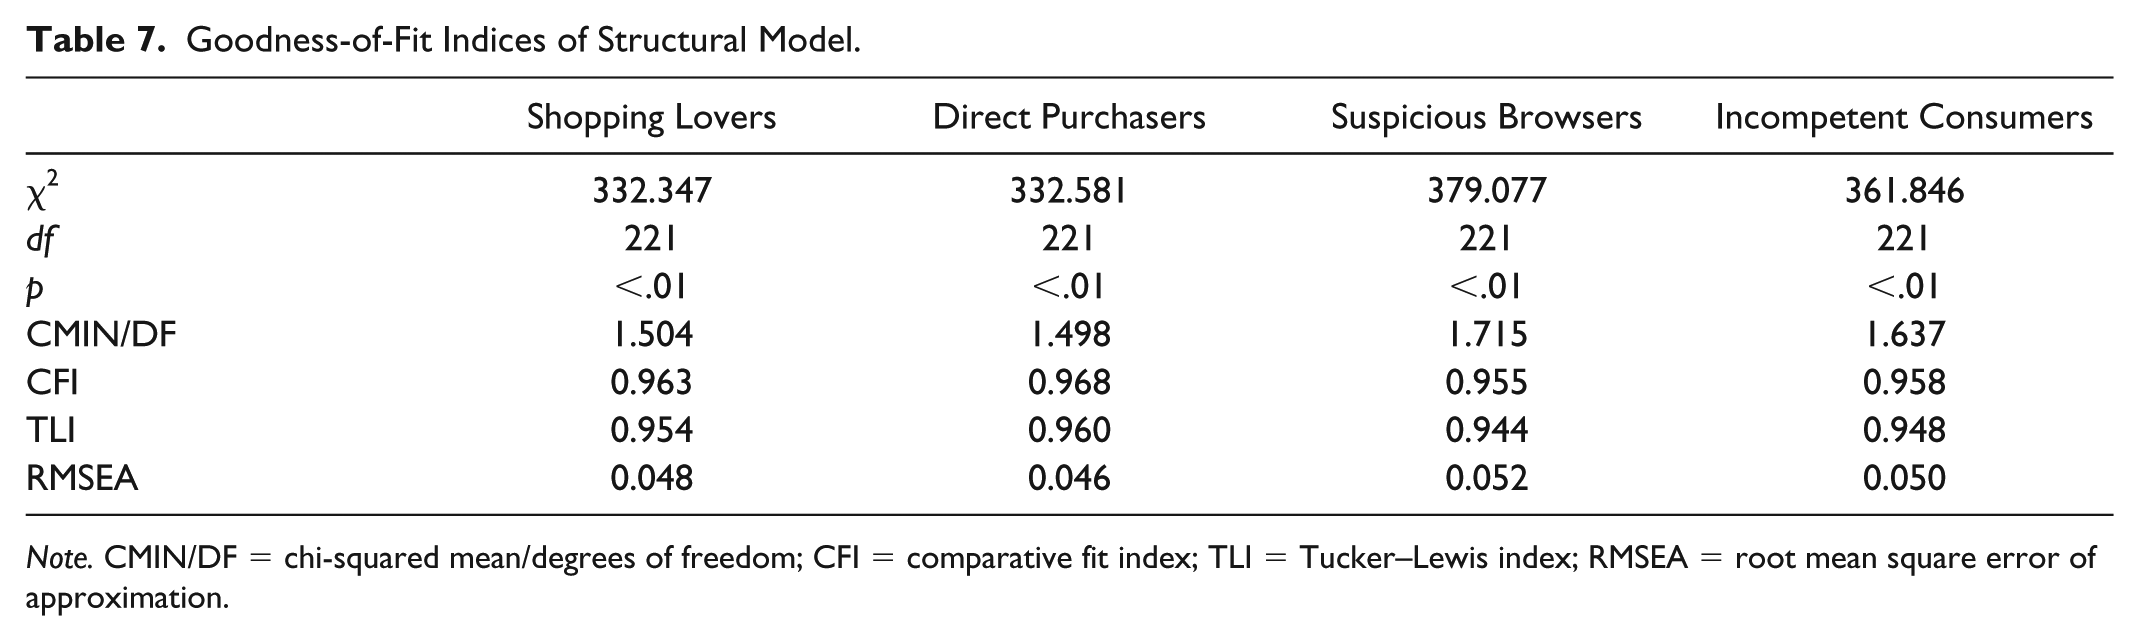
Note. CMIN/DF = chi-squared mean/degrees of freedom; CFI = comparative fit index; TLI = Tucker–Lewis index; RMSEA = root mean square error of approximation.
In all segments, PEOU (H2a: βShopLov = 0.446, βDirPur = 0.410, βSusBrw = 0.229, βIncCons = 0.432, p < .01), perceived enjoyment (H4a: βShopLov = 0.120, βDirPur = 0.113, p < .05; βSusBrw = 0.184, βIncCons = 0.258, p < .01), and perceived compatibility (H5a: βShopLov = 0.482, βDirPur = 0.436, βSusBrw = 0.370, p < .01; βIncCons = 0.234, p < .05) were found to have positive and significant relationships with consumers’ perceptions about usefulness of B2C online shopping.
In all segments, PU (H3a: βShopLov = 0.521, βDirPur = 0.514, βSusBrw = 0.333, βIncCons = 0.415, p < .01), compatibility (H5b: βShopLov = 0.358, p < .05; βDirPur = 0.514, βSusBrw = 0.493, βIncCons = 0.281, p < .01), and PSP (H7a: βShopLov = 0.206, βDirPur = 0.190, βSusBrw = 0.185, βIncCons = 0.173, p < .01) were found to have positive and significant relationships with consumers’ attitude toward B2C online shopping.
Positive and significant relationship between perceived information security and attitude toward online shopping was found only for Shopping Lovers (H6: βShopLov = 0.167, p < .05) and Incompetent Consumers (H6: βIncCons = 0.171, p < .01). However, PEOU (H2b: βShopLov = −0.099, βDirPur = −0.008, βSusBrw = 0.086, βIncCons = −0.013, p > .05) and perceived enjoyment (H4b: βShopLov = 0.023, βDirPur = −0.045, βSusBrw = 0.019, βIncCons = 0.042, p > .05) were found to be unrelated with attitude toward online shopping.
In all segments, statistically strong and positive relationship was found between attitude toward online shopping and behavioral intention to shop online (H8: βShopLov = 0.731, βDirPur = 0.711, βSusBrw = 0.466, βIncCons = 0.830, p < .01). However, PEOU (H2c: βShopLov = −0.096, βDirPur = 0.083, βSusBrw = 0.041, βIncCons = 0.014, p > .05) and PU (H3b: βShopLov = 0.301, βDirPur = 0.073, βSusBrw = 0.119, βIncCons = −0.323, p > .05) did not show any significant relationship with intention to shop online for all consumer segments.
For certain segments, perceived enjoyment (H4c: βSusBrw = 0.133, p < .05; βIncCons = 0.312, p < .01), compatibility (H5c: βSusBrw = 0.430, p < .01), and PSP (H7b: βSusBrw = 0.157, p < .01) were found to have positive and significant relationship with behavioral intention to shop online. The summary of the hypotheses testing for each segment is provided in Table 8.
Hypotheses Testing Results.
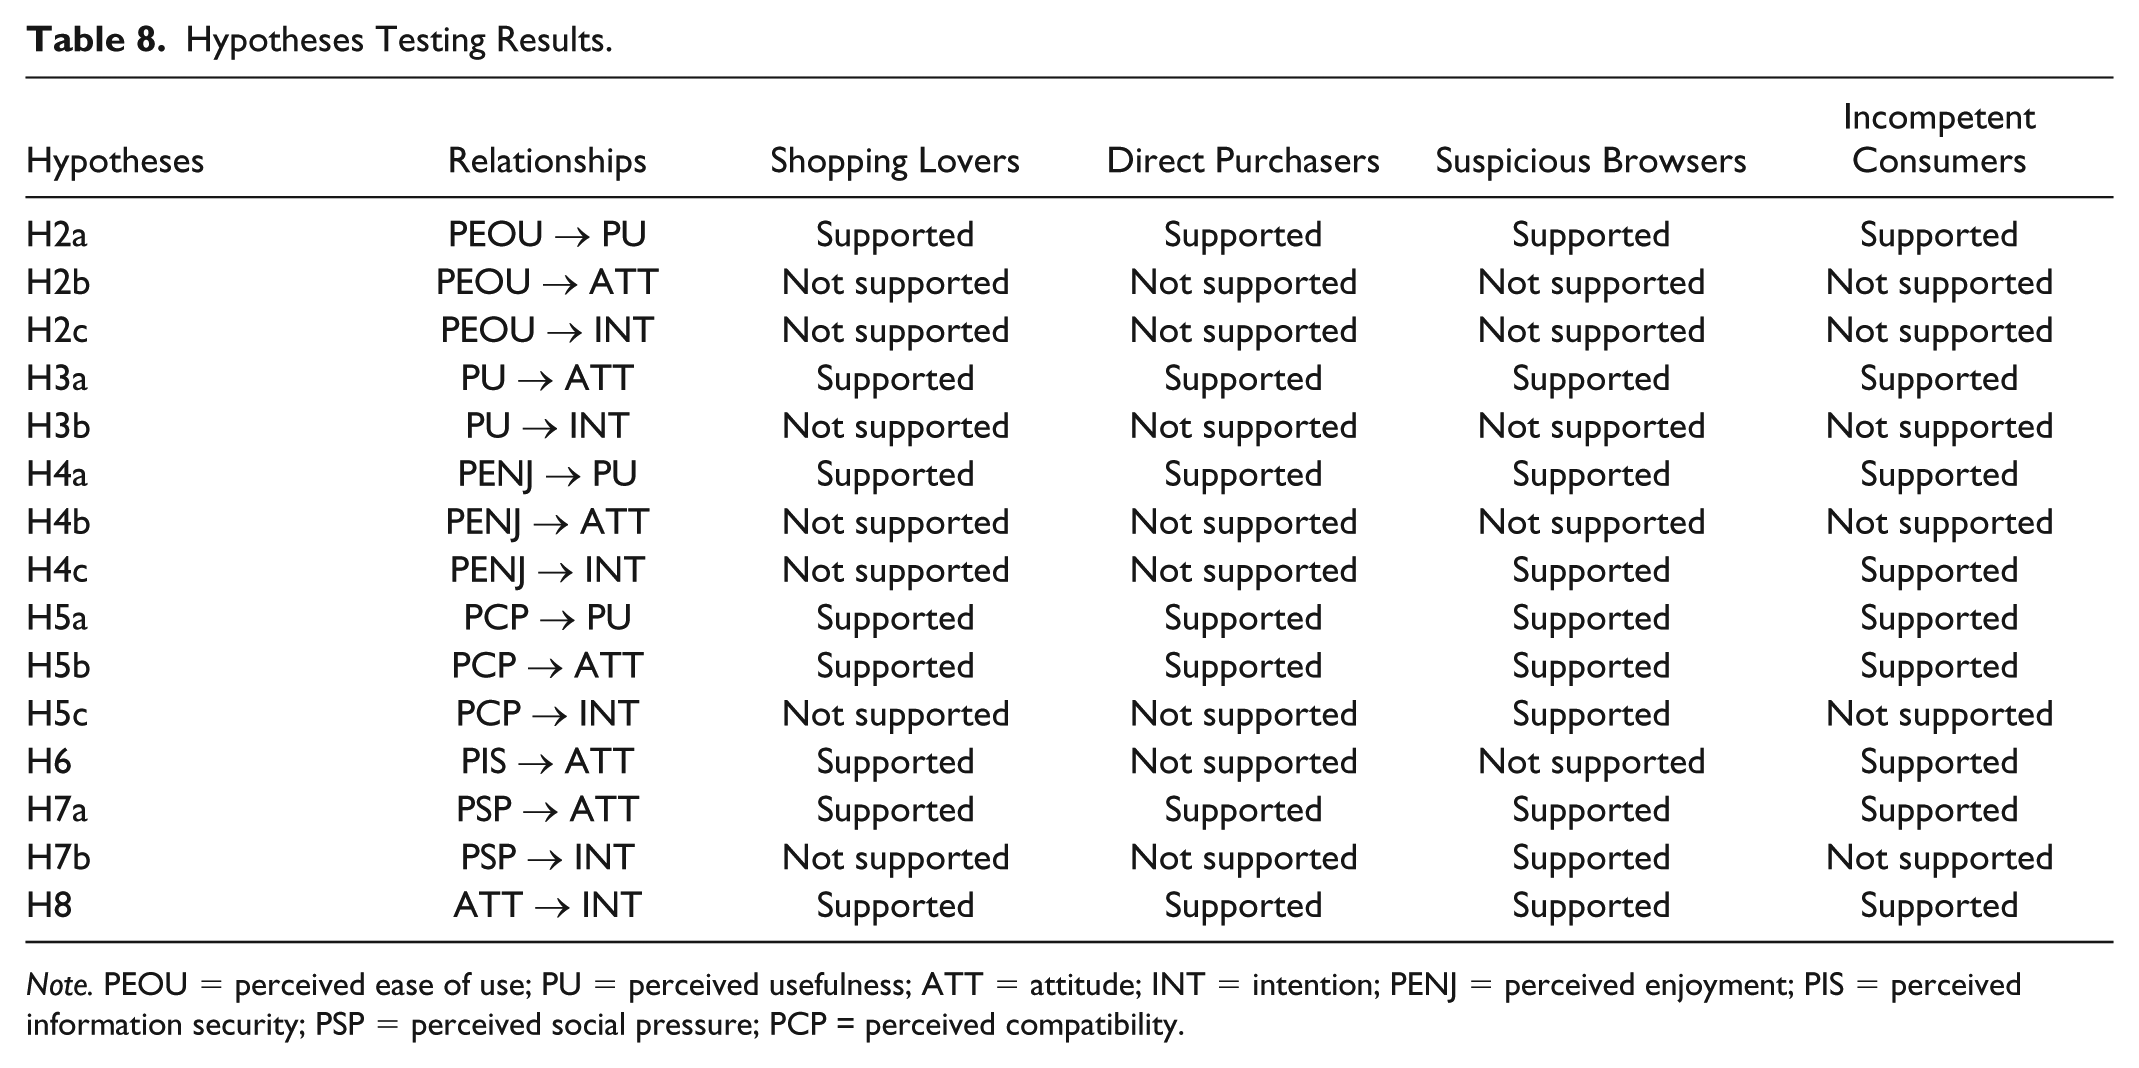
Note. PEOU = perceived ease of use; PU = perceived usefulness; ATT = attitude; INT = intention; PENJ = perceived enjoyment; PIS = perceived information security; PSP = perceived social pressure; PCP = perceived compatibility.
Discussion and Conclusion
Theoretical Implications
This research differs from the previous studies in the relevant literature significantly. While accessing consumers’ online shopping behavior, most of the prior studies assumed that online consumer audience is composed of a single type of consumers who share similar characteristics in their perception of e-commerce. Unlike prior studies, rather than treating online consumer audience as a single homogeneous group, this study initially carried out psychographic segmentation analysis to identify different online consumer typologies, and four different online consumer segments were identified. These online consumer segments are Shopping Lovers, Direct Purchasers, Suspicious Browsers, and Incompetent Consumers. Results of this study confirm the findings of prior psychographic (Ganesh et al., 2010; Hill et al., 2013; Ladhari et al., 2019; Pandey et al., 2015; Park & Kim, 2018; Swinyard & Smith, 2003; Ye et al., 2011) and behavioral (Ballestar et al., 2018; Huseynov & Yıldırım, 2017; Y. Liu et al., 2015; Nakano & Kondo, 2018) segmentation studies on the existence of diverse consumer groups with different characteristics in their perception of e-commerce. This study contributes to the literature by adding four new psychographic segments in addition to previously identified ones by other researchers.
After determining the online consumer segments, proposed conceptual model was tested on each segment separately. Testing the proposed conceptual model separately on each determined segment helped to present findings which are valid for a particular consumer segment rather than generalizing them for entire consumer audience. Therefore, the findings of this study are more reliable when compared with prior studies that did not take into consideration the existence of different consumer typologies while assessing the factors influencing the adoption of e-commerce.
Results of the study showed that in all segments, statistically significant and positive relationship exists between attitude toward online shopping and behavioral intention to shop online. This finding verifies the prior studies (Agag & El-Masry, 2016; Bigné-Alcaniz et al., 2008; Dwivedi et al., 2017; Elseidi, 2018; Eri et al., 2011; Fortes & Rita, 2016; S. Ha & Stoel, 2009; O. Wang & Somogyi, 2018) on the important role of attitude in forming online shopping intention. However, unlike previous studies (M. Y. Chen & Teng, 2013; Fortes & Rita, 2016; Y. J. Lim et al., 2016; Smith et al., 2013), in none of four determined consumer segments significant relationship was found between PU of online shopping and behavioral intention to shop online.
In this study, it was found that in all segments, consumers’ perceptions about usefulness of online shopping, compatibility of online shopping with consumers’ lifestyle, and PSP to engage in online shopping are positively related to formation of favorable attitudes toward online shopping. These findings are consistent with the studies which highlight the important role of PU (Agag & El-Masry, 2016; Bigné-Alcaniz et al., 2008; M. Y. Chen & Teng, 2013; Elseidi, 2018; Fortes & Rita, 2016; S. Ha & Stoel, 2009; Pelaez et al., 2019), compatibility (Agag & El-Masry, 2016; Al-Ajam & Nor, 2013; Eri et al., 2011; Vijayasarathy, 2004), and PSP (Dwivedi et al., 2017; H. Kim et al., 2009) in forming positive attitude toward online shopping. However, unlike prior studies, no significant impact of PEOU (Agag & El-Masry, 2016; Bigné-Alcaniz et al., 2008; Changchit et al., 2018; Fortes & Rita, 2016) and perceived enjoyment (S. Ha & Stoel, 2009) on attitude was found in none of four consumer segments.
This research also presents interesting findings related to the role of perceived information security in determining the attitude toward online shopping. In Shopping Lovers and Incompetent Consumers segments, perceived information security was found to be positively related with consumers’ attitudes toward online shopping. However, in contrast to prior studies (Changchit et al., 2018; Eri et al., 2011; Lian & Lin, 2008), in Direct Purchasers and Suspicious Browsers segments, perceived information security was not found to have any influence on consumers’ attitudes toward online shopping.
Findings of this study are consistent with the studies that assessed the impact of PEOU (Agag & El-Masry, 2016; Fortes & Rita, 2016; S. Ha & Stoel, 2009; Smith et al., 2013), perceived enjoyment (Elseidi, 2018; S. Ha & Stoel, 2009), and perceived compatibility (Gumussoy et al., 2007; Wu et al., 2007) on PU of online shopping. This study showed that in all segments, factors that positively influence consumers’ perceptions about usefulness of online shopping are PEOU of online stores, perceived enjoyment, and perceived compatibility of online shopping with consumer’s existing values and lifestyle.
This research also showed that in different consumer segments, there exist factors that directly influence consumers’ behavioral intention to shop online. In contrast to prior study (Cha, 2011; Elseidi, 2018), perceived enjoyment was found to be a predictor of online shopping intention only in Suspicious Browsers and Incompetent Consumers segments. Unlike the findings of Wu et al. (2007) and Agag and El-Masry (2016), perceived compatibility of online shopping with consumers’ existing lifestyle was found to be a significant predictor of online shopping intention only in Suspicious Browsers segment. In contrast to prior studies (Crespo & Bosque, 2008; Dwivedi et al., 2017; H. Kim et al., 2009; Y. J. Lim et al., 2016), PSP was found to have a significant effect in the formation of intention to shop online only in Suspicious Browsers segment.
Practical Implications
Psychographic consumer segmentation analysis carried out in this study identified four different online consumer segments. Results showed that positive attitudes toward online shopping play an important role in the formation of online shopping intention in all consumer segments. Therefore, if online retailers make consumers develop positive attitudes toward online shopping, they can increase their online shopping rate. Findings also showed that in all segments, when consumers perceive online shopping to be useful and compatible with their lifestyle, they form favorable attitudes toward online shopping. Furthermore, pressure from important others such as friends, relatives, and popular media to engage in online shopping can lead consumers in all segments to form positive attitudes toward online shopping. Besides to common characteristics shared by all segments, each of the determined consumer segments was also found to have unique characteristics that distinguished it from other segments. The following paragraphs discuss practical business implications for each segment separately.
Shopping Lovers’ online shopping rates are very high, which makes them a main source of profit for online retailers. This segment of consumers enjoys spending money on both online and physical stores. They also enjoy spending time on online window shopping which is an act of looking at online products with no intention to buy. Their habit of online window shopping can lead them to make impulse purchases (i.e., unplanned purchases). Online retailers can increase the impulse shopping rate of this segment by making necessary enhancements to their online stores. Enhancing online stores with product recommender systems that make suggestions to customers based on their shopping behavior can be very effective in increasing the impulse shopping rate. For this segment, especially collaborative filtering type of recommender system can be very effective as the study of Hostler, Yoon, Guo, Guimaraes, and Forgionne (2011) showed that such systems increase the rate of unplanned online purchases. Enhancing security features of online stores can increase the online shopping rate of Shopping Lovers because it was found that Shopping Lovers form positive attitude toward online shopping when they believe that online stores are secure in terms of shopping. In this segment, improvements made to online store design and navigational functions can also increase the impulse buying behavior of customers (Floh & Madlberger, 2013). Shopping Lovers spend too much time on the Internet to watch videos, listen to music, surf on social networks, and play games. Therefore, entertainment and social networking channels can be very effective in reaching this type of consumers to inform them about products, services, and promotions.
Direct Purchasers are the second most profitable segment for online retailers as their online shopping frequency is very high. In contrast to Shopping Lovers, Direct Purchasers do not have a habit of online window shopping. This segment of consumers most of the time visits online shopping stores with the aim of purchasing products or services which they have previously decided on. That is, impulse online purchases are not among the behavioral characteristics of this segment. Therefore, rather than encouraging Direct Purchasers to make impulse purchases, online retailers are recommended to leave a good impression on them through provided services. Online retailers can improve content, design, and functionality of their websites to satisfy this type of customers. From content perspective, higher level of information quality and broad product variety; from functional perspective, website customization, ease of searching, and ease of transaction processing; and from design perspective, good visual aspects, ambience, and atmosphere can increase online consumers’ satisfaction levels and loyalty to online retailers (Chang & Chen, 2008; Clemes, Gan, & Zhang, 2014; H. Y. Ha, 2012; Jiang, Yang, & Jun, 2013; H. Kim & Niehm, 2009; X. Liu, He, Gao, & Xie, 2008). Direct Purchasers spend very little time on online entertainment and social networking platforms; however, they spend a lot of time using news portals, search engines, and email services. Therefore, for this segment, online retailers are recommended to focus on news portals, search engines, and email services to advertise their products and services and inform customers about promotions rather than advertising over entertainment and social networking platforms.
Suspicious Browsers are the group of consumers who generally tend to use online stores for looking at offered products or learning about latest trends in the market but not for making online purchases. Even though consumers in this segment perceive online stores to be convenient in terms of shopping, their certain types of online shopping–related concerns prevent them from purchasing products from online stores. Among other segments, Suspicious Browsers segment is the one that worries most about the privacy and security risks. To increase online shopping rate of this segment of consumers, online retailers are recommended to take all the necessary measures to protect the privacy of personal information and security of financial transactions in online shopping platforms as perceptions about privacy and security play an important role in gaining trust in e-commerce (Rodriguez & Fernandez, 2017). Online retailers are also advised to inform customers about how their privacy and security are being protected to increase their trust level. In addition, online retailers are suggested to put necessary security and privacy seals in their online stores, as these seals were found to increase consumers’ trust levels in online retailers (Huseynov & Yıldırım, 2016b). Furthermore, this segment of consumers has major concerns related to delivery and refund processes of products purchased online. Online retailers are recommended to provide money-back guarantee if buyers are not satisfied with purchased products and they are urged to meet the shipping charges of returned products. As a direct impact of perceived compatibility on behavioral intention is found, marketers should adjust their services to be consistent with existing values, previous experiences, and needs of the user of this segment. For example, possible options to provide can be buying online and picking-up freely in-store, ordering online and picking up and paying in-store, and paying at the door. As PSP was found to have significant impact on this segment’s online shopping intention, disseminating positive word-of-mouth messages through social networks and spreading positive impressions through popular press can be very effective in increasing the online shopping intention. From advertisement point of view, online retailers can utilize news portals, search engines, email services, entertainment portals, and social networking platforms as this group of consumers was found to spend more time on such services on the Internet.
Incompetent Consumers are the group of consumers whose online shopping rate is very low. This group of consumers is not good at finding what they want on online stores, they do not know much about using online stores, and they perceive online product ordering process as hard to understand and use. Consumers in this group tend to shop more at physical stores as they like the energy and helpfulness of physical stores. They also enjoy shopping with their friends at physical stores as it enables them to ask for advice on products they want to purchase. Based on the above-mentioned behavioral characteristics of this segment, several recommendations can be made to online retailers for attracting this group of consumers to online stores. Online retailers can address difficulties that Incompetent Consumers encounter while searching and ordering online products by integrating knowledge-based product recommender systems to their online stores. In such intelligent systems, customers specify their needs and the system searches the product database and shows the most suitable ones to the customers. In such systems, there exist continuous interaction between customers and system until the customers finish their online orders. Knowledge-based product recommender systems improve the consumer decision-making process by reducing the shopping duration and effort spent in searching for suitable products (Huseynov, Huseynov, & Özkan, 2016). Consumers in this segment form positive attitude toward online shopping when they believe that such platforms are secure for conducting online transactions. Customers who are more concerned about privacy and security issues are less likely to engage in online shopping (Ariffin et al., 2018; Lian & Lin, 2008). Consequently, online retailers are recommended to communicate privacy and security measures taken within their stores with online customers. As this group of customers enjoys shopping with their friends, online retailers also can provide the same experience to them by enhancing their stores with collaborative shopping functions. Collaborative shopping functions create an environment where customers can share their shopping experience with friends. By using such functions, customers can view products and chat about brands, products, and services (Laudon & Laudon, 2018). This segment of consumers generally spends their time on entertainment and social networking platforms on the Internet. Therefore, online retailers are advised to consider such online services as an advertisement channel for this segment.
Limitations and Future Research Directions
As every research, this study also has its limitations. The findings of this study should be interpreted in the light of these limitations which also present opportunities for future studies. First, participants of this study were limited to university students living in a specific location. Future studies are recommended to carry out similar analyses with non-student participants and with expanded geographical area to increase the generalizability of the study findings. Second, this study depends on the respondents’ self-reported data both in segmentation analysis and model testing process. Self-reported data sometimes do not reflect the respondents’ actual behaviors. Future researches are recommended to utilize respondents’ actual behavior in the segmentation and/or model testing process. Especially in determining consumer typologies, future studies could also utilize fuzzy set qualitative comparative analysis (fsQCA) technique which has recently received attention in e-commerce studies (Pappas, 2018). Finally, this study extended the original TAM (F. Davis, 1989) model by adding five new factors that drive consumers’ acceptance of online shopping. Future studies are recommended to also consider factors that might negatively influence consumer adoption of online shopping.
Conclusion
Findings of market segmentation studies in the given field have led the researchers of this study to carry out market segmentation analysis before testing the developed behavior evaluation model on the entire study sample. Psychographic segmentation, which is one of the robust forms of consumer segmentation techniques, was utilized in dividing online consumer audience into separate subsets. By testing developed behavior evaluation framework separately on each determined segment, this study proposed findings about consumers’ behavior, attitudes, and decision-making processes which are valid for each given segment. Findings of this study showed that even though general online consumer audience share some common characteristics in terms of their perception of e-commerce, there exist groups of consumers that significantly differ from one another. Therefore, e-retailers’ marketing mix should not be the same for online consumer audience. Marketers should tailor their products and services according to the needs of each consumer group rather than following one-size-fits-all marketing strategy.
Footnotes
Declaration of Conflicting Interests
The author(s) declared no potential conflicts of interest with respect to the research, authorship, and/or publication of this article.
Funding
The author(s) received no financial support for the research, authorship, and/or publication of this article.