
Abstract
This study investigates the key socio-economic and geographic factors—specifically distance from markets and zonal centers—that influence multidimensional poverty in rural Ethiopia, using the New Rural Multidimensional Poverty Index (NR-MPI). The analysis draws on pooled data from four rounds (2012–2019) of the Ethiopia Socioeconomic Survey (ESS). A multilevel mixed-effects logistic regression model was applied to assess how household and geographic characteristics affect poverty outcomes. Results reveal that the education, rural livelihoods and resources, and living standards dimensions contribute about 76% to rural multidimensional poverty. Several socio-economic and geographic variables showed statistically significant effects. Notably, each additional year of age reduces poverty likelihood by 3.9% points, while each added household member increases it by 3.6 points. Direct agricultural work raises poverty by 4.9% points per hour, whereas non-agricultural work reduces it by 1.6 points per hour. Each kilometer farther from a market increases poverty risk by 1.8 points, while distance from the zonal center unexpectedly shows a slight negative association. Furthermore, households using chemical fertilizers are 38% less likely to be multidimensional poor. Overall, the findings highlight the critical role of both socio-economic and geographic factors in shaping rural poverty.
Plain Language Summary
This study looks at what causes poverty in rural areas of Ethiopia. Instead of only focusing on money, it considers many aspects of poverty—such as lack of education, poor health, and limited access to basic services like clean water and electricity. The goal is to understand what factors make life harder for people living in the countryside. By studying things like family size, education level, job opportunities, and access to public services, the research helps show why some rural communities are more affected by poverty than others. This information can help the government and organizations make better decisions to reduce poverty and improve people’s quality of life.
Keywords
Introduction
Background of the Study
Ethiopia is a country of striking diversity, encompassing a wide range of ecological zones, ethnic groups, and cultural traditions. Despite substantial economic progress—averaging 10.5% annual growth between 2003 and 2016 (Ethiopia, 2018)—the country continues to face significant poverty-related challenges. A large portion of its population remains unable to access basic needs such as adequate nutrition, healthcare, education, and shelter. This reality reflects persistent inequalities and limited capabilities, particularly in rural areas where the majority of Ethiopians reside. This study investigates the multidimensional nature of poverty in rural Ethiopia by incorporating both household-level characteristics and geographic context.
Poverty, as conceptualized by Sen (1990), extends beyond low income to encompass deprivations in essential capabilities—the freedoms and opportunities individuals need to live a life they value. In this view, poverty involves multiple dimensions, including barriers to accessing health, education, and social participation. This multidimensional understanding of poverty has increasingly informed international poverty measurement efforts. For instance, the Alkire and Foster (2011) framework advanced a robust methodology for quantifying overlapping deprivations, giving rise to the Multidimensional Poverty Index (MPI), now widely applied by the United Nations Development Programme (UNDP) and Oxford Poverty and Human Development Initiative (OPHI).
Globally, MPI-based studies have shown that low-income countries in Africa, South Asia, and parts of Latin America continue to exhibit the highest intensity of multidimensional poverty (Alkire & Santos, 2011; Batana, 2013). Within Africa, numerous national and cross-country studies have adapted the MPI framework to assess the complexity of poverty. For example, Batana (2013) developed an MPI specifically tailored to African women’s welfare, while Asselin (2009) and Klasen (2000) demonstrated the limitations of traditional income measures in capturing deprivation in sub-Saharan Africa. More recent studies, such as those by Alkire and Robles (2017) and Megbowon (2018) applied multidimensional poverty analysis in South African revealed persistent disparities between urban and rural populations driven by differences in education, access to infrastructure, and institutional quality.
The Global Multidimensional Poverty Index (G-MPI) developed by the united nation development program (UNDP) and Oxford Poverty and Human Development Initiative (OPHI) offers an alternative to income-based poverty measures by examining overlapping deprivations in health, education, and living standards (UNDP & OPHI, 2020). According to the 2020 UNDP report, Ethiopia has an MPI score of 0.489, with over 83% of multidimensional poor people experiencing more than half of the weighted deprivations. However, the standard Global MPI (G-MPI) does not fully capture rural-specific vulnerabilities such as exposure to climatic shocks, agricultural risks, or limited livelihood diversification.
Recognizing these gaps, several studies have attempted to refine poverty indices to better reflect local realities. For instance, Alkire et al. (2020) highlighted the need for nationally tailored MPI designs, while studies in Nigeria Aboaba et al. (2019) and Uganda (Sarah & Ibrahim, 2013) have adopted context-specific multidimensional frameworks at subnational levels. These works underscore the importance of incorporating environmental, geographic, and livelihood factors into poverty analysis—dimensions particularly relevant to rural Ethiopia.
In response to these limitations, the Food and Agriculture Organization (FAO) and the Oxford Poverty and Human Development Initiative (OPHI) jointly introduced the New Rural Multidimensional Poverty Index (NR-MPI) in 2022. In contrast to the earlier G-MPI, the NR-MPI adds context-specific dimensions—rural livelihoods and resources, and exposure to risk—which are particularly relevant to the vulnerabilities of rural populations. Moreover, the health dimension in the G-MPI is replaced with more focused indicators of food security and nutrition, reflecting widespread nutritional challenges in agrarian societies. The living standards and education dimensions remain consistent with the global measure to ensure analytical continuity. This adaptation allows the NR-MPI to provide a more policy-relevant and context-sensitive assessment of poverty in rural settings.
Table 1 provides a comparison between the General Multidimensional Poverty Index (G-MPI) and the newly developed Rural Multidimensional Poverty Index (NR-MPI).
Comparison of G-MPI and NR-MPI.

Despite the relevance of the NR-MPI, it has yet to be rigorously applied to a nationally representative dataset for Ethiopia. Moreover, existing empirical studies in sub-Saharan Africa have rarely integrated geospatial dimensions into multidimensional poverty models, even though factors such as remoteness, terrain, and market accessibility are crucial determinants of livelihood outcomes (Gambo et al., 2022; Puttanapong et al., 2022; Turriago-Hoyos et al., 2020). This study advances this literature by applying the NR-MPI framework to national data from Ethiopia, enriched with geospatial indicators to capture locational heterogeneity that traditional poverty measures overlook.
Accordingly, this study uses pooled data from the Ethiopian Socioeconomic Survey (ESS; 2012–2019) in conjunction with spatial analysis to examine how household and geographic factors interact to shape multidimensional poverty in rural Ethiopia. The findings aim to contribute to both the academic literature on poverty measurement and the design of more effective, geographically targeted poverty reduction strategies.
Statement of the Problem
In Ethiopia, poverty presents a significant challenge encompassing social, economic, and political dimensions. Unlike merely low income, poverty here involves inadequate access to vital services such as healthcare, education, housing, and infrastructure. Current efforts to combat poverty are hindered by limited knowledge, weak institutional frameworks, economic constraints, and ongoing conflicts. This underscores the necessity for a thorough and multifaceted examination of poverty to devise effective interventions.
Despite various studies by governmental and private entities, the efforts to tackle poverty, especially in rural regions, remain inadequate. While earlier studies provide valuable insights into the monetary dimensions of poverty, they often overlook the broader context. Transitioning to a multidimensional framework that encompasses social, political, and environmental factors is essential for a complete understanding of poverty. This shift can significantly enhance both academic discourse and practical policy measures aimed at poverty alleviation.
Existing poverty studies in Ethiopia and sub-Saharan Africa have predominantly employed either income-based or conventional multidimensional indices that often underrepresent the unique vulnerabilities of rural populations. For example, studies by Tigre (2019) and Bersisa and Heshmati (2021) illustrate the utility of multidimensional indicators, revealing that a significant proportion of Ethiopians face deprivations beyond mere income loss. Findings indicate that 80% of the population experiences multidimensional poverty, emphasizing the prevalence of deficits in education, healthcare, and essential services.
In the African literature, researchers such as Batana (2013) and Alkire and Robles (2017), have demonstrated that multidimensional poverty remains highly prevalent, particularly in rural settings characterized by fragile institutions and limited infrastructure. Yet, within Ethiopia, few studies have adapted these advanced poverty measurement frameworks—like the New Rural Multidimensional Poverty Index (NR-MPI)—to systematically identify the country’s rural-specific deprivations.
While the New Rural Multidimensional Poverty Index (NR-MPI) offers a context-sensitive framework for capturing the complex nature of rural poverty, it has not yet been utilized in a nationally representative study of Ethiopia. Existing poverty research in the country has largely relied on conventional income-based or general multidimensional indices that often overlook rural-specific deprivations such as access to agricultural inputs, infrastructure, and local environmental conditions.
Moreover, there is a notable lack of empirical studies that systematically integrate geospatial dimensions—such as distance to markets, terrain ruggedness, and proximity to administrative centers—into poverty analysis. These geographic factors are known to significantly affect access to resources, economic opportunities, and public services, yet they remain underexplored in rural poverty assessments.
This study addresses these gaps by applying the NR-MPI to pooled data from four waves of the Ethiopian Socioeconomic Survey (2012–2019), enriched with geospatial variables. This integrated approach enables a more nuanced understanding of how both household-level and locational factors interact to shape multidimensional poverty. The findings are intended to support the design of geographically targeted and socially responsive poverty alleviation strategies. Besides, the study will explore key research questions related to household socio economic and geospatial determinants with distributional impacts of multidimensional poverty on different regions and societal groups.
Methodology of the Study
Type and Source of Data
The Ethiopian Socioeconomic Survey (ESS) is a crucial resource for analyzing multidimensional poverty in rural Ethiopia. Conducted by the Central Statistical Agency and the World Bank, it provides a robust framework for comprehensive panel data collection. By utilizing data from 2011/2012 to 2018/2019, researchers can effectively explore poverty dynamics and derive insights to guide policy initiatives aimed at improving living conditions. While the 2011/2012 to 2015/2016 data represents a panel, the 2018/2019 data differs in household samples. Therefore, this study employs pooled ESS data from 2011/2012 to 2018/2019 for a thorough analysis.
The ESS is invaluable for understanding poverty dynamics and socioeconomic trends over time in Ethiopia. By tracking households through repeated visits, it provides essential longitudinal data for analyzing various factors influencing poverty levels and socioeconomic status. Key benefits of ESS data include:
Tracking Household Status over Time: Regular visits allow researchers to examine poverty transitions, offering a more accurate view of poverty dynamics than cross-sectional data.
Regional Variations in Poverty: ESS facilitates comparison of poverty across different Ethiopian regions, highlighting disparities driven by resource availability, infrastructure, and service access, which can guide targeted interventions.
Determinants of Income and Multidimensional Poverty: The survey includes information on income and other poverty dimensions like education and health, enabling a holistic analysis of factors affecting household well-being.
Geospatial Factors: ESS data reveals how geographic location impacts poverty, showing that rural areas may face unique challenges compared to urban settings, thus informing region-specific policies.
In summary, the ESS offers a comprehensive dataset for assessing multidimensional poverty in Ethiopia, supporting informed policymaking and targeted interventions aimed at poverty reduction nationwide.
Method of Data Analysis
Measuring and Decomposing Multidimensional Poverty in Ethiopia
This section details the methodological framework for measuring and decomposing multidimensional poverty in rural Ethiopia, employing the Alkire-Foster (AF) method to assess deprivations across five core dimensions.
Measuring Multidimensional Rural Poverty
This study adopts the Rural Multidimensional Poverty Index (R-MPI) framework developed by the FAO and OPHI (Poverty & Human Development Initiative, 2022), adapting it to the Ethiopian context using the Alkire-Foster (AF) method (Alkire & Foster, 2011).
The R-MPI comprises five equally weighted dimensions:
Food security and nutrition
Education
Living standards
Rural livelihoods and resources
Exposure to risks
The index is constructed using 16 carefully selected indicators (Table 2). While the original framework included “low pay rate” and “child labor” as indicators, these were replaced with “Land Certification” and “Non-Farm Enterprise Participation” due to both data limitations and their particular relevance to Ethiopia’s rural development context.
Wellbeing Dimension, Deprivation Indicators and Weight and Deprivation Cutoffs.

This substitution is methodologically justified by three key considerations: First, land certification serves as a critical institutional indicator, reflecting smallholders’ access to formal land rights - a fundamental determinant of agricultural productivity and credit access in Ethiopia’s agrarian economy (Holden & Ghebru, 2016). Second, non-farm enterprise participation captures livelihood diversification strategies that enhance household resilience against climate variability and economic shocks (Dercon & Krishnan, 2000). Third, both indicators align directly with Ethiopia’s policy priorities under the (National Planning Commission, 2016).
The AF method follows these steps:
Define Deprivation Cutoffs (zj): Each indicator has a binary cutoff (1 = deprived, 0 = non-deprived). For example: Food insecurity: 1 if household experienced food insecurity in the past 12 months. Non-farm enterprise: 1 if no household member owns a non-farm business.
The use of equal weighting follows the normative assumption that no single dimension of poverty should dominate others (Alkire & Foster, 2011; Dutta et al., 2021). This approach has been empirically validated in similar studies (Alkire & Santos, 2011).
Calculate Deprivation Score (Ci): For each household i, the score is the weighted sum of deprivations:

Where Ij = 1 if deprived in indicator j, and wj is its weight.
4. Identify the Poor: A household is multidimensional poor if Ci ≥ K (poverty cutoff). This study uses K = 33%, a common threshold in MPI literature.
5. Compute R-MPI: The index is the product of Headcount ratio (H) and Intensity (A)
Headcount ratio (H): The multidimensional headcount ratio (H) is the formal name for the first component and it shows the percentage of the population living in multidimensional poverty.

Intensity (A): The intensity (or breadth) of poverty is the second component that denoted by A and it indicates the multidimensional impoverished people that is an average deprivation score.

Thus:

Decomposing the R-MPI
Having established the measurement approach, the study now takes advantage of the AF method’s decomposability to analyze regional poverty patterns. This feature enables the breakdown of poverty into specific subgroups, such as different regions. The overall country-level MPI is calculated as a population-weighted average of subgroups MPIs:

Where:
l = subgroup (e.g., region),
L = total subgroups.
ngl = population of subgroup l,
n = total population.
This shows how national poverty can be expressed as the weighted sum of subgroup poverty levels, where weights reflect population shares. The contribution of each subgroup to national poverty is:

This decomposition enables more effective, targeted anti-poverty strategies by revealing which regions drive national poverty. It clarifies whether policy should prioritize: (a) areas with high MPI l (deep, intense deprivation), or (b) populous regions that make large absolute contributions to the national MPI despite lower intensity.
Multilevel Mixed-Effects Logistic Regression Model
This study utilizes a two-level mixed-effects logistic regression model to investigate the influence of household- and region-level characteristics on multidimensional poverty in Ethiopia. The model accounts for the hierarchical structure of the data, in which households (Level 1) are nested within regions (Level 2). To ensure the robustness and validity of the results, several diagnostic and sensitivity analyses are conducted, including assessments of model fit and multicollinearity. For this, the study employ graphical techniques, the likelihood ratio test, the Akaike Information Criterion (AIC), the Bayesian Information Criterion (BIC), and the Variance Inflation Factor (VIF).
Model Specification
The dependent variable is a binary indicator representing the multidimensional poverty status of household i in region j. It equals 1 if the household is identified as multidimensional poor (i.e., MPI score ≥ K), and 0 otherwise. The probability that a given household is multidimensional poor is modeled as follows:
Let:
Yij binary outcome for household i in region j (1 if multidimensional poor, 0 otherwise).
X ij is a vector of all covariates
β0 is over all intercept
β Vector of coefficient
uj random intercept for region j
The conditional probability that household i in region j experiences multidimensional poverty is modeled as follows:

Description of Variables
Independent variables were selected based on their theoretical and empirical linkages to multidimensional poverty in Ethiopia, aligned with the Alkire-Foster framework and national development priorities.
Household Characteristics
• Age of Household Head (HA): Represents the age of the primary decision-maker. Older household heads may encounter limited economic opportunities due to declining labor capacity but often benefit from intergenerational support networks within extended families (Dercon & Krishnan, 2000). • Household Size (HS): Indicates the total number of individuals living in a household. Larger households often face resource dilution, potentially heightening the risk of deprivation when consumption needs exceed available income (Brewer & Gardiner, 2020). • Sex of household head: Household head sex is a critical determinant of rural multidimensional poverty, influencing access to resources, opportunities, and overall household dynamics. Addressing gender disparities is essential for effective poverty reduction strategies in rural contexts.
Socio-Economic Variables
Labor Allocation
• Agricultural Labor (LAAGPR): Denotes the proportion of labor hours devoted to agricultural activities. A higher share often reflects dependence on subsistence farming, which can correlate with lower productivity and increased vulnerability to climatic shocks (Bezu & Holden, 2014). • Non-Agricultural Labor (LANAGAC): Measures engagement in non-farm wage or self-employment activities. Diversification into non-agricultural labor can mitigate climate-related risks and enhance household resilience (Block & Webb, 2001). • PSNP Participation (LAPSNP): Captures household participation in Ethiopia’s Productive Safety Net Program (PSNP). The program is designed to enhance household food security and build resilience to shocks through predictable cash or food transfers (Berhane et al., 2014). Education Expenditure: Education Expenditure (EXEDUC): Reflects household spending on education-related costs, including fees, materials, and uniforms. Investments in education contribute to breaking the poverty cycle by improving human capital and school attendance—an essential dimension of multidimensional poverty (Modi et al., 2021). Income Sources
• Cash Transfers (INTR): Represents receipt of remittances or financial transfers from external sources. Such inflows can stabilize consumption during shocks but may foster dependency if not accompanied by productive asset accumulation (Gilligan et al., 2009). • Income from Crop Sales (INCRFR): Measures revenue from selling cultivated crops. This income source tends to be volatile due to market and climate risks; low values may signal heightened food insecurity and reliance on self-consumption (Dercon, 2002). • Livestock Income (INAN): Captures income generated from livestock-related activities, including sales of animals and animal products (milk, meat). Livestock ownership serves as both a nutritional resource and a key asset for wealth accumulation (Molina-Flores et al., 2020).
Geo-Spatial Characteristics
• Market Distance (DIMA): Refers to the distance (often in kilometers) from the household to the nearest market center. Greater remoteness can restrict access to goods, services, healthcare, and education, thereby exacerbating rural deprivation (Stifel & Minten, 2017). • Zonal Center Distance (DCZ): Measures proximity to the zonal administrative center. Closer proximity typically facilitates better access to administrative services, infrastructure, and economic opportunities (Zeng, 2021).
Agricultural Practices: Advisory Services (ADSE): Indicates whether the household has access to agricultural extension or advisory services. Empirical evidence shows that farmers receiving advisory support exhibit productivity gains of 15% to 30% in Ethiopia (Abate et al., 2016).
Group Variable: Region (RE): Identifies the administrative region of residence. This variable controls for unobserved heterogeneity arising from institutional, environmental, and climatic differences across geographic areas (Compson, 2024). Table 3 provides a comprehensive summary of all variables employed in the analysis, including their name, description, code, and measurements.
Summary of Variables Descriptions.

Thus, by examining the relationships between these independent variables and multidimensional poverty, the study can identify key drivers and barriers to poverty alleviation. This comprehensive approach enables targeted interventions that address the specific needs and circumstances of different households or communities.
Result and Discussion
Estimation of Rural Multidimensional Poverty in Ethiopia
Multidimensional poverty remains a significant challenge in rural Ethiopia, with data from 2012 to 2019 indicating persistently high levels of deprivation. Rural multidimensional poverty illustrated in Figure 1 indicates that, the headcount ratio (H)—representing the percentage of the population experiencing multiple deprivations simultaneously—increased from 91% in 2012 to 95% in 2019. This suggests that a growing proportion of the rural population is affected by poverty across multiple dimensions, such as education, health, and living standards.

Rural Multidimensional Poverty.
Although the intensity of deprivation (A), which reflects the average percentage of weighted deprivations experienced by the poor—declined slightly from 54% in 2012 to 51% in 2019, the overall severity of multidimensional poverty remains high. The observed rise in the headcount ratio (H), despite a stable intensity of poverty (A), can plausibly be attributed to the political change took place between 2017 and 2019. This period was characterized by government transitions, peace-building initiatives, and episodes of political instability. These developments likely led to widespread displacement, interruptions in public service delivery, and shifts in resource allocation, which may have pushed previously non-poor households into multidimensional poverty. Meanwhile, individuals who were already poor may not have experienced significant changes in their deprivation levels, thereby contributing to the observed decline in the average intensity of poverty. In addition, the adjusted headcount ratio (M0), which accounts for both the incidence and intensity of poverty, has remained relatively unchanged at 48% in 2019, indicating that poverty reduction efforts have yielded limited progress.
The findings indicate that multidimensional poverty in rural Ethiopia remains a persistent and growing challenge. While the intensity of deprivation has seen a slight decline, the rising headcount ratio suggests that more individuals are falling into poverty. Addressing this issue requires sustained policy efforts and targeted interventions to improve both economic opportunities and access to basic services. Without comprehensive and well-implemented strategies, progress in reducing multidimensional poverty will likely remain slow and insufficient.
Decomposition of Rural Multidimensional Poverty
Decomposition of Rural Multidimensional Poverty in Regional State
Table 4 emphasizes the notable regional disparities in multidimensional poverty across Ethiopia. While Harari had a relatively low headcount ratio of 69%, regions such as Tigray, Amhara, Benishangul-Gumuz, and Gambella exhibited higher poverty rates, ranging from 83% to 91%. Additionally, Oromia, Afar, the Southern Nations, Nationalities, and Peoples’ Region (SNNPR), Dire Dawa, and the Somali region had headcount ratios above the national average, with the Somali region recording the highest at 98% in 2012.
Multidimensional Poverty in Regional State.

By 2019, multidimensional poverty in rural Ethiopia had increased significantly, rising from 91% in 2012 to 95%. Most regions experienced similar or higher levels of poverty. The Amhara, Oromia, and Dire Dawa regions reported a headcount ratio of 95%, while the South and Somali regions reached 96%. Gambella and Afar had the highest rates, at 99%, underscoring the severity and widespread nature of multidimensional poverty in rural Ethiopia.
Regarding poverty intensity (A), in 2012, all regions had scores above the national average of 49%. Afar, Oromia, Benishangul-Gumuz, SNNPR, and Somali were the most deprived regions, with weighted indicator scores of 55% or higher. In contrast, Tigray, Gambella, and Harari had relatively lower deprivation levels, with weighted indicator scores around 48%. By 2019, most regions exhibited a decline in multidimensional deprivation, except for Tigray, Gambella, and Amhara. Benishangul-Gumuz experienced a notable reduction, decreasing from 56% to 47%. While Tigray and Gambella recorded slight increases in deprivation, Amhara remained relatively stable at 51%.
In 2012, the Oromia, Dire Dawa, Afar, SNNPR, and Somali regions experienced high levels of multidimensional poverty, with MPI indicators exceeding 50%. In contrast, Tigray, Amhara, and Harari had lower MPI indicators, remaining below 50%. Between 2012 and 2016, most regions experienced a decline in MPI, with the exception of Tigray and Amhara, where poverty levels remained stable or increased. However, by 2019, multidimensional poverty had risen in several regions, including Tigray, Afar, Oromia, and Gambella, indicating a reversal of earlier improvements.
The resurgence of multidimensional poverty around 2019 can be attributed, in part, to escalating political instability and intra-regional conflicts. These crises severely disrupted essential public services, displaced large segments of the population, and undermined economic activity—particularly in conflict-affected regions. Notably, areas such as Tigray, Amhara, and parts of Oromia experienced significant political unrest and armed violence, which resulted in the destruction of critical infrastructure, restricted access to education and healthcare, and the deterioration of household livelihoods. These conflict-related disruptions have had a profound impact on the non-income dimensions of poverty—including health, education, and living standards—thereby contributing to rising Multidimensional Poverty Index (MPI) levels. Consequently, the erosion of peace and security in these regions has played a pivotal role in reversing earlier gains in multidimensional poverty reduction.
Regional Contribution to the National Multidimensional Poverty
Table 5 demonstrated that the contribution of regional multidimensional poverty. Multidimensional poverty in 2012 was primarily concentrated in three regions—Amhara contributed (17%), Oromia had contributed (21%), whereas SNNP region accounted for 29%. The regional distribution of poverty remained largely static between years 2014 and 2016, although Southern region experienced slight declining trends.
Regional Multidimensional Poverty Contribution.
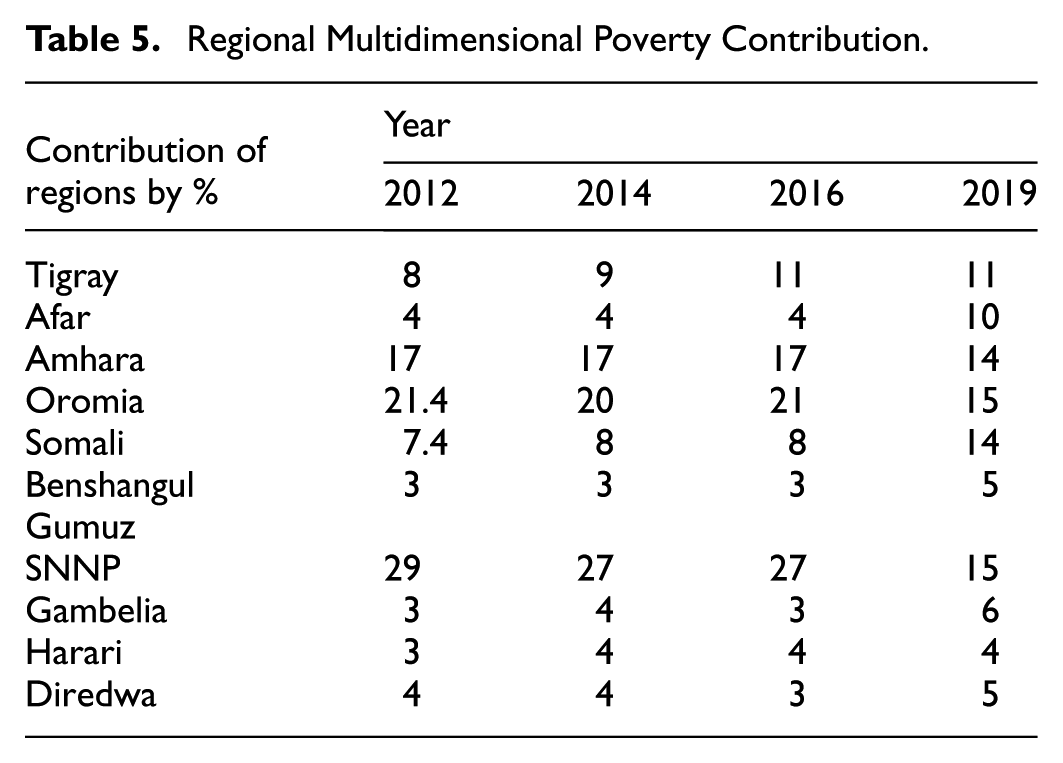
Analysis of 2019 data reveals significant shifts in poverty distribution patterns. The contributions of Amhara (14%), Oromia (15%), and SNNP (16%) regions showed marked improvements compared to their 2012 figures. Conversely, certain regions experienced deteriorating conditions—notably the Somali region, where poverty indices rose substantially from 7.4% in 2012 to 14% by 2019.
Gender-Based Decomposition of Rural Multidimensional Poverty
Table 6 emphasizes the contributions of gender to rural multidimensional poverty. The headcount measure of multidimensional poverty in female-headed households increased from 0.89% in 2012 to 0.91% in 2019. In contrast, the proportion of male-headed households experiencing multidimensional poverty remained constant at 0.91% over the same period, despite fluctuations in the headcount ratio between 2012 and 2019.
Gender-Based Multidimensional Poverty Contribution.
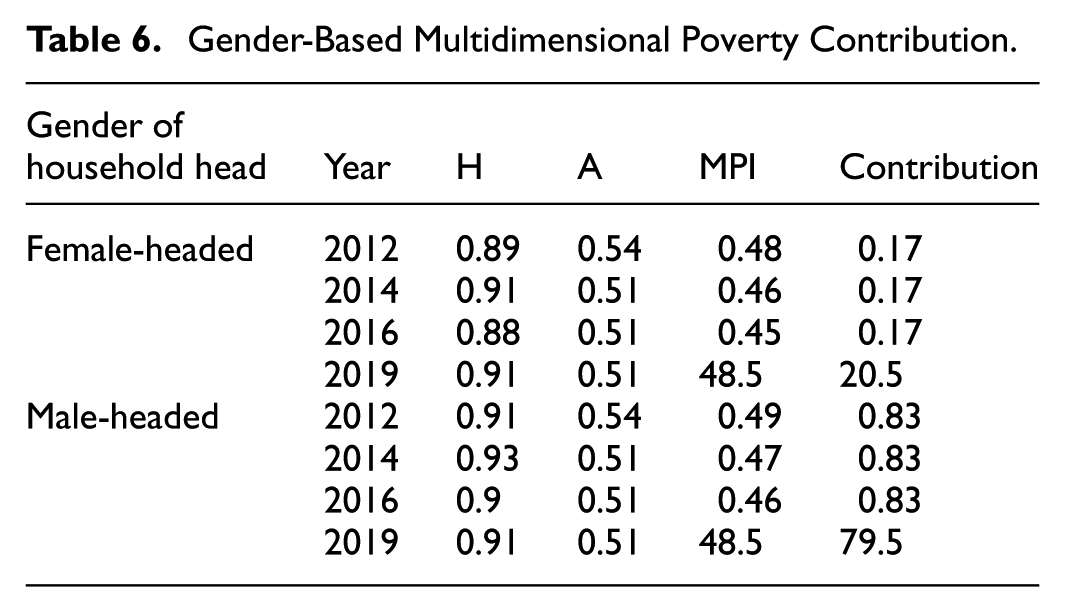
Furthermore, findings of the study demonstrate that, across all households, 0.51% of the weighted indicators were associated with deprivation in 2019, indicating a modest reduction compared to 2012. Notably, the contributions of female headed households rose significantly, from 0.17% in 2012 to 20.5% in 2019. This substantial increase suggests that female-headed households are disproportionately more susceptible to multidimensional poverty. In addition, the gender of the household head emerges as a significant determinant of multidimensional poverty in rural Ethiopia, underscoring the importance of gender-sensitive policies in addressing rural poverty and social vulnerability.
Decomposition of Indictors and Dimensions
This study employed 16 indicators across five dimensions—health, education, living standards, rural livelihoods and resources, and risk—to assess multidimensional poverty in rural Ethiopia. The newly developed rural multidimensional poverty measure builds upon the global framework by incorporating additional dimensions relevant to rural contexts.
Initially, the study considered indicators such as low pay rates, social protection, child labor, and extension services to measure rural livelihoods and resources dimensions. However, due to data limitations, land certification and non-farm enterprise were used as proxies. Similarly, within the risk dimension, indicators such as credit denial, socioeconomic factors, and climate shock were excluded due to data unavailability.
Table 7 presents the average contributions of indicators and dimensions. The highest indicators contributions to multidimensional poverty between 2012 and 2019 were education (17%), malnutrition (10.5%), and school attendance (10%). Conversely, credit denial (0.007%), assets (0.3%), climate shock (3%), housing (4%), and drinking water (4%) had the lowest contributions during the same period, while the remaining indicators contributed between 5% and 7%.
Indictors and Dimensions Contribution for Multidimensional Poverty.

All dimensions significantly impacted individuals living in rural Ethiopia. On average, between 2012 and 2019, education accounted for 27% of multidimensional poverty, followed by rural livelihoods and resources (24%), living standards (23%), food security and nutrition (16%), and risk (10%). These findings underscore the substantial influence of these factors on rural poverty in Ethiopia.
These findings emphasize the vital role of education in reducing poverty in rural areas. Education enhances individual skills and creates economic opportunities, indicating that improving access and quality can significantly lower poverty rates. Moreover, education is an actionable indicator; investments in it yield long-term benefits across various life aspects. While education is crucial, improving rural livelihoods and living standards is equally important. Enhanced livelihoods stabilize income, and better living conditions support health and well-being. Food security and nutrition are essential for effective learning and work, highlighting the need for a comprehensive approach to poverty alleviation.
Robustness and Sensitivity Check
Robustness check: The study conducted a robustness check of MPI dimensions by comparing household deprivation rankings under two weighting schemes. First, equal weights were applied; then, alternative weights reflecting yearly deprivation variations were used. A Spearman rank correlation test in STATA yielded a statistically significant rho of .94, indicating a strong positive correlation between the two ranking sets. This suggests that the MPI rankings remain relatively stable despite changes in weights. Although not identical, the similarity in rankings implies that altering weights does not significantly affect household deprivation classification, thereby supporting the robustness of the MPI under different weighting assumptions.
Sensitivity check:Alkire and Foster (2011) define the poverty cutoff (K) as the threshold that determines whether an individual is classified as multidimensional poor, based on the weighted sum of their deprivation scores. Sensitivity analysis is essential for assessing how variations in K impact the Multidimensional Poverty Index (MPI), offering insights into the robustness of poverty measures (Alkire et al., 2020). This study examines the sensitivity of the MPI at cutoffs of 20%, 50%, and 70%, using 33% as a reference point. Figure 2 sensitivity analysis result indicates that, lower cutoffs (at 20% and 33%) produce more stable outcomes, whereas higher thresholds exhibit greater sensitivity. These findings align with the work of Alkire et al. (2014), who note that while higher cutoffs may reduce the overall incidence of poverty, they can disproportionately affect the intensity component of the MPI, thereby influencing policy priorities.

MPI sensitivity analyses.
Econometric Analysis of Rural Multidimensional Poverty in Ethiopia
Identifying the socioeconomic factors that most strongly influence multidimensional poverty is essential for guiding evidence-based policy interventions in rural Ethiopia. To this end, a mixed-effects logistic regression model was estimated using household-level data. The interpretation below emphasizes variables that exhibit robust statistical significance (p < .05 or .01), while variables with weaker evidence are mentioned briefly for completeness. Table 8 presents the econometric results, indicating that most of the coefficients for the explanatory variables are statistically significant.
Econometric Results of Rural Multidimensional Poverty.

Significance level presented as 1% (*), 5% (**), and 10% (***).
A highly significant and positive relationship (p < .05) was found between household size and multidimensional poverty. Specifically, each additional household member increases the likelihood of a household being multidimensionally poor by approximately 3.6% points. This finding aligns with the results of Gebrekidan et al. (2021) and underscores the negative consequences of resource dilution among larger families. In rural Ethiopia, where livelihood resources and employment opportunities are limited, larger households face intensified pressure on income, land, and education access. Policy implications suggest prioritizing family planning awareness and targeted social protection for larger rural households.
Labor participation in non-agricultural employment has a statistically significant and negative effect (p < .01) on multidimensional poverty, indicating that households engaged in off-farm activities are less likely to be poor. Specifically, each additional hour devoted to non-agricultural work reduces the probability of experiencing multidimensional poverty by approximately 1.6% points. This finding underscores the critical role of livelihood diversification in rural development, as engagement in non-farm employment provides alternative income sources, reduces vulnerability to agricultural shocks, and enhances household resilience (Ellis, 2000; Haggblade et al., 2010) Strengthening opportunities in rural enterprises, small-scale manufacturing, and service activities can therefore be an effective strategy for reducing multidimensional poverty in Ethiopia’s rural areas.
By contrast, the coefficient for labor in direct agricultural work, though positive, is only marginally significant. Dependence on low-return subsistence agriculture continues to correlate with poverty, reflecting underemployment and productivity constraints common in rural Ethiopia. In Ethiopia, several factors link agricultural labor to an increased risk of multidimensional poverty. A significant issue is the signaling of distress; many engage in farming out of necessity due to limited job alternatives, leading to underemployment. Consequently, households often depend on subsistence farming, which fails to provide sufficient income to surpass the multidimensional poverty line. Additionally, inadequate rural infrastructure—such as poor transportation and storage—hinders farmers’ ability to market their products, resulting in lower prices and reduced income. Low labor productivity in agriculture further exacerbates poverty, trapping households in a cycle of economic instability.
Household expenditure on education is strongly and negatively associated with multidimensional poverty (p < .05). Moreover, each additional Ethiopian birr spent annually on education is associated with a 0.4%-point reduction in the probability of poverty. This robust finding confirms the protective role of educational investment in enhancing human capital and long-term welfare outcomes. Policies that improve rural school quality, minimize schooling costs, and encourage household investment in education are likely to yield substantial poverty-reduction benefits. These findings align with prior research by Tigre (2019), Gebrekidan et al. (2021), and others, which established a positive correlation between education levels and reduced multidimensional poverty. This study uniquely focuses on annual household education expenditure, offering a precise measure of investment impact.
Total cash transfers—also show statistically significant negative effects on multidimensional poverty, a one-birr increase in cash transfer income reduces poverty by about 0.3% points (p < .01). These findings support earlier research (Hagen-Zanker et al., 2011) highlighting the role of cash transfers and agricultural income in improving rural livelihoods and reducing multidimensional poverty. Moreover, income from agricultural produce serves as a primary livelihood source in rural settings, reinforcing its importance in poverty reduction strategies. This study adds to the growing body of evidence that diversified and stable income sources are critical in mitigating multidimensional poverty in rural contexts.
These results highlight the importance of both social protection and agricultural commercialization for improving household welfare. Cash transfers provide immediate consumption support, whereas revenues from crop and fruit sales enhance long-term income stability. Strengthening local market access and ensuring predictable cash-transfer programs could amplify their combined poverty-reducing effects.
Geographic accessibility shows nuanced but meaningful effects. Greater distance to the nearest market is positively and significantly associated with multidimensional poverty (p < .01): each additional kilometer from a market raises the probability of poverty by roughly 1.8% points. This result highlights how remoteness restricts market participation, raises transaction costs, and limits access to inputs, services, and consumer goods.
Geographic accessibility displays mixed but highly informative patterns. Distance to the nearest market exhibits a positive and statistically significant association with multidimensional poverty (p < .01). Specifically, each additional kilometer separating a household from the nearest market increases the likelihood of being multidimensional poor by approximately 1.8% points. This relationship demonstrates that remoteness remains a critical structural constraint in rural Ethiopia—limiting household participation in markets, elevating transaction and transport costs, and reducing access to essential services, employment opportunities, and information flows. These findings are consistent with prior empirical works highlighting the pivotal role of spatial connectivity in shaping welfare outcomes across developing regions (Eshetu et al., 2022; Jacoby, 2000). Strengthening rural road networks, feeder markets, and transportation infrastructure could therefore substantially mitigate location-driven poverty disparities.
On the other hand, distance from the zonal administrative center shows a weak or inconsistent relationship, with a small negative sign. While surprising, this could imply that rural households located slightly farther from administrative centers may rely on self-sufficiency strategies or stronger local networks that mitigate deprivation. However, the result should be interpreted cautiously, as the effect is less robust statistically.
The use of chemical fertilizer is one of the most robust predictors of reduced multidimensional poverty (p < .01). Households applying fertilizer are about 34% less likely to be multidimensional poor compared with non-users. This finding supports empirical evidence by Duflo et al. (2007) and Marenya and Barrett (2009), which highlight input adoption as a critical driver of agricultural productivity and food security. Policies that improve smallholders’ access to affordable fertilizers, coupled with training on effective application, can substantially enhance rural welfare.
Conversely, agricultural advisory services showed no statistically significant impact, suggesting the need to reassess their coverage and relevance to farmers’ actual needs.
In Table 8 the results of the random-effects parameter analysis indicate that the standard deviation of regional variations is highly greeter than its standard error, suggesting significant differences in multidimensional poverty across regions. Additionally, the likelihood ratio test comparing the mixed-effects logistic model to an ordinary logistic regression model yields a statistically significant result (p = .000), confirming substantial regional disparities in multidimensional poverty.
The random-effects results reveal significant variation in multidimensional poverty across regions. To illustrate these differences, the study uses the STATA application to create a map depicting the regional distribution of multidimensional poverty based on household deprivation scores. Thus, Figure 3 shows regional distributions of multidimensional poverty, The Somali region and SNNP areas exhibit significantly high poverty levels, primarily due to a pastoral lifestyle that restricts access to education, healthcare, and essential services. In contrast, the Afar and Amhara regions have better resource access. Tigray, Benishangul-Gumuz, Oromia, and Harari experience moderate poverty, while Gambella shows low multidimensional poverty. These disparities highlight how regional characteristics, including resource distribution and institutional support, influence poverty levels.
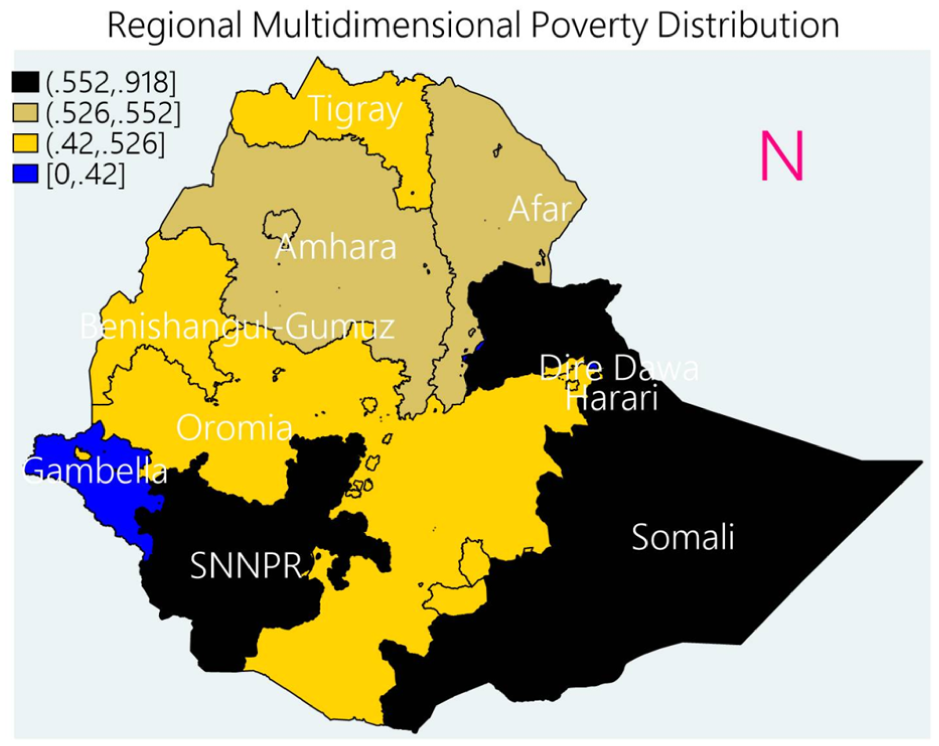
Regional multidimensional poverty distributions.
Identifying the Most Suitable Model
This section aims to determine the most appropriate model for analysis by comparing a random intercept model with a random slope model, both incorporating similar predictor variables. The region variable is designated as a random intercept to account for regional variability, while time spent on direct agricultural activities and distance from the market are treated as random slopes to evaluate their varying effects across regions.
Initially, the random intercept model is fitted, followed by a model that includes both random intercepts and slopes. To assess model fit, the study employs the likelihood ratio test, as well as the Akaike Information Criterion (AIC) and Bayesian Information Criterion (BIC).
The likelihood ratio test presented in Table 9 indicates that the result is statistically insignificant, supporting the simpler model. This suggests that the additional complexity of the random slope model does not significantly enhance the model fit when compared to the random intercept model.
Likelihood Ratio Test.

Additionally, when comparing models using AIC and BIC analysis, lower values indicate a better fit. The results in Table 10 show that AIC and BIC values support that the use of the simpler model (with a random intercept). The first model, which includes only the random intercept, has lower AIC and BIC values compared to the second model (which includes a random slope), emphasizing the importance of considering model simplicity. Consequently, this study utilizes the random intercept model for further analysis.
AIC and BIC Assessment.

Checking for Multicollinearity
To assess multicollinearity, this study follows the guidelines established by (Hadi & Chatterjee, 2012). According to these criteria, multicollinearity is indicated if the largest Variance Inflation Factor (VIF) exceeds 10 or if the mean of all VIFs is significantly greater than 1.
In Table 11 the results of the VIF analysis reveal that no variables have a VIF greater than 10, and while the mean VIF is greater than 1, it is not considerably so. Therefore, the study concludes that there is no evidence of multicollinearity among the variables.
Variance Inflation Factor (VIF) Multicollinearity Test.

Conclusion, Recommendations, and Study Limitations
Conclusions
In this study, despite experiencing an impressive average economic growth rate, this study reveals that multidimensional poverty in Ethiopia has worsened between 2012 and 2019. The increase in the headcount ratio of rural multidimensional poverty, from 90% in 2012 to 95% in 2019, indicates that a greater proportion of the rural population is experiencing deprivation across multiple dimensions, such as education, health, living standards, rural livelihood and risk. These findings suggests that economic growth has not translated into improved living conditions for many households, highlighting the need for targeted interventions to address the underlying causes of poverty. Additionally the result shows that, the dimensions of education, rural livelihoods and resources, and living standards account for 76% of the contribution to multidimensional poverty in rural areas. This highlights the imperative for coordinated policy initiatives to effectively address and alleviate multidimensional poverty in these regions.
The analysis of Ethiopia’s multidimensional poverty underscores the importance of understanding regional disparities and the dynamics of poverty over time. While the significant improvements in the Amhara, Oromia, and SNNP regions are encouraging, the rising poverty rates in the Somali region signal urgent challenges that require immediate attention. These worsening conditions highlight the impact of ongoing conflict, inadequate infrastructure, and limited access to essential services, which hinder progress for vulnerable populations.
The analysis reveals several key factors influencing multidimensional poverty, particularly household socio-economic characteristics. These include the age of the household head, family size, involvement in non-farm activities, reliance on chemical fertilizers, education expenditure, income from direct cash transfers, and revenue from the sale of crops and fruits.
Each of these factors significantly shapes the economic well-being of households. For instance, the age of the household head can affect decision-making capabilities and access to resources, while larger family sizes may strain available economic resources. Engaging in non-farm activities is crucial for income diversification, helping households mitigate risks associated with agricultural fluctuations.
The use of chemical fertilizers relates closely to agricultural productivity, yet its effectiveness often depends on the education level of household members, particularly in understanding proper application techniques. Investment in education is vital, as it correlates directly with improved economic opportunities and higher income.
Income from direct cash transfers provides essential support for vulnerable households, enabling them to meet basic needs and invest in income-generating activities. Additionally, revenue from crop and fruit sales can significantly enhance household incomes, contingent upon market access and fair pricing. Addressing these interconnected factors is crucial for reducing multidimensional poverty and fostering sustainable development in rural communities.
Geographical characteristics significantly impact multidimensional poverty, particularly through the relationships between distance to market and distance from the zonal center. The analysis indicates that greater distance to market is positively correlated with higher levels of multidimensional poverty. This suggests that households located further away from markets face increased challenges in accessing essential goods, services, and job opportunities, which can hinder their economic advancement.
In contrast, the relationship between distance from the zonal center and multidimensional poverty is negative. This implies that households closer to urban centers benefit from better access to infrastructure, social services, and economic opportunities, which can help alleviate poverty. Given these findings, addressing geographical disparities is crucial for effective poverty alleviation strategies.
These findings highlight the need for integrated policies that tackle both household-level and spatial causes of multidimensional poverty. Enhancing education, supporting non-farm employment, and improving agricultural access can strengthen household resilience. Simultaneously, investing in infrastructure—especially roads and market access in remote areas—reduces multidimensional poverty. Together, these strategies foster inclusive development, enabling households and regions to overcome poverty’s multiple dimensions in a sustainable and equitable manner.
Recommendations
Based on the econometric results, this study identifies several variables that exert a strong and statistically significant influence on rural multidimensional poverty in Ethiopia—namely household size, non-agricultural labor participation, education expenditure, total cash transfers, income from crop and fruit sales, distance to the nearest market, and usage of chemical fertilizer. The following recommendations are proposed to translate these findings into actionable policies and programs.
Promote Family Planning and Household Resource Management: The strong positive association between household size and multidimensional poverty suggests that larger families experience higher deprivation levels. Intensify family planning and fertility awareness programs through rural health networks.
Expand and Support Non-Agricultural Rural Employment: The negative and significant effect of non-agricultural labor participation on poverty underscores the importance of livelihood diversification. Stimulate rural entrepreneurship by promoting small-scale manufacturing, agro-processing, and service activities. Improve access to credit and vocational training for youth and women to engage in off-farm enterprises.
Increase Investment in Rural Education: The strong negative relationship between education expenditure and multidimensional poverty confirms education’s transformative potential. Expand rural education infrastructure, particularly in remote districts. Provide targeted scholarships and school-feeding programs to ease household financial burdens.
Strengthen Social Protection through Effective Cash Transfers: The negative effect of total cash transfers on poverty highlights the effectiveness of income support in improving welfare outcomes. Strengthen the Productive Safety Net Program (PSNP) by ensuring timely payments and better targeting of beneficiaries. Complement cash transfers with complementary livelihood programs such as micro-enterprise grants and training.
Enhance Agricultural Commercialization and Market Access: The observed negative relationship between income from crop and fruit sales and poverty reflects the benefit of market-oriented farming. Facilitate value-chain development and establish farmer cooperatives to improve bargaining power. Encourage smallholder participation in horticultural and high-value crop production.
Promote Agricultural Input Use and Productivity Enhancement: The strong negative association between chemical fertilizer use and multidimensional poverty emphasizes the importance of modern agricultural inputs for rural wellbeing. Expand extension and credit services to ensure timely and affordable fertilizer access.
Spatially Targeted Rural Development Strategies: Evidence that spatial variables such as market distance significantly determine poverty outcomes implies that geographic context must underpin all interventions. Employ geospatial poverty mapping to allocate resources efficiently. Prioritize remote districts for infrastructure, digital connectivity, and service delivery improvements.
Study Limitations
This study presents several counterintuitive results that may stem from data limitations or contextual complexities, particularly regarding:
Time Spent on Agricultural Work: The positive association between time spent on agricultural work and higher poverty raises concerns about labor productivity and reliance on subsistence farming.
Distance from Zonal Center: The negative relationship between distance and poverty suggests that households farther from administrative centers may have access to resources not accounted for in this study.
Data Availability Constraints: Limitations in capturing variables related to pay rates and household vulnerability may have reduced the model’s comprehensiveness and explanatory power.
These unexpected findings highlight the need for further investigation to clarify these relationships. Future research should incorporate additional spatial data and qualitative methods to enhance understanding in these areas.
Footnotes
Funding
The authors received no financial support for the research, authorship, and/or publication of this article.
Declaration of Conflicting Interests
The authors declared no potential conflicts of interest with respect to the research, authorship, and/or publication of this article.
Data Availability Statement
Data sharing not applicable to this article as no datasets were generated or analyzed during the current study.