
Abstract
Climate change is a tricky issue. The Indian subcontinent has experienced many regional and local climatic changes in its past. There is overwhelming geological evidence of global climatic changes which are associated with extinctions and new life form adaptations. The Indian subcontinent is governed by monsoonal precipitation inextricably linked with the socioeconomic conditions of its citizenry. The subcontinent has a long coastline which is prone to sea level changes having potential to displace millions of people. The agriculture, dependent on the monsoonal precipitation, is already showing signs of disarray. Floods and droughts have been visiting regions that were hitherto immune to these hazards. The fast-eroding green cover and forests has unleashed extinctions of life forms that are so vital to the well-being of the environment. In climate change dynamics, many variables, and not a single one, have a role to play. Humans have the capacity to tackle this situation, and all the nations need to come together to fight the menace of climate change, that is part natural and part man-made. The technological innovations are long overdue to mitigate the hazards faced.
Introduction
Climate change is a veritable phenomenon and its effects are felt all over the globe (Barnosky et al., 2011). Extreme climate events have exacerbated the socioeconomic conditions in many parts of the world putting governments in tight economic spots (Indian Network on Climate Change Assessment [INCCA], 2010). The population explosion has made it difficult to have a balanced environmental and climatic condition that can be sustained for long.
The narrative of climate change is considered to begin with the start of industrialization, which is taken to be as an initial point in assessing climate change impact (Mgbemene et al., 2016). The future has to be seen through the prism of past. And that is what the present crop of environmentalists are not ready to attempt. This lacuna makes it very unnerving to accept their position and corroborate the “alleged” anthropogenic climate change.
The impact carbon dioxide has on our climate is well documented, and in the late 1970s global consensus emerged on acknowledging anthropogenic activities influence climate change. Since the 1990s, United Nations is trying to prevail over many nations to limit their anthropogenic assault on climate (Brauch, 2012) and is still persuading its member nations to rein in the harmful effects. Some of the environmentalists and “green” organizations are aggressively advancing their efforts to limit greenhouse gas emissions, by trying to bring in “peoples” control on the alleged detrimental policies launched by the governments. However, there still lacks some understanding in the minds of the laity on the question of factors leading to climate change. The common folk of the developed nations may have some understanding, although many among them still consider the anthropogenic climate change model to not be a serious issue (Pew Research Center, 2018). The developing and poor countries, on the contrary, are far behind in understanding the subtle nuances in the climate change impact that they are experiencing. It is now rightfully felt to enlighten the masses on the challenges of erratic weather patterns with the resultant changes in yield of the common crops (INCCA, 2010). It is also felt to assess the costs monetarily of damages or gains accruing due to current climate change. Many are actively pursuing attempts to calculate social cost of carbon emissions and demissions (Foley et al., 2013).
Earth has a long history and the geologic record provides invaluable glimpses into the environmental changes that it has repeatedly undergone (Wadia, 1976). The rock formations, and the life forms that are embedded in the sediments, give a detailed picture of the kind of climatic and environmental conditions that prevailed during their formation. There are instances in the geological record how environmental changes have caused species to migrate, become extinct, or give rise to new species (Wadia, 1976). Some perished during the climatic changes, while others adapted and reconciled themselves to the newer habitat.
The Indian subcontinent experiences tropical and subtropical climate, which has strong undercurrents of seasonality. The Himalayas control the precipitation pattern by forming a strong and major relief in the north of the subcontinent. Indian subcontinent has geomorphologically varied physiographic divisions (Sen, 2002; Wadia, 1976) necessitating the unraveling of the role of sediment response, especially the magnetic minerals, to climate change in relation to monsoonal fluctuations. Natural climatic variability has been established from historical records and proxy indicators, though the former have spatial and temporal (few hundred years) limitation. The latter, however, go a long way back in time (millions of years). Almost all the proxy indicators are recorded naturally, because of which, their potential span of study remains long. Their accuracy and resolution is constrained by accuracy and resolution of the recording devices themselves.
Indian Subcontinents Paleomonsoon Episodes Tracked Through Mineral Magnetic Studies
Indian monsoon and its variability has been studied through different continental (tree rings, paleosols, speleothems, fluviolacustrine sediments, peat deposits, microfossils, magnetic minerals etc.) and oceanic (foraminifers, isotopes, isotope ratios, organic content of sediments, etc.) proxies. It is caused by seasonal reversal of winds over the Indian subcontinent. The Indian monsoon is a macroscale feature which is aided and abetted by causes of regional and global nature (Figure 1), and impacts the socioeconomic fabric of the subcontinental inhabitants. The antiquity of Indian monsoon is placed at about 8 to 10 Ma ago and has evolved by complex interaction between Indian Ocean and Himalaya-Tibetan plateau (Clemens et al., 1991; Webster et al., 1998). Of all the tropical or subtropical features, the monsoon has the largest annual amplitude (Pant, 2003). According to Charney (1969) and Gadgil (2003), monsoon reflects movement of intertropical convergence zone (ITCZ), which is seasonal in nature. Riehl (1979) considers monsoon to be an equatorial trough, formed due to variable latitude of maximum insolation. Kumar et al. (1999) deduce continuous increase in Eurasian surficial temperatures, during winter, leads to greater thermal ranges between continent and ocean, giving rise to enhanced monsoons.

Different factors are depicted that aid and abet the formation of monsoon across the Indian subcontinent.
Paleomonsoonal pattern of the subcontinent has been understood by harnessing a legion of proxies. However, the present effort is confined primarily to examining inferences on paleomonsoonal changes, using magnetic mineralogy. Magnetic minerals are sensitive to changes in ambient chemical and physical processes that consequently result in concentration, grain size, and mineralogy changes. The study of these changes unravels physicochemical regime operative in the past, helping to gauge the then prevalent climate model. Iron oxide system is characterized by many different modifications from one mineral phase to another (Cornell & Schwertmann, 2003). Under favorable conditions, most of the iron oxide constituents can transform into a minimum of two other forms. Thermodynamically, goethite and haematite are the most stable compounds under oxic conditions. Thermal transformation of FeOOH polymorphs, either caused by natural or man-made fires, is widespread in natural environments. The frequent occurrence of maghemite in surface soils of the tropics and at localized burning sites around the world is because of the presence of organic matter. Goethite or ferrihydrite, on heating with organic elements, is transformed to maghemite, whereas its absence leads to formation of haematite. Fe +2 is stable in an alkaline and reducing environment due to negative Eh, but in a positive Eh condition, iron gets oxidized from Fe +2 to Fe +3 , that is, haematite (Mason & Moore, 1982).
Discussion
Climatologically the Indian subcontinent is very dynamic and complex with many variables influencing environmental possibilities. The Siwalik, foothills of the Himalayas, are the byproduct of the Himalayan erosive/weathering processes and the sediments from Haripur, Himachal Pradesh, studied by Sangode et al. (2001a) yielded warm and humid climate in the early Pliocene (~65000-59900 ka); warm during mid-, late Pliocene (~59900-54800 ka); and cold during early- and mid-Pleistocene (~1800-910 ka). They based their inference on different magnetic parameters and magnetic indices like hydration, oxidation, humification, and reduction.
There are not many mineral magnetic studies between a timeframe from 910 ka to 40 ka. Pant et al. (1998) from Goting, Higher Central Himalaya, revealed six major peaks in magnetic susceptibility (MS) representing semiglacial stages appearing around 39, 33, 29, 26, 24, and 23 ka, suggesting climatic deterioration (semiglacial condition) toward last glacial maximum (LGM) with a brief interval of improvement around 23 ka which compares well with Bhattacharyya (1989) and Thompson et al. (1989). They also found three enhancement peaks in MS at regular intervals of ~5000 years and ~1200 years, suggesting oscillations in climate became frequent toward the glacial maxima. However, 18O/16O variations (Ghosh & Bhattacharya, 2003) revealed slow cooling to have started as one approached the LGM, and saw enhancement of southwest (SW) monsoon at around 40.2, 38.2, 36.2, 34.2, 32.8, and 29.4 ka, whereas weakening of SW monsoon is seen around 40.7, 37.2, and 35.2 ka. From 42 ka to 55 ka, Burns et al. (2001) found enhanced precipitation is linked closely to high northern latitude warm periods. Basavaiah et al. (2004), at another site from Goting, presume higher solar insolation triggered glacial melting between 29 ka and 18 ka. They infer climate instability persisted from 18 ± 3 ka to < 15 ± 2 ka. Here, the Holocene wet phase commenced at about 11 ± 1 ka. The loss of fluvial intensity in the Himalayan rivers from 23 to 14 ka was identified by Sangode et al. (2001b).
In the neighborhood of Goting, glacial conditions prevailed at Garbayang during 20 to 13 ka (Juyal et al., 2004), which can be corroborated by loess accretion (>20 ka to ~16 ka) at Dhakuri (Pant et al., 2005). The accretion of loess is taken to represent the last glacial phase, which gave way to a phase of monsoon reestablishment (~16 ka to >12 ka), leading to partial weathering of loessic profile. A short and relatively warm lacustrine environment around 13 ka is also inferred at Garbayang. Sinha et al. (2005) have decoded enhanced monsoon between 15.2 ka to 11.7 ka from a stalagmite of western Himalaya. The younger Dryas (YD) cooling event manifests itself in the form of loess deposition from ~12 ka to > 9 ka at Dhakuri, whereas a cooler condition at <13 ka occurs at Garbayang. These changes denote snow reflectivity over the Tibetan plateau has the capacity to influence climate on a global scale (Ruddiman & Kutzbach, 1989). In the 12 ka and 11 ka Garbayang sediment horizon, marked changes in magnetic and elemental parameters reflect the effects of cooling that could be linked with YD (Adams et al.1999; Alley, 2000; Bond et al., 1993). The loess climatic chronology, proposed by Pant et al. (2005), finds support in 20 ka varve sediments that indicate existence of overall dry conditions (Juyal et al., 2004). The Holocene optimum, developed paleosol representing humid phase, between 9 ka and ~7 ka, whereas loess accretion from 4 ka to 1 ka signifies aridity at Dhakuri, during mid Holocene period. Evidence of regional cooling and weak monsoon during 22 ka to 16 ka in central Himalaya (Benn & Owen, 1998), with overall cold and dry condition in Tibet for similar period (Schafer et al., 2002), and intensified monsoon between 13 ka and 12.5 ka, and 10 ka and 9.5 ka (Overpeck et al., 1996), has been revealed.
Phadtare (2000) from pollen and MS has shown that at about 7.8 cal ka the climate was cold, moist receiving moderate rainfall at Din Gad, followed by two dry spells that ended at ~7.2 cal ka and 6.6 cal ka. The monsoon at Din Gad then strengthened until ~5 cal ka, representing mid-Holocene climatic optimum. The humid condition of this period was replaced by a prominent cooling event, which marked decreased monsoon that continued till ~3.5 cal ka which saw weakest Holocene monsoon. Later on, two minor dry events at ~3 cal ka and 2 cal ka (possible low influx [2.1-1.8 ka], inferred by Chauhan et al. (1997), were followed by a second humid phase that reached its zenith at around 1.0 cal ka. Another important 0.8 cal ka dry event is seen to coincide with Little Ice Age onset.
Interestingly, Juyal et al. (2000) from the southern margin sediments of Thar Desert inferred reduced precipitation during 120 to 100 ka and 70 to 60 ka, whereas enhanced monsoon during ~100 to 70 ka and <60 to 30 ka with overall dry climatic condition during 20 to 11 ka. Some of these climatic features are seen to be overlapping with other studies. Deotare et al. (2004) gave a chronology for the origin of playas during LGM (> 15 ka), but Sant et al. (2004) tentatively placed the LGM between 26 ka and 17 ka and have further narrowed it to between 18 ka and 17 ka. The Last Glacial-Holocene transition is inferred to be between 17 ka and 13 ka, marked by susceptibility changes manifested through five subevents of flooding (strong monsoon), whereas successive subevents are inferred to represent weak monsoon. The lake full stage of Deotare et al. (2004) existed from 8 ka to 6 ka. However, the lake continued to be brackish to saline throughout its existence. Paleolithic human life seemed to have affected by intense aridity, but it flourished in Mesolithic cultural stage between 8 ka and 6 ka during which time the climate was relatively wet. The Thar playas dried out by 5 ka, even then pastoral activity continued till about 1.5 ka, at some favorable locations. Rajshekhar et al. (2004), from magnetics and pollen, established high discharge during 12 to 12.8 cal ka and 10 to 9.5 cal ka, whereas low discharge is deciphered to exist from 11 to 10.4 cal ka at Navlakhi in the Gulf of Kutch.
In support of the inferences arrived at by magnetic parameters for the playas and the Gulf of Kutch one can list the following studies: The salt lakes in western Rajasthan recorded monsoon dynamics between 5 ka and 3.5 ka, saline conditions from 20 ka to 13 ka and freshwater conditions prevailed from 9 ka to 6 ka (Kajale & Deotare, 1997). Hypersaline conditions prevailed at Didwana (Singh et al., 1990) from 20 ka to 13 ka and freshwater from ~9 to 6 ka. Singhvi and Kar (2004) inferred weakened monsoon at ~13 ka at Thar, whereas Chauhan (2002) revealed Madhya Pradesh experienced cool and dry climatic condition ~9.5 to 6.8 ka. Greenland ice core fluctuations between 10.3 and 8 ka find their reflection in Oman stalagmite (Fleitmann et al., 2003). At Nal Sarovar, Prasad et al. (1997) identified dry period from ~6.6 to ~4.8 ka, short wet episode at ~6.2 ka, wetter climate between 4.8 and 3.0 ka, and short arid interval at ~3.2 ka (coincides with collapse of Indus Civilization). Sinha et al. (2006) identified an arid event between ~7.5 and 6.8 ka at Sambhar. Lunkaransar (Enzel et al., 1999) also experienced abrupt rise in lake levels at 6.3 ka and complete desiccation at 4.8 ka (5.5 cal ka). They, however, consider it not to be the cause for Civilizational decline of Indus. Bryson and Swain (1981) documented a long drought in Rajasthan from 3.6 ka to 2.0 ka, whereas Sarkar et al. (2000) from sediments of eastern Arabian Sea deciphered increased monsoon during the Holocene, in contravention to evidences of aridity around 4 ka found from Rajasthan and South India. Between 4 ka and 3.5 cal ka, lake levels were inferred to have dropped in Africa, influenced by northern leg of monsoon (Gasse, 2000) and is also seen in Kilimanjaro ice core records as high dust levels (Thompson et al., 2002).
Using pollen density sequences from lake beds and lake levels of northwest India, Kelkar (2009) has postulated four monsoon maxima during the last 150 ka that coincided with solar radiation changes because of orbital variations and glacial boundary conditions. He further suggests that the monsoons were weak before 18 ka and a warm and humid climate existed between 10 ka and 5 ka or early Holocene, and that a trend toward aridity set in around 3.5 ka.
The Harappan Civilizational collapse phase of aridity has also been deciphered at Thimmannanayakanakere through magnetics by Shankar et al. (2006), wherein conditions turned slightly humid from 2.5 to 1.55 cal ka. High rainfall is inferred at around 1.22, 1.40, and 1.49 cal ka. Sukumar et al. (1992) and Rajagopalan et al. (1997) from their study of Nilgiri peat deposits have suggested aridity from 5 to 2 ka. The data of Shankar et al. (2006) seem to agree with these records, but not that of Caratini et al. (1991) and Naidu (1996). Shankar et al. (2006) also compared their MS data with Akalagavi speleothem (Yadava et al., 2004) and Gupteshwar, Dandak, and Sota speleothems (Yadava & Ramesh, 2005a, 2005b) to find that some of the droughts and high rainfall events are correlatable, though this correlation is somewhat hampered by the coarse resolution of their own data. Sudden decrease in MS is taken by Seetharamaiah et al. (2004) to reflect calm energy and slow sedimentation at around 2.0 cal ka along the Godavari, Krishna, and Cauvery deltas on the eastern coast of India. Thomas et al. (2007) reconstructed the monsoon variability in the upper Penner river basin of south India. Shankar et al. (2006) found weak hydrological regime around 3 ka, monsoon strengthening till 2 ka, and monsoon intensification between 1 and 0.6 ka. They also decipher aridity between 0.5 ka and 0.2 ka and renewal of monsoonal activity between 180 and 90 years ago. They found rainfall to be lowest during AD 1890-1845, and highest during AD 1640. Low rainfall events are recorded during AD 1890-1845, 1617, and 1325, and around 1.13 and 1.55 cal ka. High rainfall events are documented around AD 1730, 1640, 1505 and 1260. Sontakke et al. (2008) found five major epochs in all-India summer monsoon rainfall fluctuations as follows: 1810s-late 1840s decrease, 1840s-early 1890s increase, 1890s-1900s sudden decrease, 1900s-early 1960s increase, and 1960s onward decrease.
Using sediments from the northwest part of Arabian sea, Kumar et al. (2005) identified LGM (19-21 ka) received abundant continental supply, indicating dominant role of eolian and fluvial processes signifying dry, cold climate, and weakened monsoon. Also, minimal terrigenous supply prior to 13.99 ka suggests weak monsoon, which intensified after YD (11.8-10.8 ka). Shankar and Pandarinath (2008), however, reckon 11.9 ka BP to be a wet phase (increased monsoon), which decreased between 10 and 8.38 ka BP based on magnetic records from the southwestern continental margin of India. The SW region of Arabian sea (Kumar et al., 2005) experienced weak monsoon through the entire Holocene, though early Holocene is marked by strong monsoon. According to Chauhan et al. (2004), through mineral magnetic parameter studies on Bay of Bengal sediments, intensified monsoon was inferred to have set in at ~ 9.5 ka and had hiatuses at ~5 and 2.2 ka, reduced fluvial inflow at 20-15, 12.7, 9.5, ~5-4.3, and 1.8-2.2 ka, and two major fluvial episodes started around 11.5 and 9.5 ka.
From northern Indian ocean sediments, Sarkar et al. (2000) found the summer monsoon, relative to the modern conditions, to be weak during 18 ka, strong during 9 ka, and reduced upwelling during the LGM (18 ka), which was vigorous during 9 ka. Thamban et al. (2001), also identified a period of maximum monsoonal precipitation after 9 to 8 cal ka. von Rad et al. (1999), based on northeastern Arabian Sea varve sediments, identified increased monsoon runoff during 3.7, 2.6, 1.8, and 1.5 cal ka. Furthermore, based on varve thickness and geochemical data, von Rad et al. (2006) suggest humid conditions and maximum precipitation for the period from 3.9 ka to about 3 ka, which was followed by the onset of gradual aridification that continued until about 2 ka, coinciding with the “long drought” (between 3 ka and 2 ka) of the hinterland in Pakistan, and to the collapse of many old world cultures as enumerated by Cullen et al. (2000). Das et al. (2006) regard weak monsoon persisted during the Little Ice Age (1450-1850 AD), whose intensity dropped still further in Maunder Minimum.
Figures 2 to 5 will summarize the environmental changes in the Himalayan, Central, Southern, and Indian Ocean sectors.
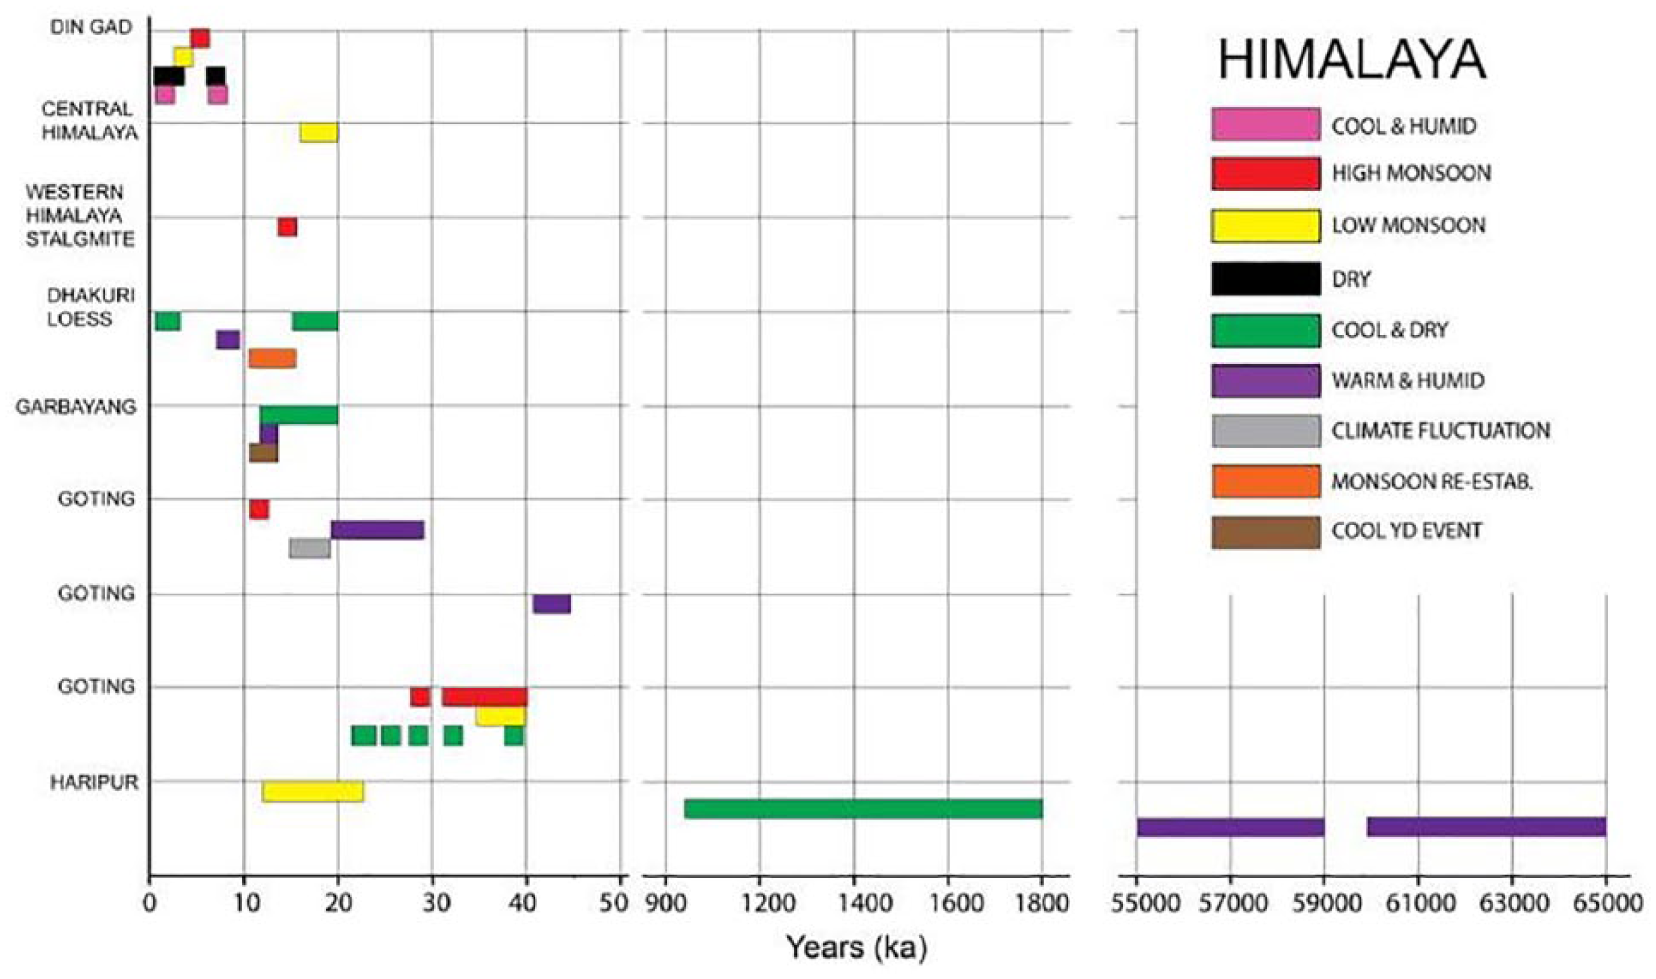
Climatic changes seen across the Himalayan region reveal episodes of monsoonal fluctuations and temperature changes (depiction of temporal changes not to scale).

Holocene climate fluctuations are prominent in Central India region (depiction of temporal changes not to scale).
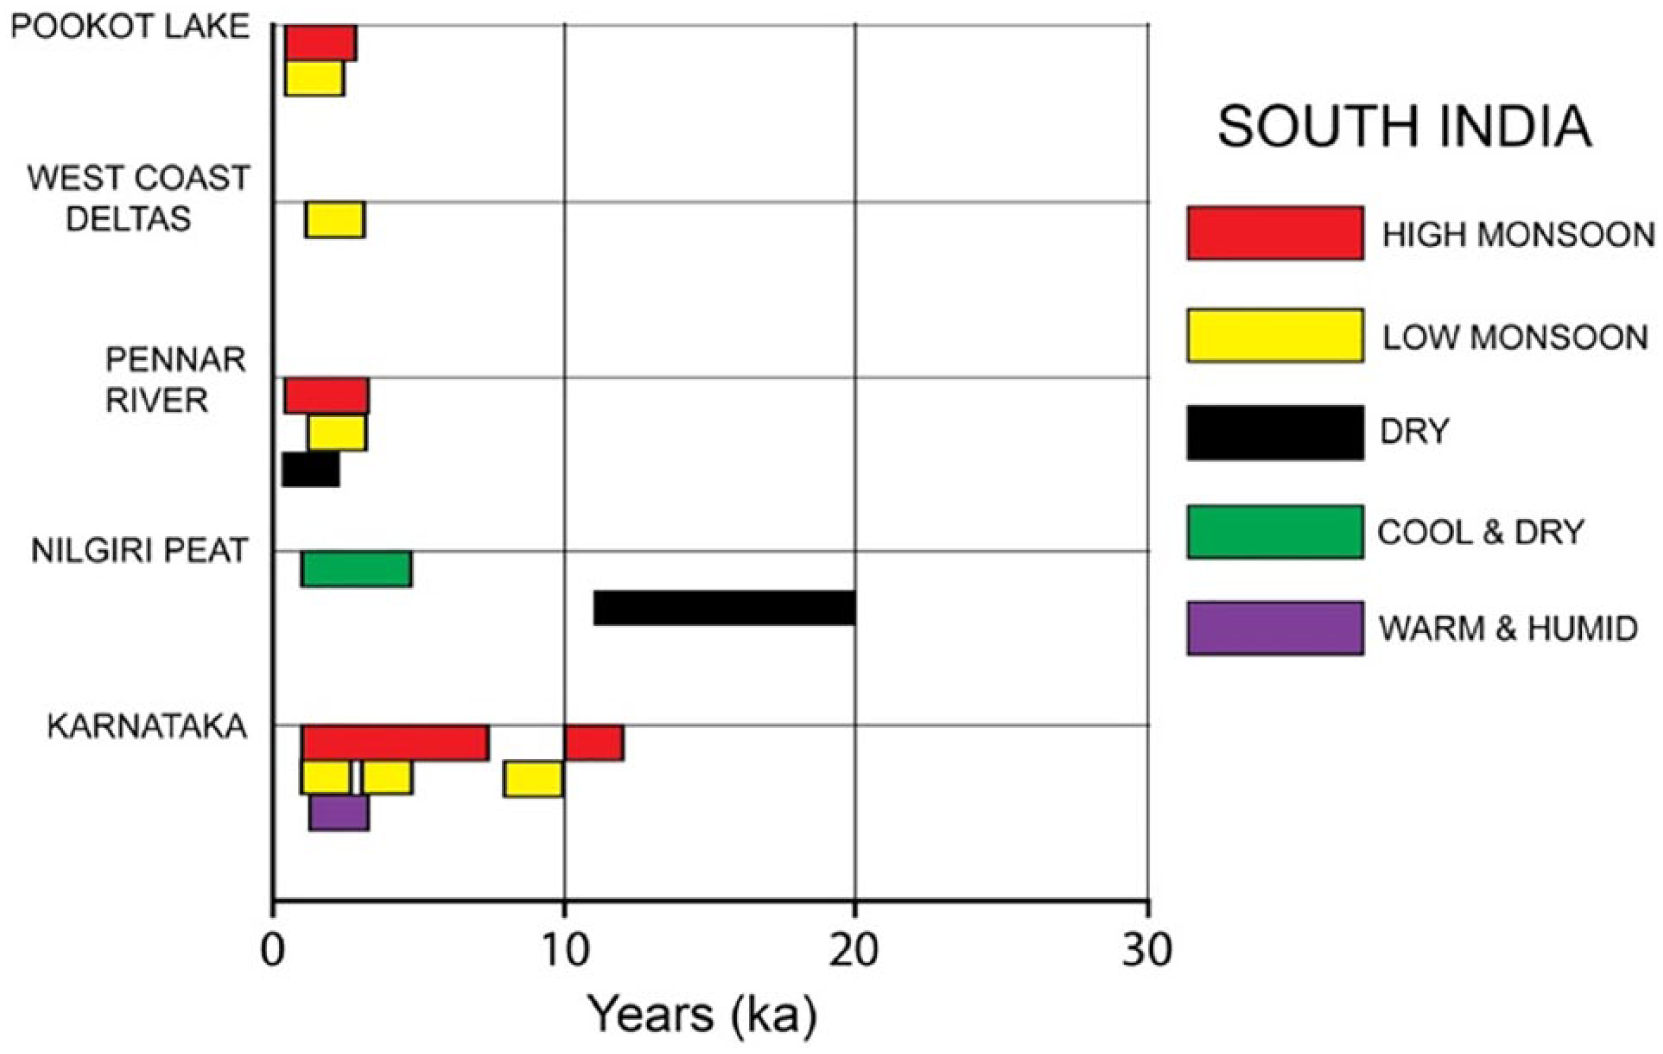
Precipitational and temperature changes in South India are seen to alternate between high and low, and warm and cool (depiction of temporal changes not to scale).

Environmental changes from the Indian Ocean and contiguous region having a bearing on the subcontinental climate (depiction of temporal changes not to scale).
Sea Level Changes
The sea level changes are a manifestation of tectonic and climatic episodes that are responsible for geomorphological modifications in earth. Locally, the sea level rise and fall is sometimes interrelated to upward and downward movement of land, due to some interplay of tectonic forces. Globally, sea level changes may occur due to volume changes in water, initiated by temperature rise, and/or addition of melted snow water. About 20 ka huge ice sheets enveloped many parts of Europe and North America, which stand exposed today. Sea level rise has been a consistent feature from 20 ka to about 11 ka (Kominz, 2001). Investigations in south Greenland demonstrate that the local sea level rose above 31.0 m at ~10965 cal yr BP and decreased rapidly by 8000-6000 cal yr BP to about −8.7 m. This implies quick receding of ice sheet in Lateglacial and early Holocene (Sparrenbom et al., 2006). Mathur and Pandey (2002) suggested epeirogenetic model to explain sea level stands at 18.3 and 6 ka BP, some even older, from the Saurashtra peninsula of Gujarat.
It is now well established that earth’s geoidal shape changes are caused by regional differences in the post-glacial sea level change pattern. The discovery of geoidal deformation brought in an understanding that global data available on sea level differs considerably from place to place and hence cannot be used to construct accurate eustatic curves (Fairbridge, 1961; Morner, 1987; Newman et al., 1980; Pirazzoli, 1991).
Late Holocene has seen decadal to centennial scale sea level fluctuations, which are poorly impacted by glacial eustatic effects caused by mass redistribution. The temporal small scale fluctuation of such redistribution is inferred to be of the order of decimeters (Nakiboglu & Lambeck, 1983). The major effects, however, are brought about by the ocean currents which dynamically redistribute water masses. At about 18 ka, the last phase of glacial maxima, Indian ocean sea surface circulation was drastically different from the existing pattern, and the SW monsoon wind was also weak (Prell et al., 1980).
There is a functional correlation between episodes of transgression, regression, and stationary shoreline, with the imbalance or balance in geologic factors pertaining to intensity of terrigenous sediment input and quantum of relative sea level change. Deltaic morphology is controlled by rise and fall in sea level. Early Holocene is characterized by sea level rise, which on inundation and subsequent stabilization, formed estuaries and deltas (Smith et al., 2011). The evolutionary history of Indian deltas, and consequently sea level fluctuations in the Indian subcontinental sector, has been investigated by Banerjee (2000), Bruckner (1988), Vaz and Banerjee (1997), and Rao and Vaidyanadhan (1979), to name just a few.
Banerjee (2000) has inferred southeast Indian coast reached sea level rise of +4 m above the present low tide level around 4 ka. It remained unchanged till about 2 ka (Achyuthan & Baker, 2002; Banerjee, 2000; Bruckner, 1988), and since then it has been falling. The Little Ice Age saw sea level reached −1 m, with respect to current low tide level (Banerjee, 2000), after which it reached present level (Kunz et al., 2010). At Kaikallur (Andhra Pradesh), tidal reach penetrated 36 km inland from the present coast (Banerjee, 2000; Rao & Vaidyanadhan, 1979). Holocene high stand, the first one, occurred 7300 ±130-110 cal BP, and 1.7 ka later regression occurred. At the same place, sea level rose again at 4.3 cal ka (Banerjee, 2000). The Holocene sea level fluctuations are well documented in many parts of the world (Pirazzoli, 1991; Shennan & Horton, 2002; Woodroffe, 2000; Woodroffe & Horton, 2005; Yang & Xie, 1984; Yokoyama, et al., 2000, and many others) as well as in the Indian subcontinent (Bardhan et al., 2011; Blanchon & Shaw, 1995; Islam & Tooley, 1999; Mukherjee et al., 2009; Nigam et al., 1995). The eastern Indian coast has seen several marine transgressions (Selby, 1985), between 7 ka and 6 ka, during which time shoreline ingressed far inland compared with the present shoreline (Banerjee & Sen, 1987). According to Banerjee and Sen (1987), sea level rose rapidly resulting in quick siltation. Thus, Holocene sea has regressed at regular intervals, the last notable transgression being after 3 ka (Fairbridge, 1961), when the sea is presumed to have touched the present strandline.
Mangroves flourished around Pulicat Lake around 6650 yr BP, but conditions remained unfavorable from 3100-2799 and 2599-2250 yr BP (Farooqui & Vaz, 2000). There was a good cover of mangroves in Bengal Basin around 6500 yr BP (Barui, 2011). The Sundarbans in Ganga–Brahmaputra delta had a good crop of mangroves around 9980 cal yr BP, which disappeared by 9240 cal yr BP, but reappeared by 7560 cal yr BP. The environmental conditions favoring mangrove growth around the Chilika Lake, Odisha, was found to be during 9500 to 7500 yr BP (Khandelwal et al., 2008). Tectonically, the Andaman archipelago group has being experiencing significant neotectonic activity. The Quaternary glacial and interglacial episodes of rise and fall of sea have left their imprints in the archipelago geological column (Bowen, 1978; Narayana, 2002). The Holocene transgression (18 to 6 ka BP) led to rise in sea to about 100 to 130 m at the rate of 10 mm/year (Kennett, 1982).
Synthesis
From the foregoing, it is abundantly clear how climate change and sea level changes have been a recurrent phenomenon in the subcontinent. In fact, climate change is a universal truth. Climate is a dynamic entity and is responsible on many different factors. The parameters of climate have been in nonequilibrium because earth and the sun are in constant dynamic flux altering the physicochemical environment of the earth. Hence, climate change studies have to be given priority, because it involves the survival of all life forms on earth. Any change in the natural process can lead to either deleterious or beneficial effects. The resilience of many life forms in adapting to the changed environmental dynamics has been on display in the geological record. But there are also instances of extinctions of highly evolved animals. The recent trends in many geochemical parameters duly tell us that the climate is changing. But are these changes a part of the overall pattern of climate dynamics? Are these changes natural? How much are humans contributing to these changes, and how much are the natural forcings responsible? The rising temperature and erratic precipitation are globally felt. But there are instances recorded in geological past of drastic temperature rise and fall. The precipitation was also much more erratic in the past than what we experience today. The badlands of the now dry regions of Latur, Osmanabad, and Beed districts of Maharashtra, India, have huge sedimentary deposits over the flat Deccan Traps (Kale & Rajaguru, 1987). These deposits are an indication of a vibrant and enormous fluvial system that was active a few thousand years back. The Indian subcontinent has witnessed multiple climate changes in many parts of its geographical expanse. It revealed how climate change has the potential to alter the precipitation pattern, sea level dynamics, water cycle, flora and fauna survival, extreme climate events, polar ice melting, and agricultural yield.
Current climate vagaries, and those postulated in the future, will impact global population in varied forms. The consequences of extreme events manifested in the form of floods, droughts, and heat waves, and those related to oceanic realm like storms, cyclones, and typhoons has huge economic costs. It also damages the health and well-being of all life forms, just witnessed through Kerala floods of September 2018. The impacts are very telling on the marginalized people. During the duration of floods, the productivity of Kerala dropped considerably, and state government assessed the losses had mounted to the tune of over 2.7 billion dollars (Financial Times, 2018). Conversely, high temperatures are also seen to lead to lower productivity. Climate change effects are documented extensively in different Intergovernmental Panel on Climate Change reports and many other studies. However, how much is the current climate change due to natural forcing and how much is it due to anthropogenic causes has to be assessed dispassionately. As we have seen earlier, climate has been altering its texture even in those days when humans were absent and when they had no, or limited, means to alter the atmospheric composition of the gases. The alterations were all natural. Recently, Bhaskar et al. (2017) estimated relative contribution of natural and anthropogenic components driving the climate change, based on data collected from 1984 to 2005. They found CO2 and CH4 contributes ~24% and ~19%, respectively, to global temperature variability. Volcanic aerosols’ contribution was estimated to be ~23%. They found the secondary drivers of climate change to be ultraviolet (UV) (~9%) and El Nino Southern Oscillation (ENSO) (~12%).
The INCCA (2010) report has simulated temperature changes for 2030s (with respect to 1970s), which reveal increased warming and greenhouse gases, with the mean temperature ranging between 1.7°C and 2.0°C across the length and breadth of India. This variability of seasonal mean temperature is predicted to be more in winters. The precipitation increase is projected to be 5% to 13% in 2030s with respect to 1970s in the Himalayan region, 0.3% to 3% in the Northeastern region, and 6% to 8% along the Western Ghats and coastal region. Extreme temperatures are likely to exacerbate in the 2030s, wherein the lowest daily minimum and highest maximum temperature suggests a warming of 1oC to 4oC. Central India and southern peninsula is likely to witness enhanced night temperatures, with central and northern India experiencing daytime warming as well. The number of rainy days is also likely to increase in the Himalayas but decrease in the rest of the country.
Recommendations
India has voluntarily, and also as a part of global efforts, initiated scores of measures to avoid or mitigate the impacts of climate change (Ministry of Environment, Forest and Climate Change [MoEFCC], 2015). It launched National Action Plan on Climate Change in 2008 and took active measures to reduce emission intensity of Gross Domestic Product (GDP) by 12% from 2005 to 2010. It has set itself a target of 20% to 25% reduction in emission intensity of GDP by 2020. The National Clean Energy Fund has been set up and financed by a carbon tax of Rs. 200 (US$3.2) on each ton of coal. The National Adaptation Fund has also been started with an initial allocation of Rs. 3,500 million (US$55.6 million) to find ways on how cleaner technology can be adopted in agriculture, fisheries, water, and forestry sectors. The renewable energy generation goal has been enhanced five times from 35 GW (March 2015) to 175 GW by 2022. The petroleum subsidy has been cut by about 26% to bring down fossil fuel consumption. Efforts are being made to increase the forest cover. These measures will go a long way in mitigating the impacts of climate change.
India is a Party to the United Nations Framework Convention on Climate Change (UNFCCC), and it becomes incumbent on all members to assess the implementation (MoEFCC, 2015). This assessment revealed national Greenhouse gas (GHG) net emissions amounted to a total of 1.884 billion tons Gg CO2eq in 2010. The forest cover in India was seen to have increased from 14% in 1950-1951 to 21.23% in 2010-2011. The Government of India, to address and mitigate the deleterious effects of climate change, has undertaken many programs that include Integrated Power Development Scheme, Renewable Purchase Obligations, enhancement of cess on coal, Perform Achieve and Trade Scheme and National Program for LED-based lighting. There are almost 137 such programs on national level and about 286 at state level. It is heartening to note that emissions intensity of Indian GDP has decreased by 12% between 2005 and 2010 as part of the missions undertaken by the government. This scenario is quite encouraging.
But to ease the pressure on the environment, the need of the hour is to bring down the consumption of natural resources. Humans are extracting minerals and fossil fuels from the bowels of earth and returning to atmosphere the extracted constituents in a different form. It is changing the entire composition of the atmosphere leading to stark imbalances. The world is trying to control these emissions and almost all the developed and developing nations are doing their best to limit the damage.
Humans have acquired the capacity to alter the course of climate forces through geoengineering. The technological breakthroughs are coming thick and fast to combat climate. However, the efficacy of all these measures can increase manifold if the sensitivity to tackle climate change seeps into and becomes the culture of an individual and a nation.
Conclusion
Climate has been changing continuously in the geological past and is not influenced by just a single factor. It has many variables. The Indian subcontinent has experienced local and regional modifications in monsoon and sea level. The temperature has been alternating between warm and cold in many parts. In summary, it can be seen that the climatic fluctuations are prominent and fickle in the Holocene and Quaternary. The climate variability is more pronounced and seems to have been exacerbated by the atmospheric emissions unleashed by the humans.
Climate change is a slow process and it takes time to damage, if natural. Conversely, it also takes time to repair. The period between damage and repair can be used to acquire adaptation techniques to environmental vagaries. Efforts can be doubled to contain the damage that has been unleashed by adopting strict norms related to pollution of all kinds and in all places. Developed and developing nations need to launch concerted action to tackle this problem. India is doing all it can to stem the climate rot.
Footnotes
Acknowledgements
The authors are thankful to Prof. D. S. Ramesh, Director, IIG, for encouragement and permission to publish this article. Two anonymous reviewers are thanked for their helpful comments.
Declaration of Conflicting Interests
The author(s) declared no potential conflicts of interest with respect to the research, authorship, and/or publication of this article.
Funding
The author(s) received no financial support for the research, authorship, and/or publication of this article.