
Abstract
Daily high/low and close/open prices are the key parameters of candlestick approach in technical analysis. Besides, the price spreads are also important as they represent an upward or a downward trend. In this study, we investigate the relationship between daily high/low prices and close/open prices for precious metals: gold, copper, palladium, and silver. Empirical analysis has been performed through fractionally cointegrated vector autoregression (FCVAR) model. To observe the relationships, the trends are tested for their characteristics in both states: positive and negative spreads in close/open prices. Results indicated that for a positive trend, high/low spreads have a negative impact on close/open spreads in long run relationship. However, when closing price is less than the opening prices, it is revealed that expanding range in high/low spreads causes a rise in close/open spreads for copper and silver differently from gold price.
Introduction
Predictability of asset prices is most likely the most appealing topic in finance literature. Random walk and Efficient Market Hypothesis of Fama (1965, 1970) and subsequent studies, which either support or criticize these theories, occupy a significant portion of finance literature. Observed patterns in financial time series motivate researchers to predict the direction of asset prices and, therefore, the returns. Consequently, two basic approaches have evolved in finance theory: fundamental analysis and technical analysis. These two approaches evaluate the price innovations from two different perspectives.
As stated by Lo, Mamaysky, and Wang (2000), the main objective in technical analysis is to extract the nonlinear patterns from noisy data. To put a finer point on it, technical analysis tries to catch some certain price patterns in time series through particular mathematical models to predict the future price movements. According to technical analysis, while some price movements serve to form certain patterns, other price changes are solely random. However, fundamental analysis states that asset prices are martingale, that is, price innovations are random and historical price behaviors cannot be used for predictions, because current stock price already incorporates and reflects past relative information. Therefore, it can be said that fundamental analysis attempts to measure intrinsic value of an asset by evaluating respective economic and financial variables at macro and micro level.
As stated by Lan, Zhang, and Xiong (2011), one of the essential methods in technical analysis is candlestick approach which was introduced by Japanese rice traders in the mid of 16th century. Candlestick approach can be seen as the combination of line and bar charts. Structure of candlesticks includes the following price information: open price, close price, daily high price, and daily low price. When the close price is higher than the open price then the main body of candlestick is to be hollow. If the close price, however, is less than the open price then candlestick will be filled, usually with red color. The lines above and below the main body correspond to daily high and daily low prices, respectively. These lines are called as tails or shadows. Edge of these lines show the lowest price of day (at bottom) and highest price of day (on top). The spread of this high/low prices and close/open prices gives some clues regarding the market fluctuation and direction of price movement. For example, when we have higher spreads in high/low prices, it means that in tick period, the fluctuations in the prices are large and vice versa. In addition, if the close/open spread is positive, it means that the asset price has an upward trend, conversely, for a negative spread in close/open spread asset prices have a downward trend in the tick period.
In the current study, based on the dynamics of candlestick method, we seek to examine the relationship between high/low spreads and close/open spreads. Our theoretical expectation is to see larger values in close/open spreads for large high/low spreads, because widening high/low spreads are the indicators of uncertainty in asset prices. When we have high volatility in the market, it means that asset prices might go any direction (up or down) wildly and these innovations might bring wider spreads between daily high and low prices. Therefore, any uncertainty or fluctuation during the day might cause greater margin in close/open spreads in a tick period.
Literature Review
In this section, we classify the literature under two groups: technical analysis based on candlestick studies and econometric dimension for fractionally cointegrated vector autoregression (FCVAR) model.
Morris (2006) demonstrates that provided the trend is defined correctly, candlestick analysis might bring true trading signals. Lan et al. (2011) introduce a new candlestick analysis which determines reversal points in stock price through fuzzy logic theory. They show that proposed model convincingly identifies turning points in selected stocks. Roy, Sharma, and Kowar (2012) also investigate the performance of candlestick analysis using a fuzzy logic approach. Xie, Zhao, and Wang (2012) examine the performance of candlestick method and state that candlestick method provides predictive information of in-sample (IS) and out-of-sample (OOS) forecasts. However, Prado, Ferneda, Morais, Luiz, and Matsura (2013) reveal that candlestick patterns do not bring predictive information for the future forecasts in Brazilian stock market. Similarly, Joseph et al. (2015) also suggest that candlestick analysis itself is not enough to increase the accuracy in trading strategies. In a different study, Li, Feng, and Feng (2015) rather apply candlestick charts in prediction of stress level change of teens on a micro-blog platform and verify the power of the method. Similar to the study by Prado et al. (2013), by using the bootstrap methodology, Marshall (2005) demonstrates that an investor cannot outperform the benchmark market index through candlestick analysis. Caginalp and Balevonich (2003) develop a foundation for the technical analysis through a dynamical microeconomic model and implement the model in candlestick analysis. Tharavanij, Siraprapasiri, and Rajchamaha (2017) examine the performance of bullish and bearish candlestick reversal patterns through applying the skewness adjusted t test and the binomial test. Results show that candlestick patterns are not robust in the estimation of market directions.
The FCVAR model is a relatively new method in literature and it is introduced by Johansen (2008) and Johansen and Nielsen (2010, 2012, 2014). As the model is quite new, there are only a limited number of studies available in finance literature which has used this model. In one of the studies, Dolatabadi, Nielsen, and Xu (2016), later, improved the model by allowing deterministic linear trends in the observed variables. They implement this extended model on commodities such as aluminum, copper, lead, nickel, and zinc to see the relationship between spot and futures prices. By using the FCVAR model, Maciel (2017) analyzes daily high and low prices of the assets listed in Brazilian stock market; his results suggest a cointegration relationship between variables. Carlini and Santucci de Magistris (2013) discuss identification problems in FCVAR model. They stress on the importance of evaluation of F(d) condition, which is the generalized form of I(1) and indicates fractional difference, for the fractional parameters and lag structure. Gil-Alana, Mudida, and Carcel (2017) examine electricity prices in Kenya through FCVAR model. Results reveal that series are fractionally cointegrated and oil prices and interest rates have significant positive effects on electricity prices. Baruník and Dvořáková (2015) investigate the long run relationship in daily high and low stock prices by utilizing FCVAR model. They concluded that FCVAR model is a useful alternative to model the range-based volatility.
Method
To attain the fractionally cointegrated vector autoregressive model, the easiest way to start is using well-known cointegrated vector autoregression (CVAR) model of Johansen (1995). By following the definition of Dolatabadi et al. (2016), FCVAR model can be presented as follows: for

where

and for

where long run parameters are
Empirical Analysis
In this study, we implement FCVAR model of Johansen (2008) and Johansen and Nielsen (2010, 2012, 2014) for precious metals: gold, copper, palladium, and silver. In empirical analysis, we examine the impact of daily high/low spreads on close/open spreads. These two spreads present very useful information in the technical analysis and are used in candlestick method. The period we analyze is from January 2, 2002, to November 22, 2017. All the data are obtained through www.stooq.com and empirical analysis is conducted through Matlab codes of Nielsen and Popiel (2014) and Rhinelander (2015). Daily spreads of the data can be seen in Figure 1.

Daily spreads of variables.
Before proceeding long run relationship in corresponding spreads first, we test fractional integration through Hurst and detrended fluctuation analysis (DFA) analysis to see whether FCVAR is a relevant model. Following long memory analysis, we implement FCVAR model and discuss the results.
Fractional Integration Tests
In our empirical analysis, we use the FCVAR model of Johansen (2008) and Johansen and Nielsen (2010, 2012, 2014). As stated by Chen and Hurvich (2003), while standard cointegration analysis utilizes only integer values (where
Fractional Process Tests.
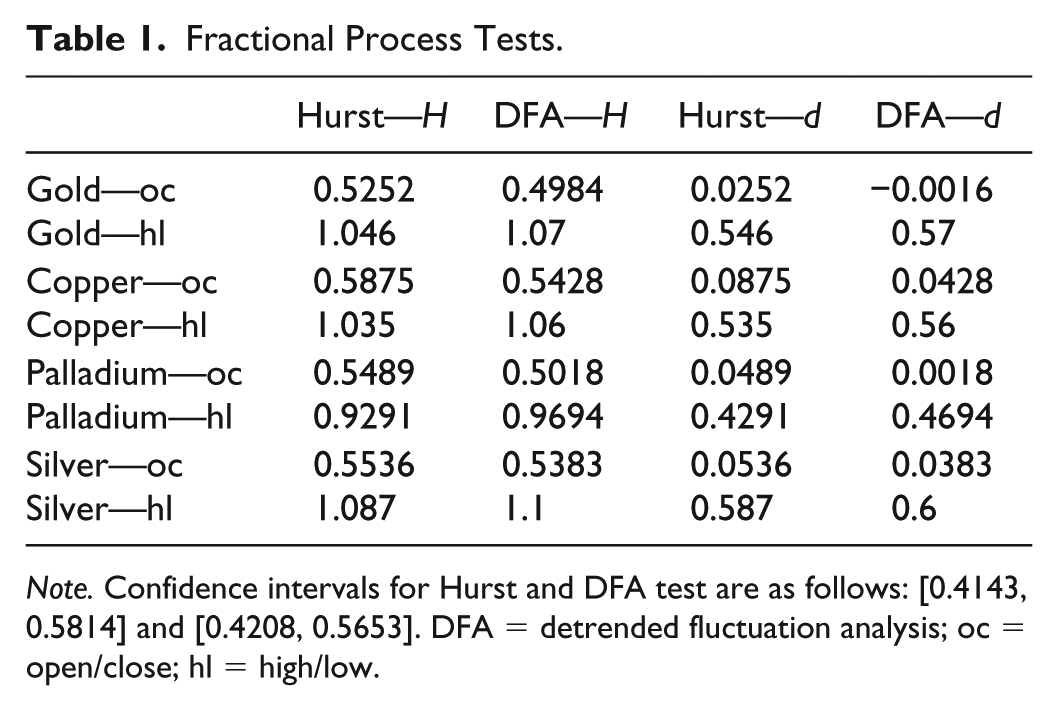
Note. Confidence intervals for Hurst and DFA test are as follows: [0.4143, 0.5814] and [0.4208, 0.5653]. DFA = detrended fluctuation analysis; oc = open/close; hl = high/low.
As seen in Table 1, first and second columns present the Hurst exponent
Specification of FCVAR Model
Following the long memory analysis of time series likewise, in conventional VAR model, we should define the lag augmentation of the system. Here, in this stage, we follow the general to specific order of Jones, Nielsen, and Popiel (2014) and use
Lag Selection Results.
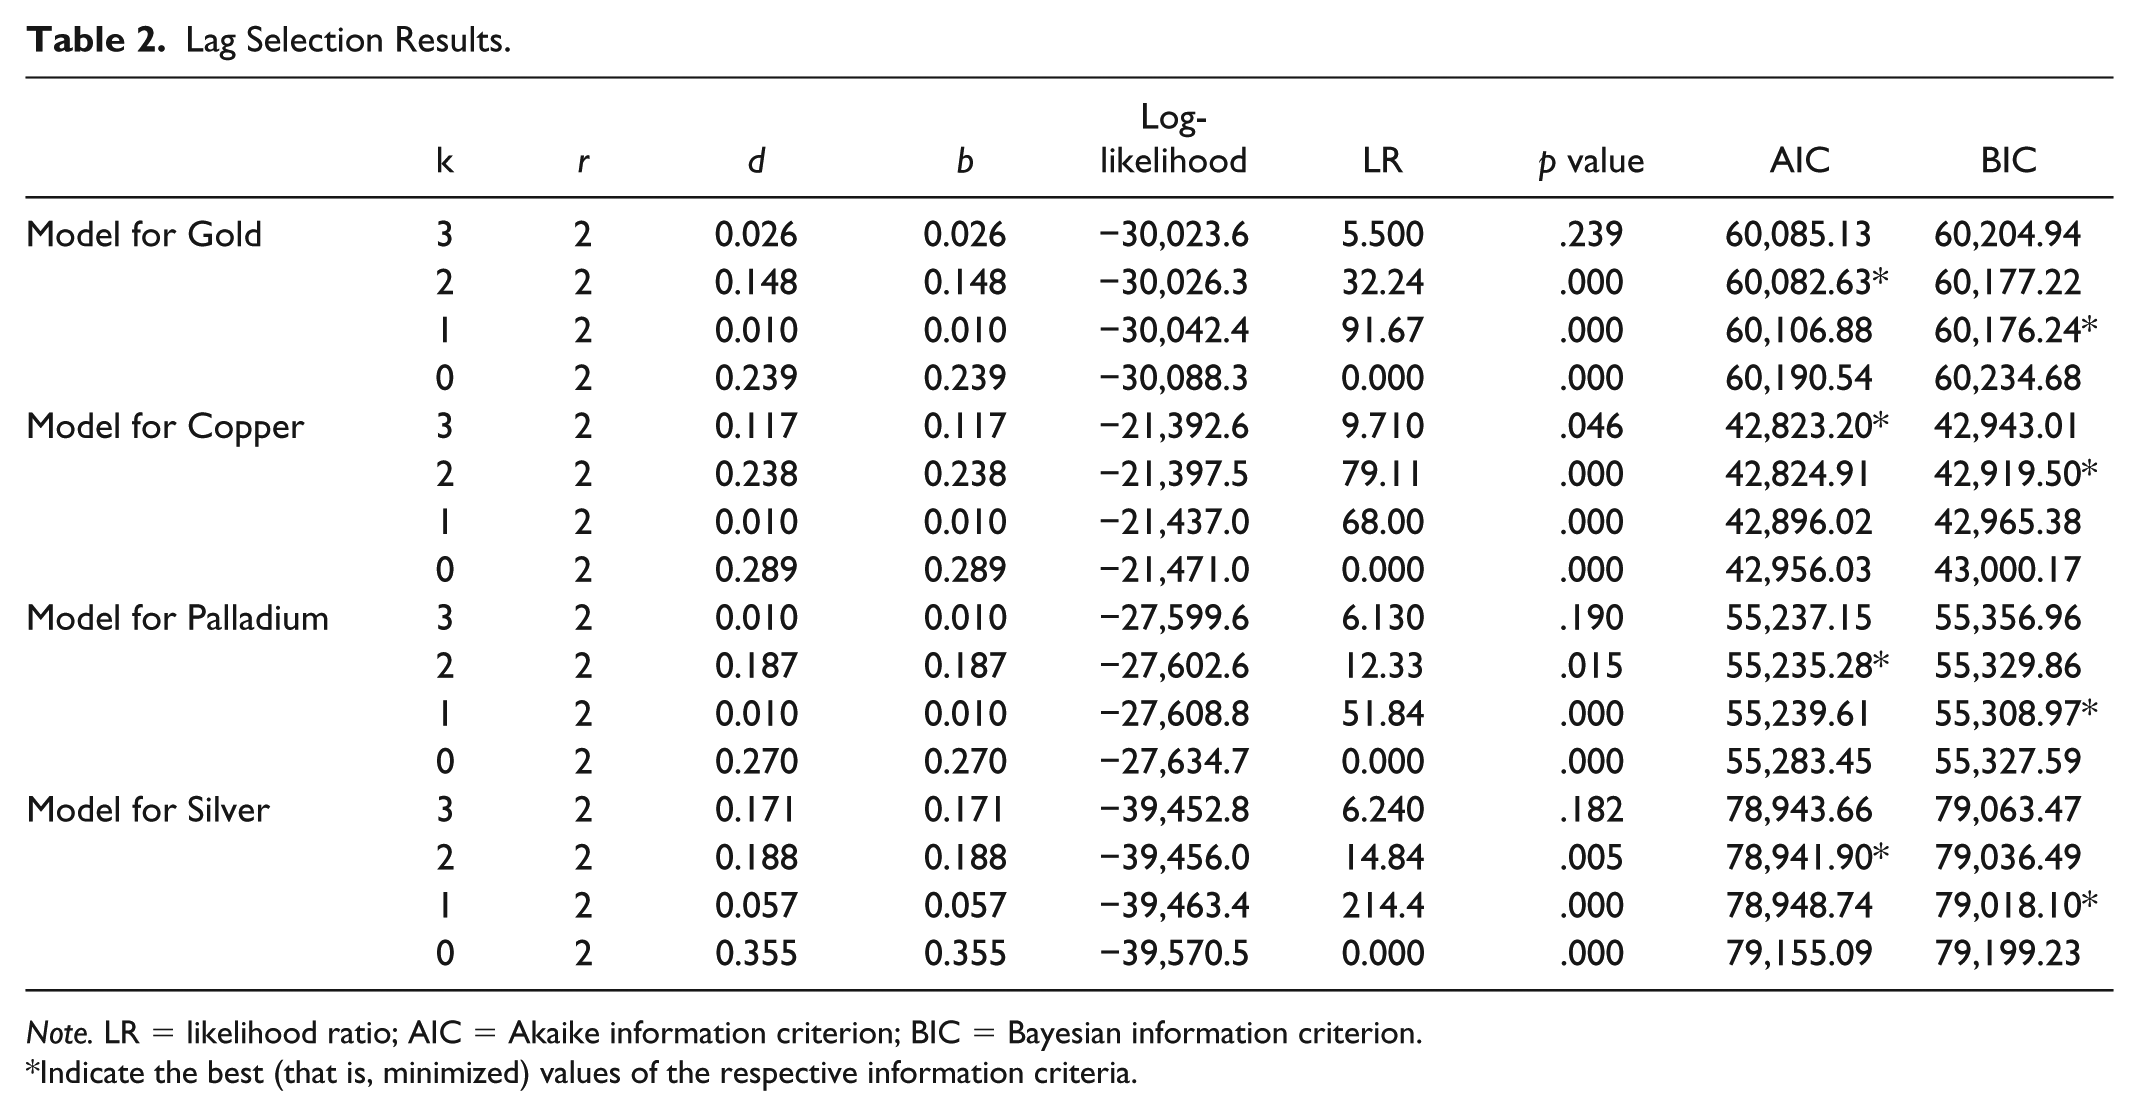
Note. LR = likelihood ratio; AIC = Akaike information criterion; BIC = Bayesian information criterion.
Indicate the best (that is, minimized) values of the respective information criteria.
Results indicate that except for the model of palladium, as the coefficient of highest order lag is significant at 99% confidence level, in all other systems, we choose
LR Tests for Cointegrating Rank.

Note. As it is pointed by Nielsen and Popiel (2014), p values for the cointegration rank tests are not provided by the main code. Researcher should use additional code of Jason Rhinelander: https://github.com/jagerman/fracdist/releases. LR = likelihood ratio.
Following the proper selection of lag and rank of systems, in this stage, we estimate and interpret the parameters of our models. Results are given in Table 4. We also provide the inverse roots of the characteristic polynomial in Figure 2. A high spread between daily high and low prices of any asset indicates a high fluctuation in trading day. Theoretically speaking, existence of large range in high/low spreads would cause a large range in close/open spreads, because larger spread in daily high and low prices would bring an uncertainty in the direction of asset price, and this uncertainty would lead to a high range in close/open spread as well. However, according to our results in Panel 1, in long run equilibrium models, we have a negative relationship between high/low and close/open spreads with following values for beta in cointegrating equations: −0.196, −0.069, and −0.045. These results indicate that large high/low spreads lead to decrease in close/open spreads. This finding shows that when range in high/low spreads increases, it would provide less fluctuation in daily close/open spreads. These results are not consistent with our theoretical expectations. However, it should be kept in mind that so far we did not take into account the following fact: closing price might be lower than the opening price in a tick period. Therefore, based on the location of closing price on open price, the spread might be negative or positive.
Fractionally Cointegrated Vector Autoregression: Estimation Results.
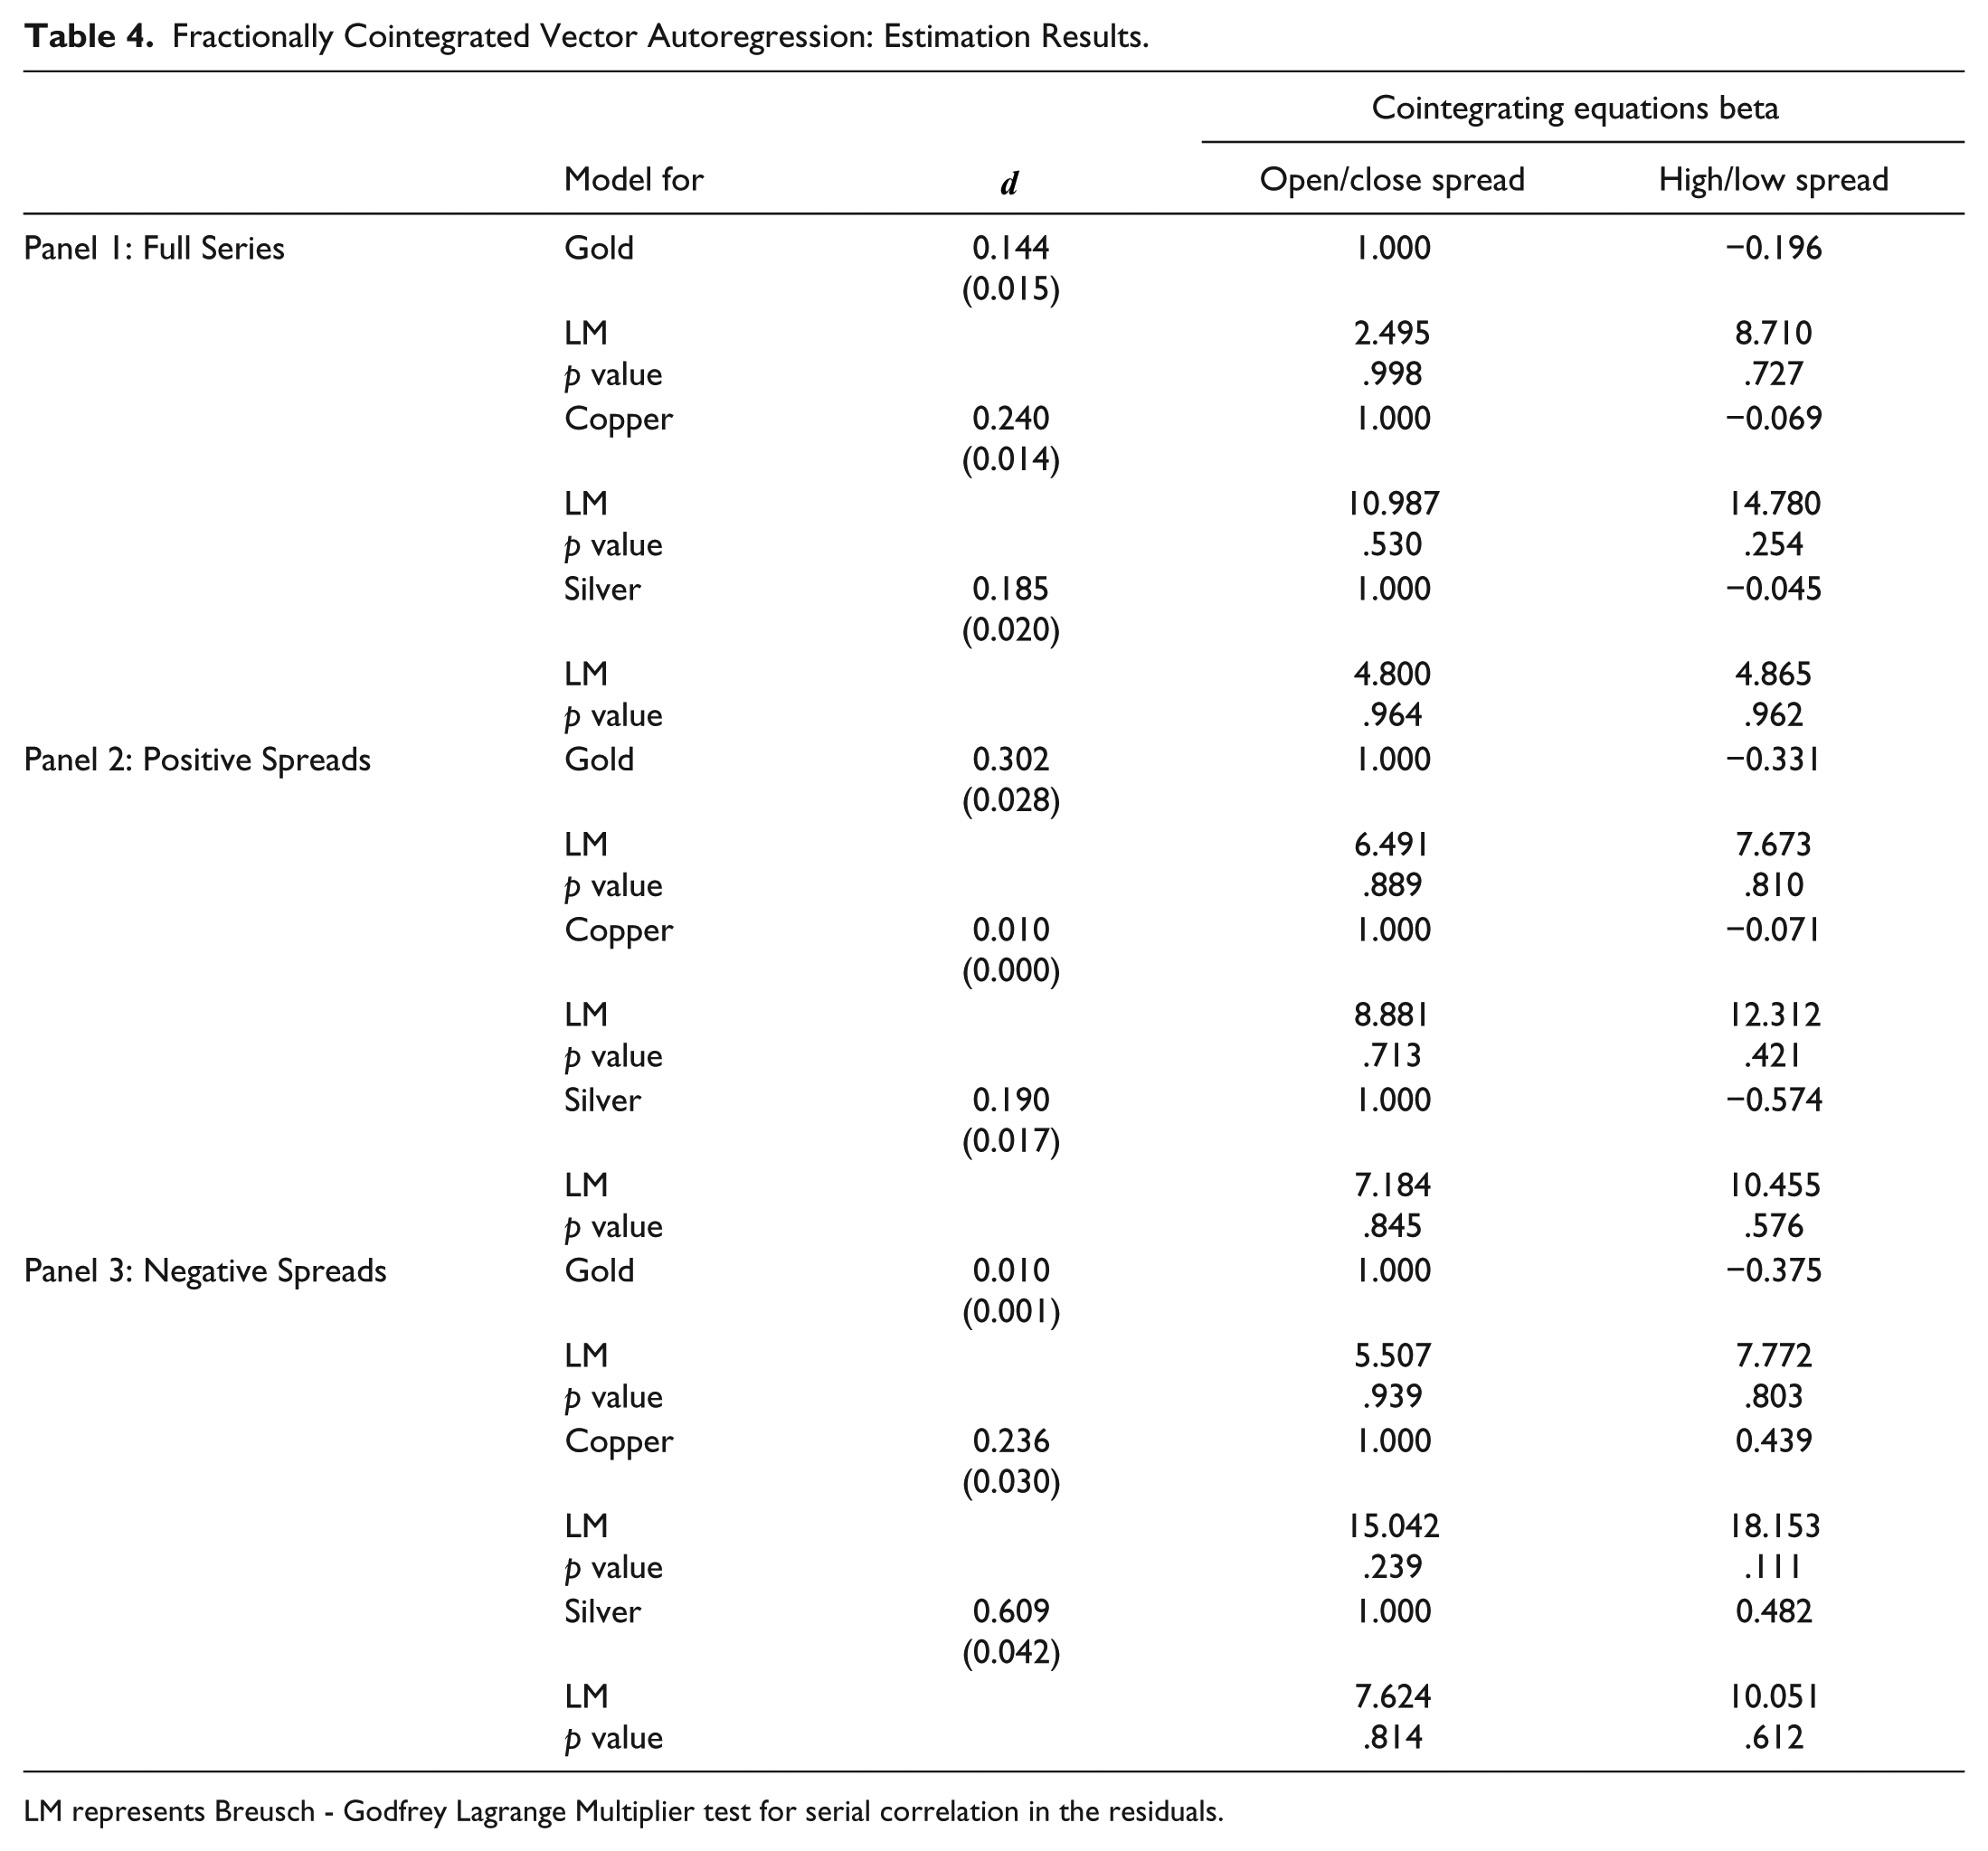
LM represents Breusch - Godfrey Lagrange Multiplier test for serial correlation in the residuals.

Inverse roots of the characteristic polynomial.
By considering two possible locations of closing price in a tick period, it might be greater or lesser than the opening price, we reclassify our data: we separate the negative close/open spreads from positive spreads and match each daily spread with the corresponding high/low spread. For factoring in this specification, we estimate two more models (Panel 2 and Panel 3) for each variable. This correction would allow us to consider the trend in time series. Because, if closing price is less than the opening price, it would yield a downward trend in the asset price, or vice versa.
Following the reclassification of our data in our first model (Panel 2), we investigate the positive spread in close and open prices. Here, in this case, closing price is above the opening price, that is, we have upward trend. For the second condition (Panel 3), the closing price is below the opening price and therefore a negative spread. According to our findings for Panel 2, just as similar to the results in Panel 1, any increases in high/low spreads lead to decrease in open/close spreads in long run. However, Panel 3 indicates that if the closing price is less than the opening price, that is, asset price has a downward trend, with higher fluctuations in a tick period, the open/close spread widens in copper and silver variables. However, the results in gold model still remain consistent with the previous model. Higher fluctuations in gold prices during the day will cause lower spread in open/close prices. These results are also supported by the diagnostic statistics of the model. According to the results of LM test, it can be seen that residuals do not display a correlation in all variables and models.
Conclusion
The patterns seen in asset prices in past might repeat afterward. This is the key assumption of technical analysis. One of the basic tools in technical analysis is candlestick method which is based on examination of daily high/low and close/open prices. Although there is an interest to this method and its parameters, to the best our knowledge, the relationship between these prices are not examined in literature. Hence, considering this gap, in this study, we analyzed the long run relationship between high/low and close/open spreads of some precious metals—gold, copper, palladium, and silver—through a new method: FCVAR model. As FCVAR model allows the fractional cointegration which is one of the stylized facts of financial time series, comparatively, it can present more robust and reliable results for the researchers. Our analysis is conducted for two different conditions. In the first section, we analyzed the effect of high/low spreads on close/open spreads. Results of beta in cointegrating equations showed that there is a statistically significant long run relationship between these two variables: high/low spreads has negative impact in close/open spreads. This situation means that larger ranges in high/low spreads lead to smaller close/open spreads in the long run. As the results are not consistent with our theoretical expectations, the model was modified to differentiate between a positive and negative close/open spreads. Therefore, in this section, we matched the corresponding data by separating negative and positive spreads in close/open spreads. Results exhibited that while the model for gold prices display the same sign in beta parameter, the sign of copper and silver has been positive, meaning that increasing spread in high/low prices lead to a rise in close/open spread provided that the closing price is lower than the opening prices.
Footnotes
Declaration of Conflicting Interests
The author(s) declared no potential conflicts of interest with respect to the research, authorship, and/or publication of this article.
Funding
The author(s) received no financial support for the research, authorship, and/or publication of this article.