
Abstract
To determine the challenges that residents of rural Kentucky face regarding diabetes self-management and to identify methods that may promote diabetes management based on a population’s needs, semistructured questionnaires were used to interview 71 adults with diabetes (40 food pantry customers and 31 grocery store customers). Although 70.1% reported following healthy diets, only 43.3% could correctly choose between pairs of healthy/unhealthy food options. Only 21% of food pantry customers (assumed low-income participants) ate healthy. Lower income participants had a 7.79 times greater chance of having a family history of diabetes and had lower perception of having proper weight than grocery store customer participants (p = .036). Of all participants, 85.5% were motivated to manage their diabetes through diet, and 73.8% were interested in attending free healthy cooking classes. Participants who believed that diet is important in controlling diabetes revealed greater interest in attending cooking classes (p = .017). To promote healthy diets, offering free healthy cooking classes may be an effective way of communication with patients with diabetes from lower socioeconomic and educational status.
Keywords
Introduction
Background
Compared with the rest of the United States, Kentucky has a particularly high rate of type 2 diabetes, with 12.5% of adult population affected by the disease in 2013 (Department for Public Health, 2016). Type 2 diabetes is especially common in rural Eastern Kentucky, with some counties having up to 20% prevalence in their Medicaid populations (Department for Public Health, 2016). The Kentucky Homeplace, developed by the University of Kentucky Center for Excellence in Rural Health, is a health worker initiative which links rural Kentucky residents with medical, social, and environmental services. A study found that 74.6% of the Kentucky Homeplace clients were at moderate to significant risk of having or developing diabetes (Feltner, Ely, Whitler, Gross, & Dignan, 2012). This rate was much higher than that for other adults in Kentucky, for whom previous studies estimated a 50% risk (Feltner et al., 2012).
Poor food choices and obesity among residents of Appalachia and rural Eastern Kentucky have contributed to the high prevalence of type 2 diabetes (Amarasinghe, Souza, Brown, Oh, & Borisova, 2009). Low socioeconomic status, dominant in the region, also contributes to this status (Connolly, Unwin, Sherriff, Bilous, & Kelly, 2000). Lifestyle modification can often prevent type 2 diabetes, even when an individual is genetically predisposed to the disease (Nourbakhsh, Ashrafzadeh, Hafizi, & Naseh, 2016; Serrano, Leiferman, & Dauber, 2007).
In addition, many residents of Appalachia and other rural areas struggle with reading and comprehending health information (Huttlinger, Schaller-Ayers, & Lawson, 2004). When health literacy is low, care activities become complicated. This prevents those with chronic diseases from understanding their disease process and the way they can improve their condition through lifestyle modification or medication therapy (Huttlinger et al., 2004). Thus, lack of education results in decreased engagement in activities that promote health (Huttlinger et al., 2004).
Previous research has shown that a single nutrition counseling session with a registered dietitian improved short-term blood values for rural Kentucky patients who were suffering from metabolic diseases (Gaetke, Stuart, & Truszczynska, 2006). The American Dietetic Association (ADA) has demonstrated through clinical trials that its nutrition practice guidelines are effective in improving glycemic and other metabolic outcomes (Franz, Boucher, Green-Pastors, & Powers, 2008).
Objectives
With diabetes-related health care services costing Kentucky hundreds of millions of dollars annually (Department for Public Health, 2016), public health officials want to understand their priority population to create relevant and effective diabetes management programs. Toward this goal, this study investigates lifestyle challenges, knowledge, and diabetes self-management practices of people with diabetes in rural Eastern Kentucky and proposes community-based interventions to improve the health of the people with diabetes.
Materials and Methods
Study Design
Two convenience samples of self-reported participants with diabetes were surveyed using a semistructured questionnaire for interviews. One sample consisted of individuals with diabetes who were receiving food items from the local food pantry, suggesting lower income levels. The second sample consisted of shoppers at local grocery store who had diabetes. This group may represent people with diabetes from a variety of income levels within the local community.
Setting
During the spring in 2015, one table with a sign reading “Diabetes Research” was set up at the entrance of a food pantry and another table at a local grocery store in McCreary County located in the rural Appalachian region of Kentucky. All participants were adults who had diabetes (four participants were caregivers for a close family member with diabetes and responded to the questionnaire with the information related to their relative with diabetes). The researchers were present at the table and responded to each participant’s questions. Authors performed short interviews at the completion of each questionnaire, with the goal of identifying any further concerns or comments that the participants had about managing their diabetes.
Participants
Forty low-income participants with diabetes at a food pantry (food pantry customers) and 31 participants with diabetes from the general population (grocery store customers) at a local grocery store participated in the study.
Variables
The measured variables included education level, knowledge of short-term and long-term consequences of diabetes, food knowledge, self-perception of weight, motivation level for changing health behaviors, and barriers for diabetes self-management. Education level was a self-reported measure, with options being “less than high school,” “high school/General Education Development (GED),” “some college,” and “college degree.” Knowledge of consequences of diabetes was calculated by adding the 5-point Likert-type scores received for six short-term side effects and four long-term side effects of diabetes. Food knowledge was measured using four questions that asked the respondent to select the healthier food option from separate pairs, with the correct response coded as 1 and the incorrect coded as 0. Possible values on the scale ranged from 0 to 4. Self-reported perception of each individual about his or her own weight was determined based on the response to a question that categorized participants to three weight levels: proper weight, need to lose weight, and need to gain weight. To determine motivation levels for changing health behaviors, participants were asked to choose one of five levels of motivation (the additional sixth level was relapse) (Praphath & Anand, 2016). To evaluate the barriers for diabetes self-management, a question included 11 options for different barriers, and the additional 12th was an open-ended option for participants to write any further barriers they had.
Data Sources/Measurements
A questionnaire was developed that included both open-ended questions and 5-point Likert-type scales (Appendix). The questionnaire and research were approved by the institutional review board (IRB; IRB 15 – 408), and all participants signed an IRB-approved consent form. A part of the questionnaire included four open-ended questions which asked about the foods participants typically ate for each meal as follows: “What are typical foods you eat for dinner?” Similar open-ended questions asked about their typical breakfast, lunch, and beverage choices.
The data collected were thematically analyzed via a six-stage process that has been developed and outlined by Braun and Clarke in their published research (Braun & Clarke, 2006).
Bias
Participation was voluntary and each participant received only five dollars in cash as a thank you for their participation to avoid incentive bias. The authors remained good listeners during the interviews and took notes.
Study Size
The sample size for the study was determined by the formula
Quantitative Variables
The continuous data were calculated by adding the 5-point Likert-type scores received in response to each question. Also, to quantify the qualitative data from the open-ended questions and interviews, responses were categorized based on identified common themes and then were coded based on emerging patterns and were reported as the frequencies.
Statistical Methods
SPSS software (Version 23, IBM Corporation) was used for analyzing quantitative data. Student’s t tests were performed to test the differences between two participant groups’ means for continuous data. Pearson chi-square tests were used to identify the associations between the two participant groups for their categorical data. Multivariable regression analysis compared participants’ priorities in choosing methods for controlling their blood sugar. To control for confounders, multivariable regression analysis was used to identify factors that could predict the interest in attending cooking classes. Missing data were excluded from analyses. Significance was defined at p < .05.
Results
The majority (63.2%, n = 43) of participants were female. The average age was 52.8 years among low-income participants and 47.0 years among grocery store customer participants.
Approximately 70.1% (n = 47/67) of participants reported that they were following a healthy diet. However, only 43.3% (n = 29/67) could correctly identify all four of the healthy food options. Furthermore, details of the typical meals of food pantry customer participants showed that only 21% (n = 7/34) were eating healthy (if their regular meals included consumption of multiple food items with high contents of saturated/trans fats, sugar, or salt, their diet was considered “unhealthy”). Within the food pantry group, 45% (n = 18/40) responded that they “do not have enough knowledge about how to control blood sugar” and/or said “they needed more education on controlling diabetes” compared with 52% (n = 16/31) of people within the grocery store group (odds ratio [OR] = 0.77, 95% confidence interval [CI] = [0.29, 1.96], p = .58). Participants mostly chose “lack of health knowledge” and “high cost of healthy foods” as the barriers to managing diabetes, as presented in Figure 1.

“Lack of health knowledge” and “high cost of healthy foods” were the most regarded barriers to diabetes self-management efforts (presented as frequency).
Most (85.5%, n = 59) said that they are motivated to manage their diabetes through diet. From the pooled data for both participant groups with diabetes, 73.8% (n = 48/65) were interested in attending healthy cooking classes (84% [n = 21/25] of grocery store customer participants vs. 67.5% [n = 27/40] of food pantry customer participants; p = .14). Similarly, Pearson chi-square analysis (χ2 = 2.17, p = .24) indicates that there is no association between income status and interest in cooking classes.
Pearson chi-square test (χ2 = 10.21, p = .003, φ = .38) as well as independent t test that compared percentages showed that food pantry customer participants had a higher chance of having a family history of diabetes among their close family members compared with grocery store customer participants (92.5% [n = 37/40] vs. 61.3% [n = 19/31], p = .003). Both results indicated that low-income communities had a higher chance of having a family history of diabetes. A corresponding odds ratio (OR = 7.79, 95% CI = [1.96, 30.99]) showed that lower income participants were 7.79 times more likely to have a family history of diabetes.
Self-reported perception of having proper weight was lower among food pantry customers—21% compared with 45% among the grocery store customer participants, t(68) = 2.145, p = .036. Self-reported perceived need to lose weight was 69.2% (n = 27/39) among the food pantry customers compared with 52% (n = 16/31) among grocery store customers with diabetes. However, the difference did not reach statistical significance (p = .16).
Using independent-samples t tests, the means for acknowledging the short-term—t(68) = .611, p = .54—as well as the long-term—t(65) = .322, p = .75—consequences of diabetes were similar between the two groups.
As Table 1 shows, the p values resulting from independent-samples t tests comparing behaviors/beliefs (as dependent variables) between the two sample populations with diabetes (as independent variables) mostly did not show statistical significance. However, education level was low for both groups and was significantly lower among the food pantry customer group—χ2 = 10.69, df = 3, p = .014.
Comparing Two Sample Populations With Diabetes in McCreary County, Kentucky.
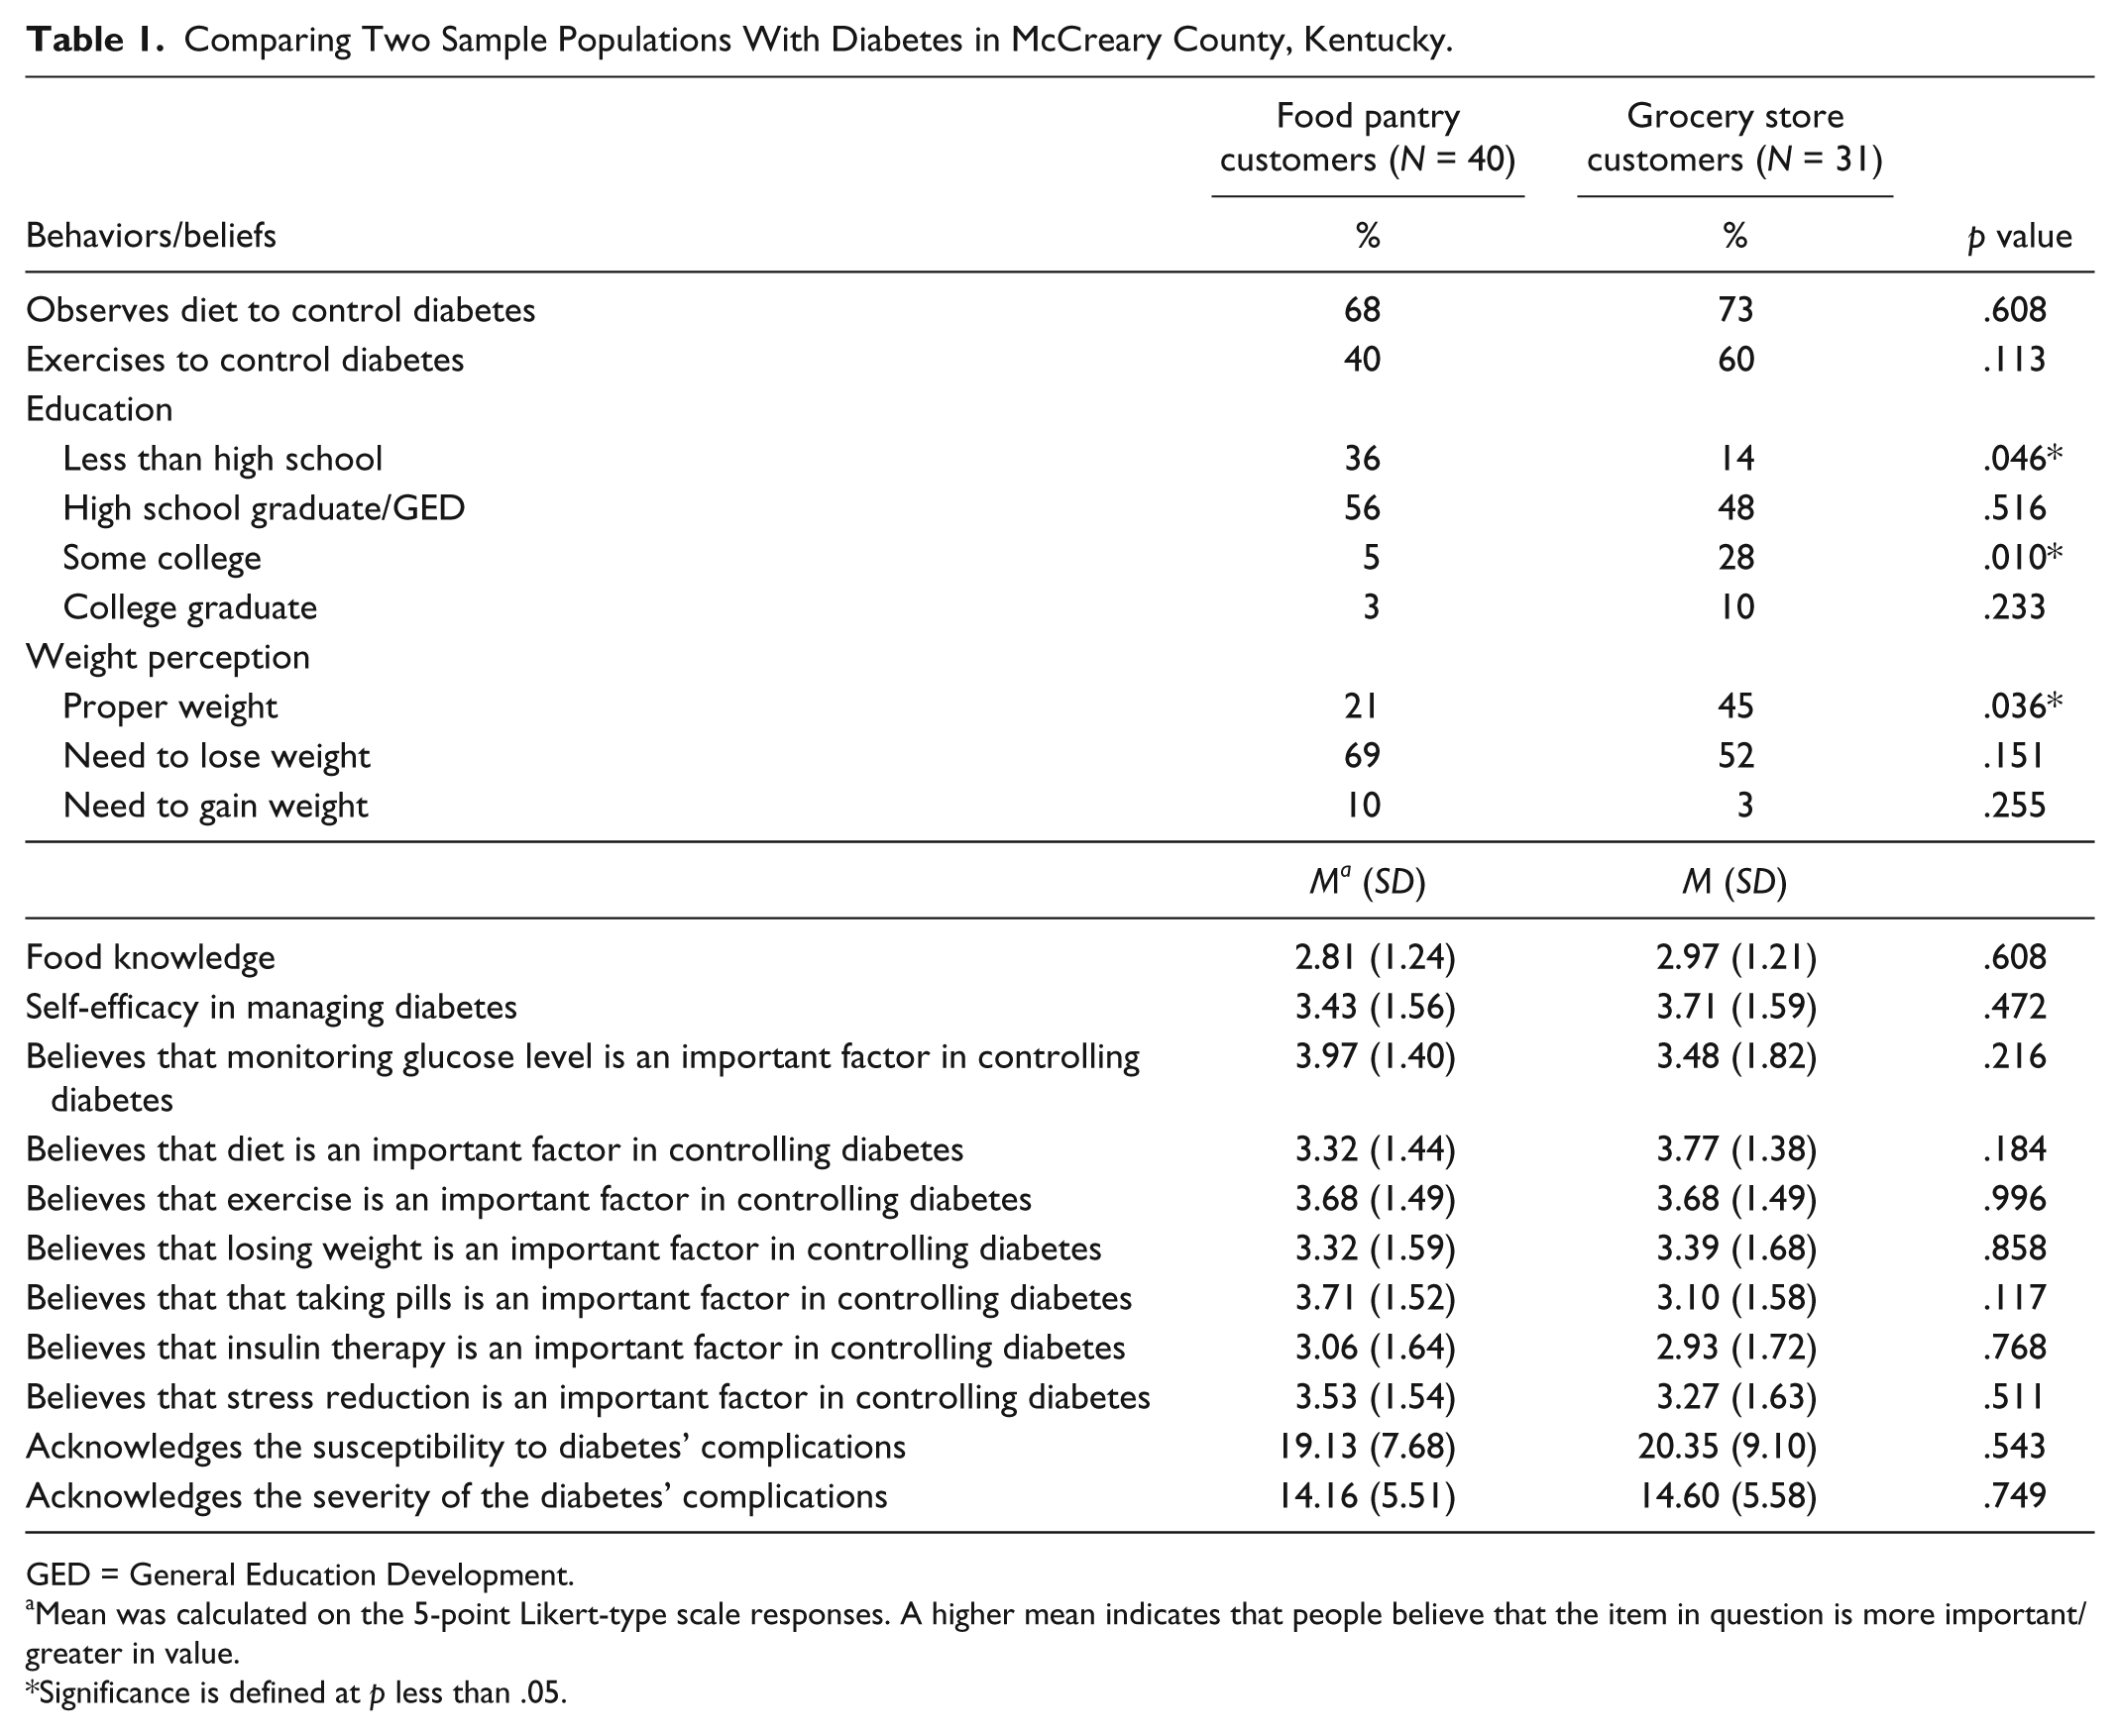
GED = General Education Development.
Mean was calculated on the 5-point Likert-type scale responses. A higher mean indicates that people believe that the item in question is more important/greater in value.
Significance is defined at p less than .05.
Of the total sample population, 70.1% (n = 47/67) said that they were watching their diet to control their blood sugar (p = .0005). However, only 49.3% (n = 33/67) of the total sample population said that they exercised regularly to control their blood sugar (p = .45). Participants who responded that they are watching their diet had no difference in their weight status compared with participants who were not observing their diets—χ2 = 2.27, df = 2, p = .32.
Student’s t test to compare beliefs in the importance of observing diet in controlling blood sugar (p = .95) as well as multivariable tests to compare beliefs in methods important in controlling blood sugar (diet, physical exercise, losing weight, taking oral pills, insulin therapy, monitoring their blood glucose regularly, and reducing stress) did not show a statistically significant difference between the two groups. However, multivariable regression analysis showed that participants who believed diet has the highest effect in controlling blood sugar level revealed the most interest in attending cooking classes compared with participants who prioritized other methods (monitoring glucose, physical exercise, and taking diabetes medications) as means of controlling their blood sugar—F(1, 59) = 6.02, p = .017—with an R2 of .09. Table 2 presents the data.
Multivariable Regression Analysis to Identify Factors That Predict Interest in Attending Cooking Classes (Dependent Variable).

Note. Participants who believed that diet has the highest effect in controlling diabetes showed more interest in attending cooking classes.
Significance is defined at p less than .05.
Discussion
Diabetes prevalence in rural Eastern Kentucky is nearly 3 times that of the national average, and poverty rates are about twice the national average. The area embodies an underserved population in the United States who experience shortages in receiving medical care and social services (Friedell et al., 2001; Schoepflin & Thrailkill, 1999). Often, people living in rural locations receive less education regarding risk factors and lifestyle modifications related to metabolic disease prevention compared with urban residents (Della, 2011).
Given that lifestyle is closely related to the development of diabetes (Johnson et al., 2006), education regarding risk factors and lifestyle modification may help prevent a person from developing the disease (Irene, Smith, & Rye, 2005). Research has shown that modifications to diet and exercise can indeed prevent or delay the onset of type 2 diabetes (National Diabetes Education Program, 2008). Low education levels and illiteracy, which are prevalent in Eastern Kentucky, prevent people with diabetes or other chronic diseases from understanding educational materials about health behaviors and lifestyle modifications (Foulk, Carroli, & Wood, 2001). Thus, encouraging health behavior change through teaching cooking methods that make foods healthier may provide a better means for communication with members of populations with lower literacy levels. This type of transfer of knowledge is simple to understand and may increase people’s cooking competency and enable them to prepare healthier foods to better manage their diabetes (Traverso-Yepez, Maddalena, Bavington, & Donovan, 2012).
Participants who responded that they were watching their diets had no difference in their weight status compared with participants who were not observing their diets. Although it is possible that this may reflect that these individuals had just recently started to improve their diet, it may also indicate that even though the participants intended to eat healthy, they did not possess enough knowledge regarding how to modify their existing dietary practices to improve their health status. It is also possible that other lifestyle practices (i.e., lack of exercise) are having a larger impact on weight status.
Since cooking meals frequently at home is associated with consumption of healthier foods, strategies are needed to encourage and promote home cooking among the population (Wolfson & Bleich, 2015).
To communicate knowledge about healthy diets to patients with lower levels of education, considering how the online space has been shown to be an effective platform for promoting food networks, an alternative cost-effective approach may be using online spaces to offer cooking classes ("Nutrition," 2015; Bos & Owen, 2016).
Although the authors only collected details about daily meals from the food pantry customer participants, the data showed that unhealthy foods such as bacon, cheeseburgers, white bread, and sodas were very commonly consumed daily by those participants. Lower socioeconomic status was associated with lower self-reported perception of having proper weight as well as a greater likelihood of having a family history of diabetes.
Poverty impacts the food choices (Amarasinghe et al., 2009). In general, foods that are rich in nutrients are more expensive compared with fatty and sweet foods (Drewnowski, 2009). High intake of dietary fat, regardless of caloric intake, has been correlated with increased diabetes risk (Lagerros & Rössner, 2013). One study showed that higher rates of diabetes were self-reported by food-insecure participants compared with those who were food-secure (Franz et al., 2008; Department for Public Health, 2016). A study performed by Holben and Pheley, defined “food security” as “having access, at all times, to enough food for an active, healthy life without resorting to using emergency food supplies, begging, stealing, or scavenging for food” (Holben & Alfred, 2006). Over half of the study participants were relying on a local food bank for their nutritional needs. It is especially important to provide nutrition information to this vulnerable group of people with diabetes since they have minimal food choices as they consume food items that are already chosen for them. Teaching this group to make comparatively healthier foods at home using the ingredients they receive may improve their cooking practices to reduce sugar, salt, unhealthy fats, and calorie content and increase fiber, vitamins, and other needed nutrients in their meals by adding low-cost ingredients (Masset, Soler, Vieux, & Darmon, 2014).
Based on participants’ stated interests and indicated educational needs, free, healthy cooking classes may serve as an effective means of improving diabetes prevention and self-management efforts in this population. Table 3 presents a variety of innovative methods that can be taught at such cooking classes to encourage people to cook nutritious, diabetes-friendly meals at home. These findings and proposed strategy for diabetes education may be generalized to other underserved populations around the country.
Examples for Substitution Methods to Systemically Modify Recipes to Prepare Healthy and Diabetes-Friendly Foods.

Note. The goal of recipe modification is to eliminate/reduce saturated and/or trans fats, sugar, salt, and calorie contents of the foods. Unhealthy fats and carbohydrates may be substituted by vegetables, fruits, legumes, and nuts. These recipe modification methods may be applied to many types of recipes from around the world to prepare healthier foods.
Strengths and Limitations of the Study
The strengths of this study included the method for collecting the data through semistructured questionnaires and personal interviews which resulted in a more comprehensive understanding of the population’s needs.
The present study has several limitations. Due to limited logistics, the study sample size was small. Categorizing participants based on the location of their grocery shopping may neglect the fact that many people classified as low-income shop in regular grocery stores. However, the conclusion of this study is not affected by this factor. Furthermore, to keep the questionnaire’s length to a minimum, the authors could not collect data for the daily meals of participants at the grocery store. Also, participants self-report for having diabetes and self-reported dietary practices tend to be less reliable. Last, the sample for the present study is a sample of convenience, with individuals voluntarily seeking out the table, and subsequently the survey. Thus, it is possible that the sample is disproportionately represented by health-conscious individuals, which may create a bias in the findings.
Conclusion
Adequate nutritional knowledge and adherence to diabetes-friendly diets are lacking in rural Kentucky. However, most participants with type 2 diabetes were motivated to adopt healthy diets. Seventy-four percent of study participants indicated interest in attending cooking classes. Thus, healthy cooking classes may provide an effective means of health behavior education for people with type 2 diabetes from lower socioeconomic and educational statuses in rural Kentucky.
Footnotes
Appendix
Acknowledgements
The authors thank McCreary County Christian Care Center Food Pantry as well as Kroger Store for their permission to recruit participants for our study.
Authors’ Note
The corresponding author can provide the data files and any other underlying research materials.
Declaration of Conflicting Interests
The author(s) declared no potential conflicts of interest with respect to the research, authorship, and/or publication of this article.
Funding
The author(s) received no financial support for the research, authorship, and/or publication of this article.