
Abstract
Of late, there has been growing awareness among organizations as to the importance of green issues. This article seeks to examine how workplace design features of a green building contribute to the formation of employee organization commitment (OCM) through better job satisfaction (JST) within employees. Based on a comprehensive literature review, a theoretical model was proposed for investigation. Three putative paths linking workspace (WSP) to JST, departmental space (DSP) to JST, and JST to OCM were then tested relying on a survey data of 356 employees collected from three Leadership in Energy and Environmental Design (LEED)-certified companies, namely Indian Tobacco Company (ITC), Suzlon Energy Ltd, and Olympia Technology Park uses structural equation modeling (SEM) methodology as prescribed by Hair et al. Significant evidences were witnessed in support of all three purposed paths. The study drew data only from the green-certified organization. Future research should involve other green organization or larger sample of green building. The size and character of the sample were restricted by organizational constraints.
Keywords
Introduction
From the last few years, “Green Buildings” is constantly monopolizing the world. We can define Green Buildings as an environment-friendly and sustainable building design, which is constructed to reduce the entire environmental impact. Put differently, Green Building or sustainable design is the practice of mounting the effectiveness with which building and their area use energy, water, and materials, and reducing the impacts of the building on human body and health and the environment over the life cycle of the building (Zeigler, 2012).
Employee health and well-being have a strong relation to employee satisfaction. Workplace design of any organization can negatively affect the physical health of the occupants (e.g., asthma and other respiratory problems) due to the absence of fresh air and improper ventilation. Workplace design can also affect the psychological health of the occupants (e.g., depression and stress) through insufficient lighting, noise, and inadequate space. Studies have revealed that such unfavorable health conditions cause absenteeism, work loses, less productivity, and dissatisfaction than employees without these conditions. The literature on the health effects of green buildings claims that workplace design has a positive effect on health and well-being; it improves thermal comfort, air quality, noise, lighting conditions, and health, which help in the reduction of absenteeism and further increased satisfaction (Baird, 2010; Choi, Loftness, & Aziz, 2012; Frontczak et al., 2012; Romm & Browning, 1994; Singh, Syal, Grady, & Korkmaz, 2010; Thayer et al., 2010).
It is therefore strategically important for businesses to know whether green buildings may lead to high-level organizational outcomes, such as, satisfaction, environmental awareness, organizational commitment, and so on. If so, then what are the linkages? The present study attempts to investigate the linkage between buildings’ workplace design features, occupants’ job satisfaction (JST), and organization commitment (OCM). We consider workplace design features with special reference to green buildings, defined as the design that reduces the negative effects of construction development on the environment and human well-being and promotes sustainable life (Addae-Dapaah, Hiang, & Sharon, 2009).
In Indian context, before giving green building certification to any organization, the building is rated against the established rating systems. There are two primary established rating systems.
Green Rating for Integrated Habitat Assessment (GRIHA)
Indian Green Building Council (IGBC)
GRIHA
The GRIHA was developed by the Ministry of New and Renewable Energy and TERI (The Energy and Resources Institute). GRIHA comes under the Government of India and is responsible for evaluation of green building design in which a three-tier process is applied for rating the buildings. The process starts with online submission and is followed by evaluation by the GRIHA Secretariat. There are a number of buildings which are green certified by the GRIHA; Fortis Hospital, CESE (Centre for Environmental Sciences & Engineering) building, and IIT Kanpur are good examples of buildings that received green building certification.
IGBC
Any building that receives Leadership in Energy and Environmental Design (LEED) certification from the U.S. Green Building Council (USGBC) falls under the list of “green building.” LEED is the benchmark for certifying green buildings. This system was developed in 2000 by the United States and is currently used for green building design, construction, and operation. This organization (USGBC) promotes sustainability through green building design and features. In India, the Confederation of Indian Industry (CII) inaugurated the IGBC in 2001. IGBC is located in CII-Sohrabji Godrej Green Business Centre, which itself is a LEED-certified Green building. The IGBC acquired the LEED Green Building Standard from the USGBC.
Literature Review
Making the Link Between Workplace Design and JST
Some studies suggest that the market price of a green building is 10% more per square feet than any other conventional building (Miller, Spivey, & Florance, 2007). Other studies that focus on energy efficiency and operational and maintenance cost report that green building energy consumption is 26% less, maintenance cost is 13% less, and green house gas (GHG) emission is 33% less than any other commercial buildings (General Services AdministrationPublic Buildings Service, 2008). Few studies are focused on the benefits of green building to individual performance, individual health, and satisfaction (Browning & Romm, 1995; Kamaruzzaman, Egbu, Zawawic, Ali, & Che-Ani, 2011; Rashid, Spreckelmeyer, & Angrisano, 2012; Rashid & Zimring, 2008; Zhang & Altan, 2011).
A relevant study observed how occupiers, whether it is management or employees, recognize and appraise the function of green workplace, and consequently evaluate the efficacy of a green workplace. The study suggests that green workplace offers better psychological profit, better health, and better JST (Singh et al., 2010). Such initiatives might see an emergence of new power resources to fulfill the needs of society, developing new innovative ideas and strategies that will help in environmental sustainability.
A well-structured workplace design may be the most noticeable and positive feature of an organization; a good and well-structured workplace may also drive a message of brand excellence, strength, authority, energy, and pleasure to all including employees. A number of studies show that employees who are satisfied with their workplace and departmental design gave better results, outcomes, and productivity (Ferguson & Weisman, 1986; Leather, Beale, & Sullivan, 2003; S. Y. Lee & Brand, 2005; Sundstrom, Burt, & Kamp, 1980; Zalesny, Farace, & Kurchner-Hawkins, 1985).
Leder, Newsham, Veitch, Mancini, and Charles (2016) concluded that the size of the workplace is a significant predictor of occupant satisfaction; larger the workplace, greater the level of satisfaction. This makes sense as larger workstations place occupants further apart, which reduces the number of people available to overhear conversations and create sources of unwanted sound, facilitates sound attenuation, and likely also supports visual privacy, and this improved occupants’ satisfaction (Frontczak et al., 2012; Kim & de Dear, 2013; Schiavon & Altomonte, 2014). Other researchers such as Green Building Council Australia (GBCA; 2013);Gou, Prasad, and Lau (2013); and Newsham et al. (2013) concluded that the employees of green buildings were more satisfied with their workplace design. The occupants expressed their satisfaction with the thermal environment and comfort (Brager & Baker, 2009). Workplace design creates a high level of satisfaction, positive attitude, and desire in the occupants toward the environment (Monfared & Sharples, 2011; Deuble & de Dear, 2012).Carlopio (1996) reported that employee workplace design satisfaction is directly related to employee JST and indirectly related to OCM. Therefore, there is a requirement to recognize the connection of workplace design features with employee JST and OCM.
Making the Link Between JST and OCM
Locke (1969, pp. 309-336) said that “JST is the pleasurable emotional state resulting from the appraisal of one’s job as achieving or facilitating one’s job value (Schewpker, 2001).” According to Glisson and Durick (1988), it is general attitude or the feelings of the employee that relate to their jobs and the job components such as the working environment, working conditions, equitable rewards, and communication with colleagues (Kim, Leong, & Lee, 2005; Jain, Jabeen, Mishra, & Gupta, 2007; Newstrom, 2007; Robbins & Judge, 2007).
Ting (1997) found that HR practices are significantly associated with JST; various other researchers have studied and also found that sound HR practices results in better levels of JST within the employees and further improves the feeling of commitment toward the organization (Anand, 2016; Jiang, Lepak, Hu, & Baer, 2012; Khanna & Sehgal, 2016; Mudor & Tooksoon, 2011; Onyema, 2014; Van De Voorde, Paauwe, & Van Veldhoven, 2012). In another study on employees of Dutch public sector, it was found that age, gender, and education had an insignificant impact on JST whereas HRM practices of Dutch public sector had significant impact on JST (Mosadeghrad, Ferlie, & Rosenberg, 2008; Steijn, 2004). Similar studies done in the United Kingdom on employees of government organizations observed that the use of specific HR practices had a positive association with JST, OCM, and organization performance (Agarwala, 2008; Edgar & Geare, 2005; Lamba & Choudhary, 2013; Petrescu & Simmons, 2008; J. Williams, 2003; Yu & Egri, 2005). Kotzé and Roodt (2005) and Riggio (2012)found in their study that there is a strong positive relation among JST and employees commitment toward their organization (Getahun & Sims Hummer, 2008; Lambert, 2008; Malhorta & Mukerjee, 2004; Saari & Judge, 2004).
One of the significant components of employee’s commitment to their employing organization is JST (Goyal & Shrivastsva, 2012; Markovits, Davis, & Van Dick, 2007). JST was defined as an affective attachment of an individual employee with either the entire job or any particular aspect of their job (Chang & Chang, 2008; Tett & Meyer, 1993). Employee would be highly committed to their employing organization and strengthen the relationship between JST and commitment, when employee are satisfied with their job (Aydogdu & Asikgil, 2011; K. Lee, Carswell, & Allen, 2000; Mueller, Boyer, Price, & Iverson, 1994). However, JST is more concerned about the individual employee’s attitude or response to his or her job and to the different aspects of the job such as working conditions and salary (Sarwar & Abugre, 2013). On the contrary, commitment is the general attitudes and behavior of the individual employee toward the organization and its goals and values (Porter, Steers, Mowday, & Boulian, 1974; Solinger, van Olffen, & Roe, 2008). Therefore, JST is related to the employee’s thought of leaving the organization (Holtom, Mitchell, Lee, & Eberly, 2008; Mowday, Koberg, & McArthur, 1984; Muralidharan, Krishnaveni, & Venkatram, 2013; Sowmya, 2013). Much research has been conducted on the influence of employee JST on OCM(Watson Wyatt/WGBH, 1999).Porter et al.’s (1974) satisfaction to commitment mediation model claims that commitment to the employing organization develops from JST, and JST encourages employees to become committed to their employing organization and that commitment is more stable than satisfaction (e.g., Marsh & Mannari, 1977; Mowday, Porter, & Steers, 1982; Price & Mueller, 1986; L. J. Williams & Hazer,1986).Price and Mueller proposed that as JST increased, employees showed a greater commitment to stay with the organization. Committed employees are a more significant personal contribution to the organization and perform better for the organization (Perryer, Jordan, Firns, & Travaglione, 2010).
Bateman and Strasser (1984) found in their study that organizational commitment is an antecedent of JST (Clugston, 2000; Gunlu, Aksarayli, & Percin, 2010; Lok & Crawford, 2001). The result by Bateman and Strasser (1984) has been consequently replicated and challenged by others in the field, and has received little support (Curry, Wakefield, Price, & Mueller, 1986). Various studies have accepted that JST has a formative effect on organizational commitment (Clugston, 2000; Jernigan, Beggs, & Kohut, 2002; Lok & Crawford, 2001; Mahanta, 2012; Srivastava, 2013). Thus, there seems a logical putative connection between JST generated out of workplace design features of a green building and the consequent OCM.
There is lack of research evidence in the literature that links workplace design features with the JST and commitment directly. This study tries to link and present a more widespread effect of workplace design than that found in previous studies. It tries to add to literature that helps future researchers who wish to work in this field. This research also attempts to raise awareness among management and employees that to work in a safe and comfortable environment is the right of every employee because satisfied employees tend to deliver better service to the customer, which eventually influences customer satisfaction and overall organizational profit. Therefore, providing green workplace could increase customer satisfaction and organizational profit.
Conceptual Research Model and Hypotheses
Based on the literature review, the measurement model and hypothesis are formulated for the exogenous (independent) variables and the endogenous (dependent) variables as shown in Figure 1 to explain the interrelationship between the affecting factor and their impact on the JST and organizational commitment. The research model used in this study consists of two exogenous latent constructs, namely, “workspace” (WSP) and “departmental space” (DSP), and two endogenous latent constructs, namely “JST” and “OCM.”

Purposed model and hypothesis.
Based on the conceptual background, the following model and hypotheses are purposed; these hypotheses are investigated through empirical analysis:
These hypotheses are tested empirically based on data collected from the three renowned companies—ITC, Suzlon Energy Ltd, and Olympia Technology Park—that are certified green building by the LEED rating system.
Method
Data Collection
In this research, a quantitative approach was taken to the objectives outlined. The present study continues in that tradition, and uses self-administered questionnaires with closed-ended items for the purpose of gathering data. Survey questions were addressed to the occupants of the selected LEED-certified buildings, namely, ITC, Suzlon Energy Ltd, and Olympia Technology Park. All survey participants were 21 years old or older, and were either a full-time and part-time employee. The questionnaires were distributed to respondents via the internal mail systems of each of the organizations participating in this study.
The participation in the study was voluntary and no remuneration was given for the same. The questionnaire was filled by the employees during their working hours. The selections of items were finalized after ensuring the reliability and validity of the survey instrument through a pilot study. In the final phase, structural equation modeling (SEM) analysis was conducted on AMOS 18.0 to verify the purposed hypothetical model and model fit.
Sampling
The 700 participants were randomly chosen and distributed questionnaires through internal mail systems of each of the participating organizations. Of the 700 questionnaires, 421 responses were obtained, of which 65 questionnaires were omitted due to incomplete details. A total of 356 questionnaires were used for analysis. The response rate is noticeably high and representative of the population studied. As per the Roscoe (1975) questionnaire distribution method, the response rate should always be more than 10% to keep away from the sample bias. Questionnaire data were automatically generated in an excel sheet which was then imported into SPSS (SPSS Inc.) database. Standard data scrutiny and authentication were performed (e.g., range, distribution, missing value prototype) before running SEM model.
The Instrument
The questionnaire is divided into five sections to specifically address the three hypotheses formulated in the study. The first section consists of five questions related to individual details/demographic details such as company name, work experience, age, gender, and education. The remaining sections comprise five items on “WSP” (Section 2), five items on the “DSP” (Section 3), five items on “JST” (Section 4), and five items on “OCM” (Section 5). All items from Section 2 to Section 5 were measured by using 5-point Likert-type scale, ranging from strongly disagree (1) to strongly agree (5).The items for the study concepts were drawn after extensive literature review on the subject matter. To ensure the content validity of items, expert opinion was sought. Two experts from the industry and two from academia were nominated and requested for expert opinion on the content of these items. After necessary modifications as suggested by the experts, items were finally included to represent respective study concepts. To check reliability of study concepts, Cronbach’s alpha was measured whose value for respective scales was found to be above the suggested threshold levels. As to the validity, measurement model using AMOS was run and the results supported discriminant as well as convergent validity for all study scales.
Data Analysis and Results
Sample Characteristics
Table 1shows the respondents’ demographic profile. Of the 356 respondents, 67% of respondents were male and 31% were female. Majority of the respondents were in full-time employment, and 53% were in the age group of 30 to 40 and 47% were in the age group of 40 to 50. The majority of respondents were aware about workplace design features of the green building.
Demographic Profile of the Sample.

SEM
SEM is a multivariate technique that examines simultaneously the series of dependence relationship of the hypothesized model. Basically, SEM combines multiple regression with confirmatory factor analysis (CFA) and has two mechanisms: the measurement model and structural model. According to Doloi, Iyer, and Sawhney (2011), the measurement model is basically meant for the reliability and validity of the latent variables and observed variables; it checks the relationship between latent variables and observed variables. The structural model is concerned with the path strength and relationship among the latent variable.
The measurement model
To test the measurement model, a CFA was conducted using AMOS 18.0. Before testing the interrelationship in the structural model, it is necessary to check the reliability and validity of the measurement model (Fornell & Larcker, 1981; Ifinedo, 2006).
Figure 2 shows a final measurement model that consists of four constructs, namely, “WSP,” “DSP,” “JST” and “OCM.” The four constructs are indicated by five items each, and thus the four construct are measured by 20 measured indicator variables (WS1-OC1).
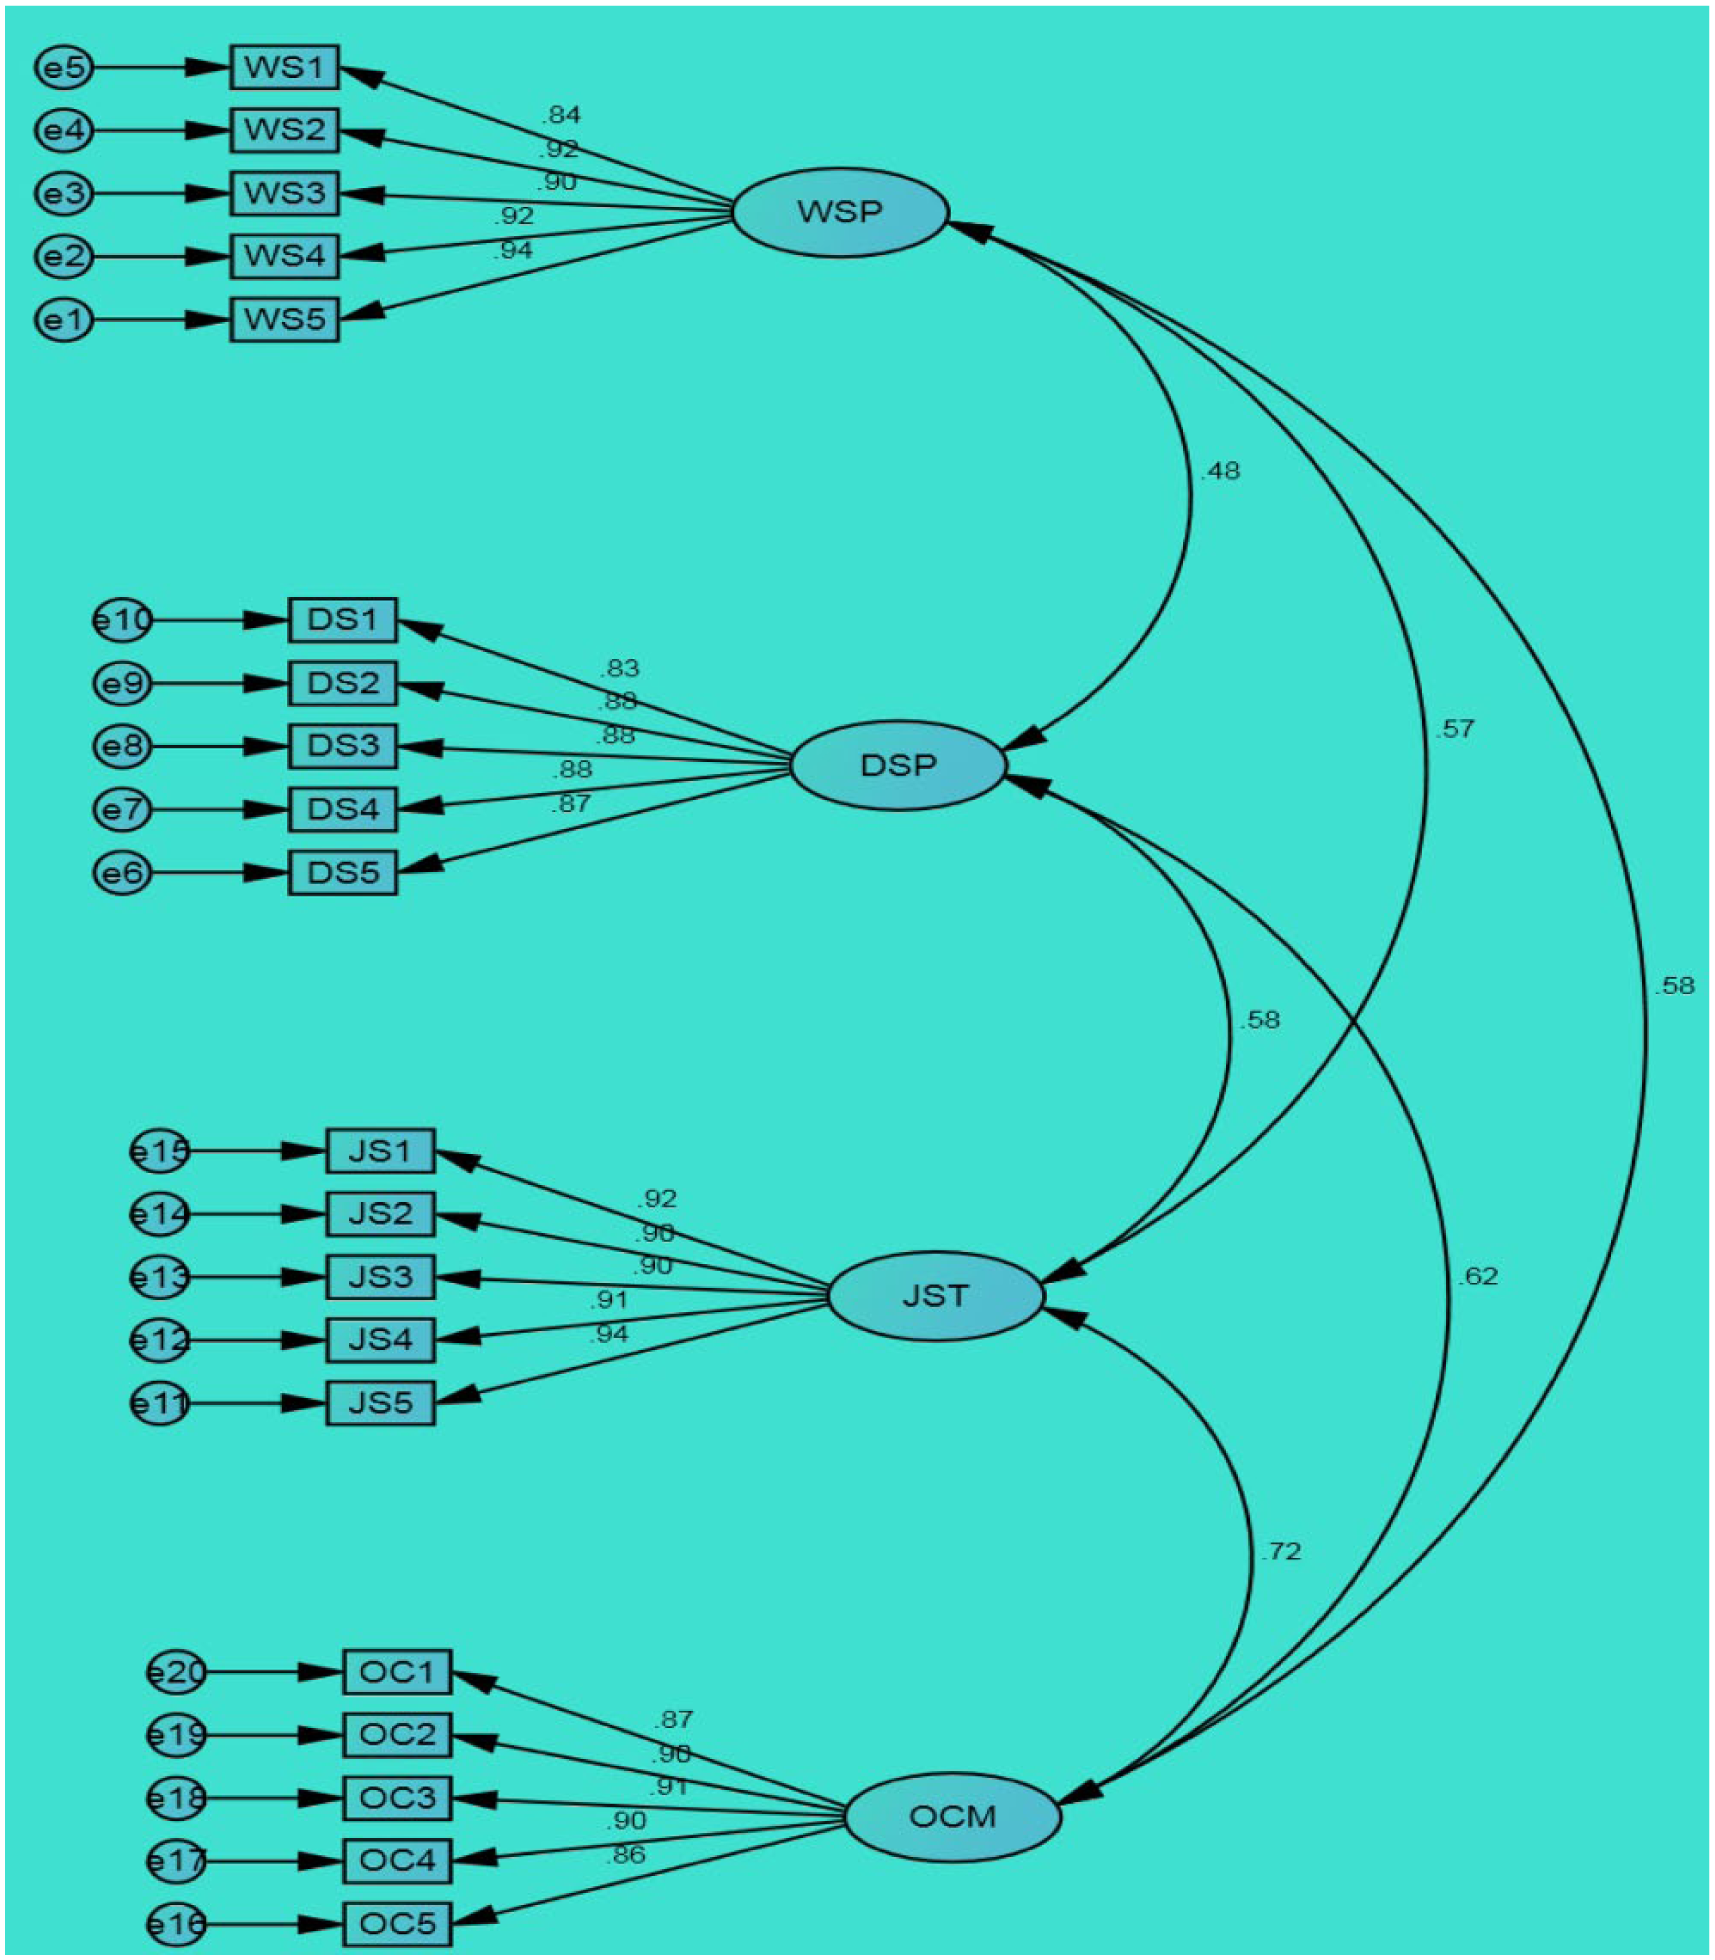
Measurement model.
The parameters of the measurement model in terms of reliability, convergent validity, and discriminant validity were evaluated. For reliability determination, internal consistency is calculated, which conclude the reliability each survey item purposed to measure the same characteristic. Cronbach’s α is used to measure the internal reliability of each construct (WSP, DSP, JST, and OCM) through the pairwise correlation between items; it ranges from 0 to 1. A Cronbach’s α value between .6 to .7 is considered reliable, and those above .7 indicate a good degree of reliability (Sekaran, 2003). As per the results, the degree of reliability of each construct is above .7 and near to .9. It shows that the internal consistency of each construct is very good. Cronbach’s α for “WSP” is .957, “DSP” is .937, “JST” is .963, and “OCM” is .951. Thus, these measures are appropriate and can be used for SEM analysis. And square roots of the AVEs marked in italics in Table 2 show that in the measurement model, discriminant validity appears satisfactory at the construct level in the case of all constructs.
Correlation Matrix and Root of AVE’s.
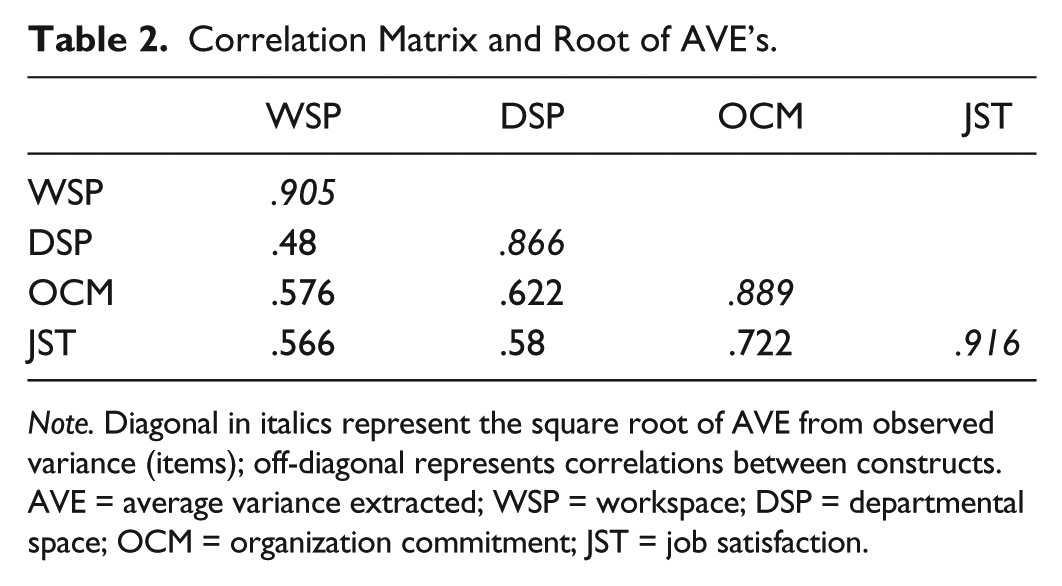
Note. Diagonal in italics represent the square root of AVE from observed variance (items); off-diagonal represents correlations between constructs. AVE = average variance extracted; WSP = workspace; DSP = departmental space; OCM = organization commitment; JST = job satisfaction.
Table 3 shows the summary of goodness of fit indices for measurement model. The respective χ2/df, comparative fit index (CFI), goodness of fit index (GFI), normed fit index (NFI), Tucker–Lewis index (TLI), and root mean square error of approximation (RMSEA) values are 1.642, 0.917, 0.810, 0.907, 0.904, and 0.007, respectively. Table 3 clearly demonstrates that the measurement model postulate a good fit so we can proceed to testing the structural model by using SEM.
Summary of Goodness-of-Fit Indices for Measurement Model.

Note. CFI = comparative fit index, GFI = goodness of fit index; NFI = normed fit index; TLI = Tucker–Lewis index; RMSEA = root mean square error of approximation.
Structural model
To examine the hypothesized conceptual research model, SEM was performed to test the structural model. Table 4 depicts the goodness-of-fit for the model was marginally adequate: χ2/df, CFI, GFI, NFI, TLI, and RMSEA values are 1.518, 0.911, 0.798, 0.901, 0.898, and 0.069, respectively. Therefore, we can say that the structural model is accepted as per fit indices and we can further proceed to investigate the hypotheses which are defined in our model.
Summary of Goodness-of-Fit Indices for Structural Model.

Note. CFI = comparative fit index, GFI = goodness of fit index; NFI = normed fit index; TLI = Tucker–Lewis index; RMSEA = root mean square error of approximation.
Properties of the structural model (standardized path coefficients [β], standard error, critical ratio, and hypotheses result) are indicated in Table 5. The level of significance (α) is set at .05. This study also reported the squared multiple correlation, R2. The R2 value is used to evaluate the strength of the proposed model.
Summary of Testing of Hypothesis.
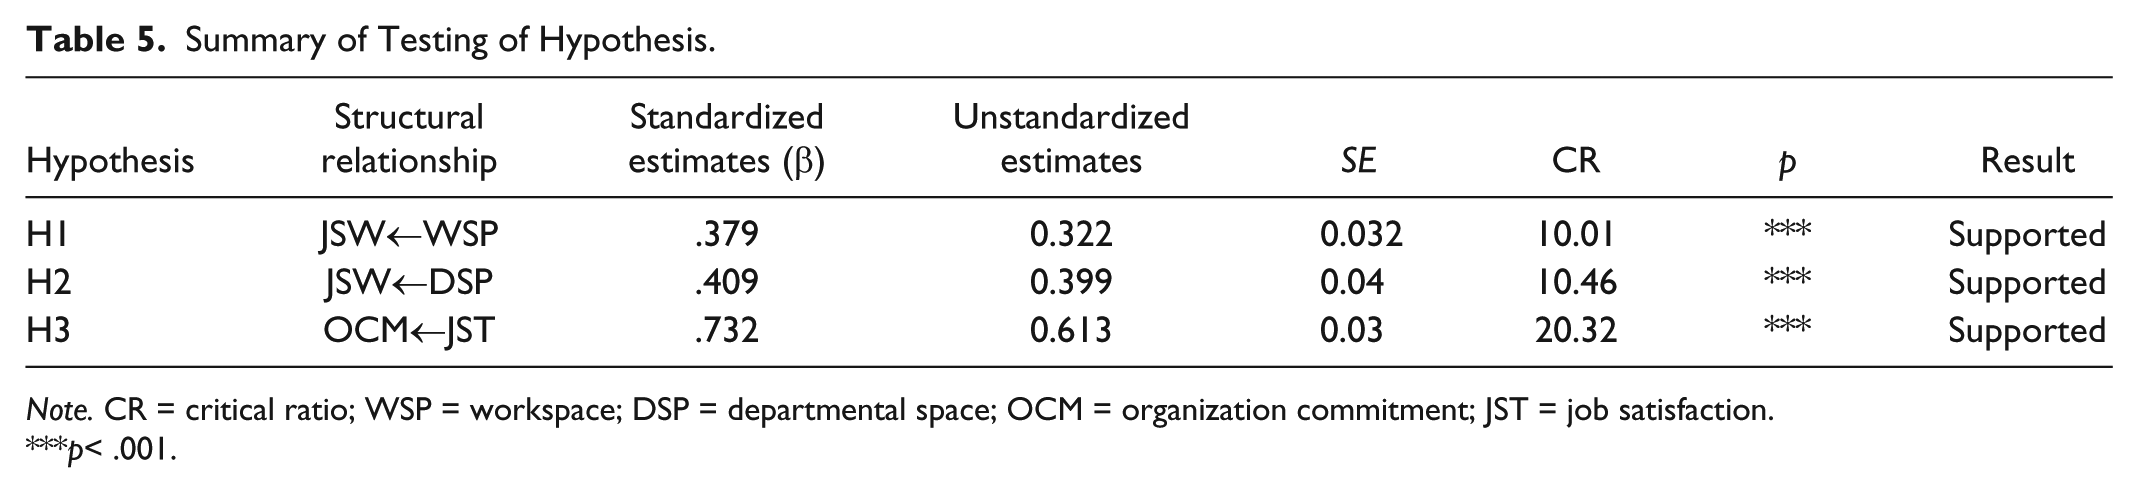
Note. CR = critical ratio; WSP = workspace; DSP = departmental space; OCM = organization commitment; JST = job satisfaction.
p< .001.
The R2 was the results of the multivariate test of the structural model shown. It is estimated that the predictors of JST explain 45.9% of its variance. In other words, the error variance of JST is approximately 54.1% of the variance of JST itself.
It is estimated that the predictors of OCM explain 53.5% of its variance. In other words, the error variance of OCM is approximately 46.5% of the variance of OCM itself. Figure 3 depicts the structural model.
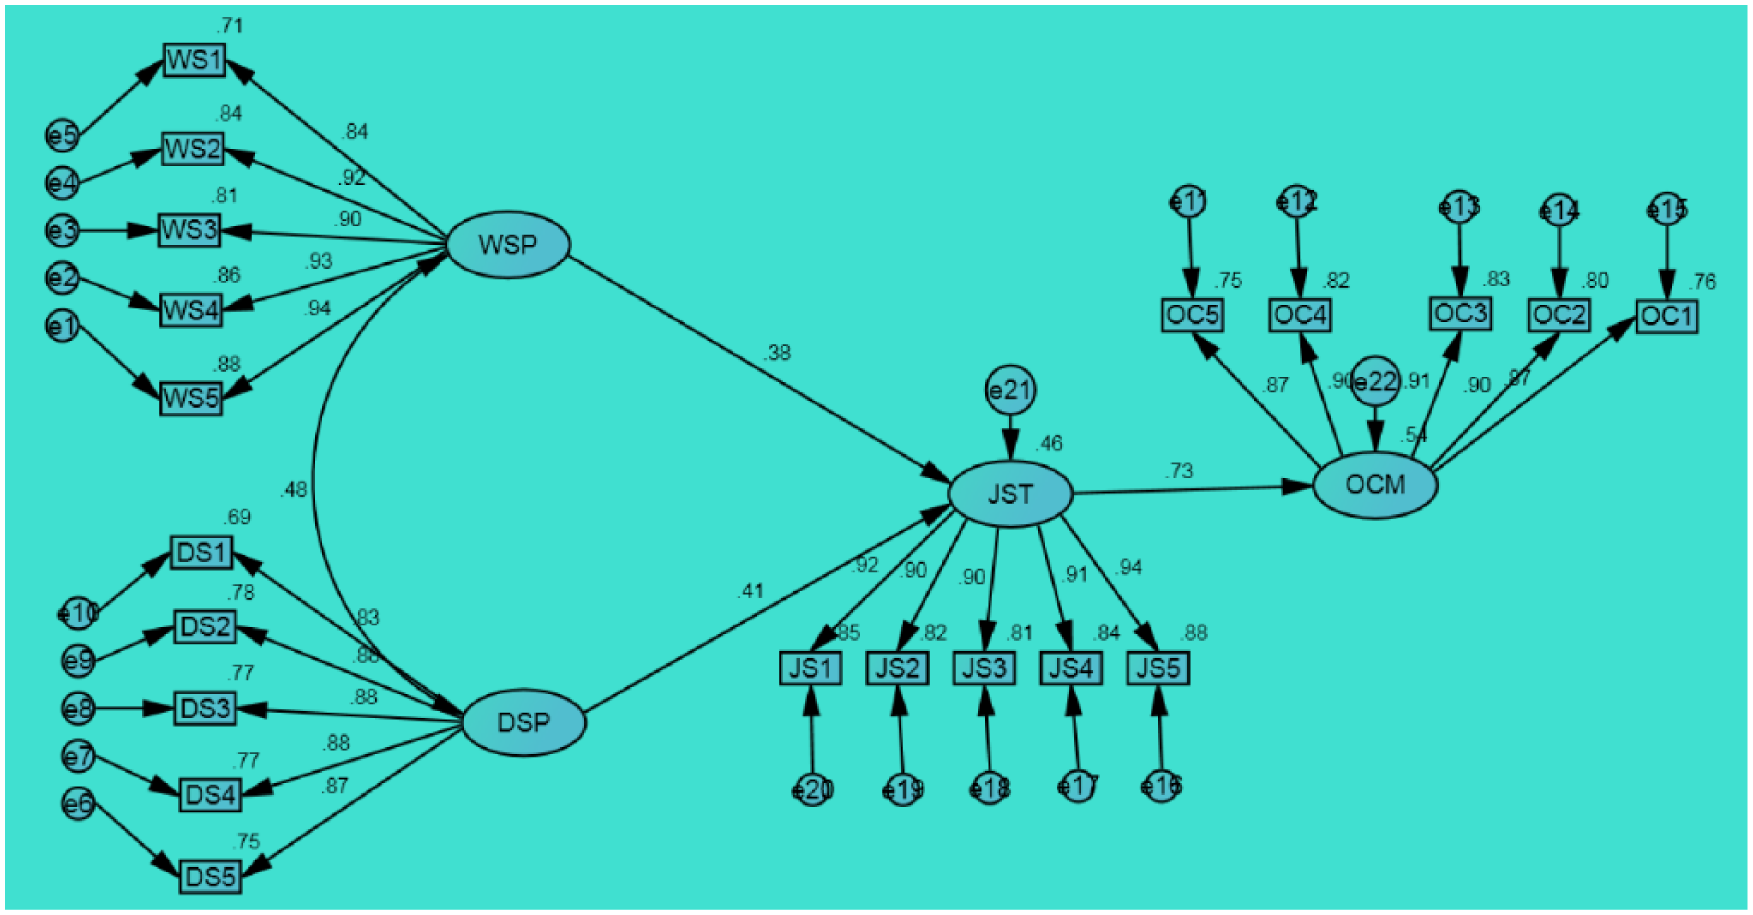
Structural model.
Table 5 shows the results of hypothesis testing, where each of the β coefficients explains the relative importance of the affecting factor. All expected relationships are positive in nature. The entire two factors which may affect the JST and OCM factors are significant with a different value of the standard regression weights (β coefficients), thus contributing different weights to the variance of JST and OCM.
The path theory assumed three structural paths: first from WSP → JST, second DSP → JST, and third JST → OCM. The significant finding is found in relation to the WSP → JST (β = .379; p< .05), which has a great effect on the JST. Hence (H1), which states WSP is positively affecting the JST, is supported. Next, there is a support for (H2), indicating that “DSP” is positively affecting the JST, so the relationship DSP → JST (β = .409, p < .05) is also supported. The results of this research support the relationship JST → OCM (β = .732, p< .05) and suggested hypothesis (H3) which states JST is positively affecting the employee OCM. The estimates are reliable with expectations, because the relationship is significant (p< .05) and in the anticipated direction.
As can be seen, the standard regression weight did not change from the CFA model, hence the interpretation confounding is ruled out, it means construct are stables which further validates the measurement theory.
Discussion
The study showed that the occupants of LEED-certified building assessed the individual WSP and DSP features of the building positively. Most of the occupants showed their agreement that the workplace design features had positive effects on the JST and OCM, and their judgment of JST and OCM remained similar across type of job, gender, and age. These results are remarkable in light of the fact that organizations believe that their buildings require to be environment-friendly to improve occupant satisfaction. This is in spite of the fact that the correlation between JST and OCM is significantly strong (β = .732, p < .05). As the initial attempt to illustrate the mechanisms of the occupants’ assessments of JST and OCM, structural models were developed with JST and OCM as the dependent variables and WSP and DSP features as the predictor variables.
These results signify that the variables “WSP” and “DSP” are statistically significant with “JST” and “OCM.” All constructs satisfied unidimensionality, reliability, discriminant validity, and convergent validity. They are, therefore, statistically valid. It is essential to emphasize that during the data analysis and cleansing of the model, other items related to the construct were dripped based on the fit limits suggested by the literature.
As a consequence, H1 tends to be considered valid for the sample under analysis. H1 states that WSP is positively affecting the JST. Hence H1 is significantly related to JST. The WSP shows that “amount of area in personal WSP fits needs” (WS1) may significantly represent the WSP (β = .840), conversations with coworkers cannot be overheard (WS2) may significantly represent the WSP (β = .919), can enjoy the outside view (WS3) may represent the WSP (β = .899), WSP helps accomplishing tasks (WS4) may represent the WSP (β = .925), have enough natural light in WSP (WS5) may represent the WSP (β = .940). The relation between WSP and JST shows that WSP is a clear preventive approach. This orientation requires researcher, practitioner, and leading organizations to procure the right of the employee to work in a green environment and make employees able to work in an environment-friendly workplace (Govindarajulu & Daily, 2004).
The study gives suggestion to the designers, practitioners, and leading organizations to focus more on the workplace designs, which connect the humans to nature (biophilic design). Design the workplace such that windows give natural daylight, adequate space, proper ventilation system with a rate of fresh air intake, CO2 monitoring system, and maximum percentage of the workplace area should have exterior views so that the occupants have significantly higher JST and higher propensity to stay in the organization. Certainly, there is a rising of literature supporting the integration of workplace design and nature. Workplace design has positive well-being benefits and higher satisfaction, but in some cases (such as not having enough access to a window and not being allowed to decorate or personalize work areas), it varied in little margin (Altomonte & Schiavon, 2013; McCunn & Gifford, 2012; Menadue, Soebarto, & Williamson, 2013; Newsham et al., 2013; Schiavon & Altomonte, 2014; Thatcher & Milner, 2012). Thus, in this study, the relation between workplace presented a more widespread effect than that found in previous studies (e.g., González-Benito & González-Benito, 2006; Iraldo, Testa, & Frey, 2009; Sroufe, 2003; Vachon & Klassen, 2008; Wagner, 2007; Yang, Lin, Chan, & Sheu, 2010).
2. The DSP factor in this study is defined by formal/informal conversation, layout of departmental WSP, support equipment, and equipment accessibility items which may affect the JST. The empirical outcome supports H2, which assumes that “DSP” is positively affecting the JST. The relationship DSP → JST (β= .409, p< .05) is also supported as “DSP”–related items were the second most significant factor which may affect the JST. So it is recommended that organizations clearly define the department space in advance. The DSP related item shows that, can socialize in corridors/circulation areas (DS1) may significantly represent the DSP (β = .832), can socialize in lounge/break room (DS2) may significantly represent the DSP (β = .880), building provides opportunities for informal conversation (DS3) may significantly represent the DSP (β = .876), support equipment is convenient to WSP (DS4) may significantly represent the DSP (β = .878), layout of departmental WSP supports teamwork (DS5) may significantly represent the DSP (β = .868).
Even though a large number of departmental features showed significant correlations with JST, when they were used in the structural model as the predictor variables, all showed significant standard loadings with JST. So the first two hypotheses (H1 and H2) make clear that the words WSP and DSP together make workplace.
3. The “JST” factor in this study is defined by safe, healthy work environment, care and environmental consciousness items which may affect the employee organizational commitment. The empirical result supports H3, which assumes that “JST” is positively affecting the organizational commitment. The results of this research support the relationship JST → OCM (β = .732, p< .05) and suggested hypothesis (H3) that there is a positive effect of JST on the employee’s OCM. The estimates are reliable with expectation, because the relationship is significant (p< .05) and in the anticipated direction.
These findings thus suggest that there may be a relationship between the individual WSP and DSP features and the JST and OCM. In other words, individual WSP and DSP features may affect the employee JST and OCM. So, it is clearly identified that workplace design features play an important role in employee satisfaction and commitment. Workplace design enhanced their satisfaction, safety, comfort, and commitment (Brown & Cole, 2009). This research suggests when developers or investors pursue green design and construction followed by rules and regulation of green building, they must keep in mind that to work in a safe and comfortable environment is the right of every employee because only workplace design cannot perform better if the employees are dissatisfied (Gou, Lau, & Chen, 2012).
Conclusion and Recommendation
Based on the statistical analysis and rigorous evaluation of the data collected from occupants of green building using a questionnaire instrument, the study found strong evidence to the relationship between the “WSP,” “DSP,” “JST,” and “OCM.” Individual WSP features and DSP features showed significant correlation with that of employee JST and OCM. The findings of this study suggested that the occupants certainly acknowledge the workplace design features of the green building. These features played a major role in determining how satisfied the occupants were with individual WSP and DSP.
In the context of heightened demands for workplace design features or green building, this study may thus offer a direction for management that the term green buildings need not only to do the effective utilization of resources, but they may also bear the well-being of their occupants and maintain the employee right to work in healthier environment because they play the active role in encouraging the green building. To work in the green environment is a basic right of every employee not only for their comfort but also for their satisfaction, productivity, growth, safety, and health. Poor workplace design is a major reason for low productivity, low satisfaction, low commitment level, and also various symptoms like headaches, fatigue, trouble concentrating, and irritation of the eyes, nose, throat, and lungs. So these problems can be rectified by green workplace design and law requires employers to offer a harmless and healthy place of work for their employees. This can be achieved through mutual effort of management and employee together to improve safety, health, productivity, and satisfaction in the workplace through green committees, where committee representatives bargain with management on green environmental issues in the workplace and secure the workplace right of the worker.
Finally, despite the support for the hypotheses in this study, there are a few limitations to this research: This study surveyed only the occupants of green buildings in India; therefore, the authors recommend for the further extension of this study with non–green buildings across the industry sectors and regions to validate the finding for other green buildings as well and vice versa for non–green building.
Footnotes
Declaration of Conflicting Interests
The author(s) declared no potential conflicts of interest with respect to the research, authorship, and/or publication of this article.
Funding
The author(s) received no financial support for the research, authorship, and/or publication of this article.