
Abstract
Corporate sustainability is essential to long-term corporate success and for ensuring markets deliver value across society, and despite its importance, there is no clear consensus as to whether the financial performance of companies relates to their sustainability performance. The objectives of this study are to verify whether the sustainability reporting quality would affect corporate financial performance (CFP) among the firms listed on Corporate Sustainability Index (ISE) and to examine the quality of information disclosed in their sustainability reports (SR). The sample is composed of all firms listed on ISE for the period 2008 to 2014. This study considered accounting and market-based indicators and control variables. There is no clear consensus as to whether the financial performance of companies listed in sustainability indices relates to their sustainability performance. The main findings are as follows: There is no association between accounting and market-based variables and the reporting quality, and although the quality disclosure is improving throughout the years studied, the scores are still low. This is also true in the three dimensions of sustainability. We are not aware of studies examining the relationship between CFP and sustainability reporting quality, and this is the main contribution.
Introduction
Corporate sustainability is essential to long-term corporate success and for ensuring markets deliver value across society (United Nations Global Compact, 2014). Aware of that, investors have adopted sustainability as a criterion to be considered in the configuration of their investment portfolios, which has led to the emergence of sustainability indices linked to the financial market (López, Garcia, & Rodriguez, 2007). Among these are the Dow Jones Sustainability Index in the United States, FTSE4Good in the United Kingdom, Corporate Sustainability Index (ISE) in Brazil, and the STOXX Global ESG Leaders Index in Germany. The idea underlying these indices is that sustainability practices constitute a potential element for long-term value creation from which shareholders will benefit. To belong to sustainability indices, firms are required to develop and disclose information that reflects the criteria adopted in matters of sustainability, and this information usually appears in their SR. The element that differentiates between the firms that belong to sustainability indices and those that do not are the requirements for information disclosure on sustainability (López et al., 2007).
There are various benefits arising out of a firm’s engagement in sustainability. Some of them are employee involvement within the firm and the motivation improvement (Becchetti, Di Giacomo, & Pinnacchio, 2008), reputation and image benefits (Orlitzky & Swanson, 2012), and enhancement of firm’s competitiveness (Frooman, 1999) and cost reduction/competitive advantage/reputation and legitimacy (Kurucz, Colbert, & Wheeler, 2008).
Regardless of the importance of sustainability to creating long-term value and corporate success, there is no clear consensus as to whether the financial performance of companies listed in sustainability stock indices relates to their sustainability performance. Kapoor and Sandhu (2010) found a significant impact on profitability, in the same line of Pan, Sha, Zhang, and Ke (2014). Neither did López et al. (2007) find positive repercussions on financial performance, nor do all dimensions of sustainability have positive effects on short- and long-term profitability (Inoue & Lee, 2011). The negative link between sustainability performance and corporate financial performance (CFP) was reported by Jennifer Ho and Taylor (2007). As noted above, the results from such studies remain mixed, and the debate over whether there is a link is far from settled.
This study adds to this conversation by examining this link in another angle, of the sustainability reporting quality. This becomes the objective of this study, whether the sustainability reporting quality would affect CFP among the firms listed on ISE. Another objective is to examine the quality of information disclosed in the SR of these firms. This latter topic has been discussed in the literature. Ching, Gerab, and Toste (2013) concluded that a good sustainability report is directly related to the good content in all the three dimensions and that these reports still have a big room for improvement, which echoes with Quick (2008), Hubbard (2011), and Dias (2009). Regarding the adherence to Global Reporting Initiatives (GRIs) indicators, even the companies classified as Application Level A leave a wide range of discrepancy between the indicators reported (Aktas, Kayalidere, & Kargin, 2013; Sherman & Diguilio, 2010; Tiong & Ananthamaran, 2011).
This study was motivated by two reasons: the lack of consistent evidence due to mixed results in previous literature and the scarcity of research in the Brazilian context. Borba (2005) studied this relation between financial and sustainability performance over the 2-year period (2000-2002) for Brazilian listed companies that had published a social balance sheet as per the Brazilian Institute of Social and Economic Analysis (IBASE) model, whereas Cezar and da Silva Junior (2008) used the same IBASE model for a longer period (1999-2006). However, both of them used only environment and social variables. Sustainability involves not only social and environmental but also economic matters. Finally, regarding the use of ISE companies, Costa (2007) analyzed the index in 2005 and da Silva Macedo, Corrar, and de Siqueira (2012) analyzed the index over a 4-year period (2005-2008), but only for power distribution companies.
This research adds to the empirical literature on the relation between sustainability and CFP by providing a comprehensive evidence of Brazilian listed companies, using the panel data of 218 SR from 2008 to 2014. Some studies examine the relation between CFP and sustainability report reviews, others examine the relation with sustainable practices, with multidimensions of sustainability, with the disclosure extension of Triple Bottom Line (TBL) reporting or with reports according to G3 GRI guidelines. We are not aware of studies examining the relationship between CFP and sustainability reporting quality. This is the main contribution of this article. These studies will be discussed in the literature review.
The remainder of this article is organized as follows. In the next section, we give an overview of studies that analyzed the two subjects that serve as a foundation to our research: (a) the relation between CFP and sustainability and (b) the theories that support this relation. In the “Research Method” section, the method of analysis is described. In the “Results and Discussion” sections, interpretations of the results are presented, adding to the discussion on the subject. Finally, we present conclusions, limitation, and suggestion for further studies.
Literature Review
The Relation Between CFP and Sustainability
The studies below analyze this relationship in different ways. Some analyze companies’ reports and compare them with the financial indicator; others analyze the performance of stock indices that list sustainable companies. There are different results on each study and they are sorted into three types of impact: positive, neutral, and negative.
Regarding the positive link between sustainability performance and CFP, Kapoor and Sandhu (2010) analyzed the impact of sustainability in CFP of Indian companies by conducting a content analysis of their annual reports and websites. The authors found significant impact of sustainability on return on sales (ROS), return on asset (ROA), and return on equity (ROE), but insignificant impact on growth.
In a similar approach, Akisik and Gal (2014) examined the relation between financial performance and reviews of SR. Multivariate analysis led to the following findings: (a) Sustainability report reviews significantly affect certain short- and long-term measures of financial performance (growth associated with ROA, ROS, and ROE, and sales), (b) sustainability reviews have a negative association with firm value, and (c) the effect of sales, leverage, and growth is moderated by sustainability reviews.
Ameer and Othman (2012) screened 100 sustainable global companies in 2008 using four indices highlighting their commitment to sustainable practices. The authors found that companies that place emphasis on sustainability practices have higher financial performance measured by ROA, profit before tax (PBT), and cash flow from operating activities compared with those without such commitments.
Pan et al. (2014) concluded that sustainability, even though appears to have no significant impact on the growth rate or expansion rate of net assets, may have a positive impact on firm’s profits. Overall, the authors found that sustainability had significant effects on ROA, ROE, and Earnings per Share EPS.
On the neutral impact between sustainability performance and CFP, Inoue and Lee (2011) disaggregated sustainability into five dimensions to analyze how each of these dimensions would affect financial performance. The five dimensions were (a) employee relations, (b) product quality, (c) community relations, (d) environmental issues, and (e) diversity issues. ROA and Tobin’s Q were used to assess the short-term profitability of a company and the market’s expectation of future profitability, and one of the control variables used was size. The results of the analysis suggest that the impact of each sustainability dimension varies across industries—not all five dimensions have positive effects on short- and long-term profitability.
Dilling (2010) evaluated whether there are significant differences with regard to size, financial performance, capital structure, and corporate governance between firms that publish a G3 sustainability report to those that do not. Size was measured as market capitalization, financial performance as profit margin and 5-year growth sales, capital structure as the issuance of new equity and long-term debt, and corporate governance as the existence of sustainability and governance committees, audit committee, and board meetings. A positive association was found between a higher profit margin and sustainability reporting, negative association between long-term growth in sales and sustainability, and no association between corporate governance variables and sustainability. The author found that firms that are more profitable are more likely to provide high-quality sustainability reporting, and that a corporation experiencing long-term growth in sales is less likely to provide high-quality sustainability reporting.
Finally, regarding the negative link between sustainability performance and CFP, Jensen (2002) stated that managers pursuing sustainability would come into conflict with firm’s value maximization. Jennifer Ho and Taylor (2007) investigated how widely sustainability issues are being reported along with the economic issues, to determine the extent of TBL reporting in the United States and Japan. The authors found that profit is negative and significant at 10% level, evidencing that TBL reporting decreases with firm profitability (measured as ROA). Liquidity is significantly and negatively associated with total TBL disclosure. Size is positive at 1%, indicating that total TBL disclosure is greater for larger firms.
A sample of 110 firms, from DJSI and DJGI Dow Jones Sustainability Global Index, was evaluated by López et al. (2007). They found that corporate social responsibility (CSR) practices and performance, measured as the growth of PBT, are negative.
Most of the authors mentioned above used two groups of variables in their analysis: accounting-based variables and market-based variables. ROS; ROA; ROE; earnings before interest, taxes, depreciation, and amortization (EBITDA); liquidity; and profit represent the accounting-based variables and are present in many studies (Ameer & Othman, 2012; Jennifer Ho & Taylor, 2007; López et al., 2007; Pan et al., 2014) and also in Mecaj and Bravo (2014). These variables emphasize the firm’s historical performance. Market capitalization, pricing, earning P/E ratio, and Tobin’s Q are market-based variables, which reflect investors’ evaluation and expectation of firms. These have been used by Inoue and Lee (2011), Gadioux (2011), Pan et al. (2014), and Akisik and Gal (2014).
Moreover, they used control variables such as size, risk, leverage, and research and development (R&D) intensity to control for their possible effects on the sustainability–CFP relationship (Cezar & da Silva Junior, 2008; Inoue & Lee, 2011; Kapoor & Sandhu, 2010, and also Shahzad & Sharfman, 2015). These authors argue that larger firms with more investment in R&D are more likely to engage in sustainability initiatives and practices than smaller firms. The effect of firm-specific capital structure may affect this relationship because high leverage firms (and therefore risky) may behave differently in terms of sustainability investment than low-risk tolerant ones.
On the Theories Behind Sustainability Disclosure and the Relationship Between Sustainability and Financial Performance
For Belascu and Horobet (2013), the theoretical foundations on the link between social and financial performance can be explained in four categories: (a) unilateral causality—social performance causes financial performance, (b) unilateral causality—financial performance causes social performance, (c) bilateral causality—social performance causes financial performance and financial performance causes social performance, and (d) no causal relationship. Each category, except for the last one, presents a positive and a negative relationship between social and financial performance.
The positive relationship of the first category is that investors reward companies who behave socially responsible because they see their social performance as a sign of efficient management. The negative relationship is that there is a compromise between financial and social performances and companies invest in one or the other, but not in both simultaneously, due to financial constraints.
Second category’s positive relationship suggests financially healthy companies have funds to direct to social initiatives, and its negative relationship refers to the opportunistic behavior of managers, who might manipulate stakeholders to make strategic investments in the company’s social performance when their financial performance is low.
The positive relationship of the bilateral causality refers to a circle between investment in social performance, generating higher financial performance, which then leads to more social investment and so on. The negative relationship occurs when efforts to increase social performance lead to lower financial performance, which then results in lower social performance.
Finally, the last theoretical foundation argues that there is no relation between social and financial performance—the link cannot be found because it is too complex—or that there is a relationship of equilibrium—investments in social performance raise the demands for goods produced by the company, which leads to not only higher financial performance but also an increase in costs, which leads to lower financial performance.
The above causalities are rooted in some theories, such as the legitimacy theory and the signaling theory.
According to legitimacy theory, it is necessary to achieve society’s approval for the company to survive (Campblell, Craven, & Shrives, 2002). For Lindblom (1994), legitimacy is a status that comes from the harmony between a corporation’s value system and that of society. Corporations that consider sustainability crucial to their success might be interested to show their sustainability commitment to stakeholders (internal and external) by providing an extensive sustainability report.
O’Donovan (2002) suggested that companies need to behave as what is expected from society to maintain its business activities. This need of behaving as expected from society stimulates companies to disclose information as a legitimizing tool (Cho & Patten, 2007) and use documents to change society’s perception toward them (Deegan, 2002; Gray, Kouhy, & Lavers, 1996). Konar and Cohen (2001) say that companies tend to comply with environmental regulations and portray an image of environmental responsibility, which in turn is rewarded by the market. Therefore, SR can be seen as one of those documents that legitimize the behavior of a company, enforcing the legitimacy theory.
According to Connelly, Certo, Ireland, and Reutzel (2011), the signaling theory is useful for describing behavior when two parties (individuals or organizations) have access to different information—one party, the sender and insider, must choose whether and how to communicate (or signal) that information, and the other party, the receiver and an outsider, must choose how to interpret the signal. These authors state that signaling theory focuses mainly on actions insiders take to intentionally communicate positive, imperceptible qualities of the insider. Insiders could potentially inundate outsiders with observable actions, but not all these actions are useful as signals.
It is difficult for investors and consumers to know which firms are genuinely committed to sustainability, so firms may use costly sustainability initiatives to reduce information asymmetry (Connelly, Ketchen, & Slater, 2011), and that is why sustainability reporting frameworks are important. Companies will try to convey their sustainability efforts and mistakes in the most positive way, and the reporting frameworks help evaluate the true nature of such efforts. A standard framework eliminates the risk of uncertainty in measuring different sorts of information (Coalition for Environmentally Responsible Economy, 2010). The use of a standard framework for reporting is essentially important for investors, as they get to analyze the reports and compare companies.
Research Method
Database
The sample is composed of firms listed on ISE and the period chosen for the study is 2008 to 2014. Data were collected from each company’s sustainability report for each year; in total, 218 reports were downloaded and analyzed. This represents a total sample of 51 different companies. They disclosed SR in any of the years covered in the study period but only 13 were present in all the years of this period.
These companies were divided into four sectors: financial, industrial, infrastructure, and services. A similar classification is used by ISE (ISE website). The distribution of companies across the years for each sector is described in Table 1.
Sample Distribution Across the Period of Study.

Measurement of SR’ Quality
We set off from the previous studies by Ching et al. (2013) that analyzed the quality of SR from ISE companies, according to the GRI framework, from 2008 to 2012. In the present study, we extended the analysis for 2013 to 2014 and used the same methodology as before.
In 2013, ISE was composed of 34 companies, from which 19 used the G3 version of GRI and 15 used G4. In 2014, ISE had 39 companies and 10 used G3, whereas 29 used G4. Therefore, the content analysis was based on the G3 framework for 29 reports and on the G4 for 44 reports. Before 2013, none of the companies used G4 version. The differences between G4 and G3 are mostly related to the quantity and location of the indicators.
We classified the information present in the reports in the same way Ching et al. (2013) did on their studies: (a) When all information was disclosed, a score of 1 was given; (b) when almost all information was disclosed, 0.75; (c) when the information was partially reported, 0.5; (d) when the information was briefly disclosed, 0.25; and (e) when no information was reported, 0.
This classification allowed us to get a final score for each company. By using arithmetic mean, we could aggregate each indicator into its respective aspect, each aspect into its respective subcategory, each category into its respective category, and all categories into one final level. This was possible because the methodology guarantees that each information disclosed has the same weight, despite the amount of indicators related to each aspect/category.
To analyze the financial performance of each company, data were collected from Economatica, a Brazilian database. The following section describes the methodology used to analyze the financial data collected.
Measurement of CFP and Control Variables
This article takes into account both stock-market returns and accounting-based measures. We employ ROA, ROE, net margin %, and operational cash flow (in R$) as accounting-based indicators, and price earning P/E, Tobin Q represented by price/book value, and market capitalization (in R$) as market-based CFP index.
The regression analyses include three variables to control for their possible effects on the SR quality–CFP link: Size of the firm represented by total asset (in R$), to proxy R&D intensity capital expenditure (Capex; in R$), was considered, and leverage was computed as the ratio of total debt/total asset. These variables may be responsible for differences in the financial performance of the firms.
Statistical Tools Used
Initially, the sustainability overall score and its dimensions (economical, environmental, and social) will be addressed. Descriptive analysis and test for normality will be presented followed by linear correlation analysis among dimensions and, also with report year. Finally, linear regression analysis between report year and sustainability scores will be investigated (see Tables 2-4).
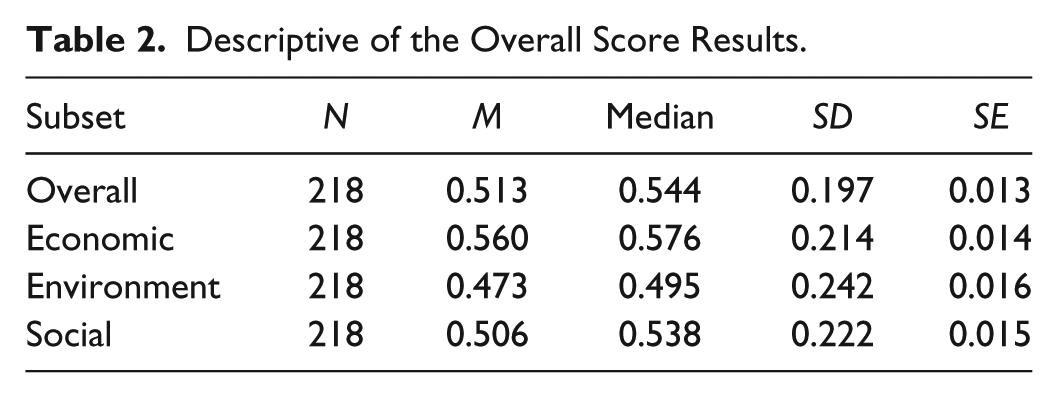
Descriptive of the Overall Score Results.
Nonparametric Correlation Analysis Among All Sustainability Dimension and Report Year.

Correlation is significant at the .05 level (two-tailed). **Correlation is significant at the .01 level (two-tailed).
Linear Regression Between Year and Sustainability Report Scores.

This is followed by statistical analysis of the financial variables (Capex, financial leverage, ROA, ROE, net margin %, price to book value, market capitalization, price earning, total assets, and operational cash flow) and their descriptive analysis. Then, linear correlation analysis between each of these variables and report year will be presented (see Tables 5 and 6).
Descriptive Analysis for the Companies’ Variables.

Note. ROA = return on asset; ROE = return on equity.
Linear Correlation Among Report Year and All Companies’ Variables.

Note. ROA = return on asset; ROE = return on equity.
Correlation is significant at the .05 level (two-tailed). **Correlation is significant at the .01 level (two-tailed).
At last, considering Capex, financial leverage, and total assets as control variables, multiple regression analysis investigates the dependence of market variables and accountable variables with sustainability overall score and report year (see Table 7).
Significant Linear Regression Models Between Report Year and Companies’ Variables.

Note. ROA = return on asset.
Results and Discussion
The descriptive analysis of SR’ quality during the 7-year observation period is shown in Table 2. The scores observed in a set of 208 reports of the sample show a room to improvement as the averages in the three dimensions are around .5. Slight differences among the dimensions are detected.
The above scores have improved slightly over the 5-year period (2008-2012) results from Ching, Gerab, and Pereira (2015). The scores were .497, .551, .460, and .495 compared now with .513, .560, .473, and .506 in overall score, economic, environmental, and social dimensions, respectively.
In Figure 1, it is possible to see the overall score for the quality disclosure, calculated by the arithmetic mean of the three sustainability dimensions.

Overall score for the disclosure.
Both Jarque–Bera and Shapiro–Wilk tests were applied for the overall score and for the sustainability dimensions separately, considering all 218 companies reports, assuming a .05 significance level. These tests indicated that the overall score and the dimensions results are not normally distributed. So, to measure the correlation between the variables, Spearman correlation was used and the results are seen in Table 3.
All three sustainability dimensions are positively correlated. The correlation coefficients are around .6 but strongly significant. This indicates that, in general, when the disclosure in one dimension improves, the scores of the disclosure in the other two dimensions follow this.
Report year has a weak, but still significant, positive correlation with economic and social dimensions. This result indicates that the disclosures of these dimensions are improving throughout the years.
To investigate how the disclosure in the three sustainability dimensions is similar, Kruskal–Wallis test was applied. This analysis indicates the existence of significant differences among dimension scores. Post hoc multicomparison test for Kruskal–Wallis, suggested by Daniel (1978) and Siegel and Castellan (1988), shows that the disclosure concerning the economic dimension is a little better than in environmental dimensions.
Table 4 shows the linear regression between report year and overall score. This regression has statistical significance at .05 level. It shows that the overall score presents an average .018 ± .007 increment per year, whereas for the 5-year period, it was .039 ± .007 (Ching et al., 2015). In the same table, the linear regression between year and the economic and social dimensions was tested at a .05 significant level. It resulted in a .023 ± .007 yearly improvements in the economic dimension score, whereas for the social dimension, this improvement was .016 ± .008. Concerning environmental dimension, the regression did not show statistical significance.
Table 5 shows the descriptive analysis for the variables used: Capex, financial leverage, ROA, ROE, net margin %, price to book value, market capitalization, price earning, total assets, and operational cash flow.
ROA has an average of 5.22%, ROE of 15.4%, net margin of 10.2%, financial leverage of 31.5%, price to book of 2.49, and P/E of 22.9%. There are companies of different sizes in the sample, and the variation of companies’ size is nearly three orders of magnitude.
A graphic analysis of this data distribution showed that three observations appeared with a completely distinct behavior. They (in a set of 218) were treated as outliers and removed from the data set. So, from now, only results associated to 215 reports/companies will be presented.
Linear correlation among report year and all companies’ variables can be seen in Table 6. Year presents significant and negative correlation with ROA, ROE, and net margin. Nonparametric Spearman correlation (not showed) confirms the parametric Pearson correlation results. It indicates that the companies’ performance deteriorates during this 7-year period. For other variables, no significant correlation was found.
To determine the influence of the SR’ quality on market-based variables and accountable variables, we performed multiple regression analysis of these variables using year and overall report quality disclosure as independent variables. All multiple regressions considered Capex, financial leverage, and total assets as control variables.
Year was statistically significant to explain the ROA and net margin. The year influence was negative for these two variables, in line with linear correlation analysis. ROA decreases at a rate of 0.559% per year, whereas net margin decreases 1.239%. For ROA, the control variables Capex and total assets presented statistical significance, whereas for net margin, the regression was significant only for total assets. Statistical analysis showed that the variable Year has no influence on the other variables behavior, so their linear regression models were not shown here (see results in Table 7).
The sustainability overall score was also included, as an independent variable, in all regression models, also using the suggested control variables. No model brings a significant linear coefficient for the overall score. Therefore, it was not possible to detect any influence of the companies’ disclosure, measured from their reports, in the market or accountable variables behavior during the 2008 to 2014 period.
For all regression models, the assumptions concerning the normal distribution of the residuals and the variance homoscedasticity were graphically verified.
Our statistical analysis points that (a) the quality disclosure in economic dimension is better than environmental dimensions and is improving throughout the years, although the average score is around 0.5, 1.0 being the highest; (b) when the disclosure in one dimension increases, this is followed by the scores of the disclosure in the other two dimensions; (c) the year influence was negative for the accounting variables as per multiple regression and linear correlation; (d) there is no association between accounting- and market-based variables and the disclosure quality of SR.
This is a challenging question: whether sustainability contributes to or harms CFP of the companies or for all dimensions of sustainability.
Conclusion
Most of the studies researched for this article investigate the link between sustainability performance and/or practices and CFP, others examine the relation between CFP and sustainability report reviews, with the disclosure extension of TBL reporting or with reports according to GRI guidelines. However, none of them examined the relationship between CFP and sustainability reporting quality. Results from this work point to neutral relation between quality disclosure of SR and CFP.
A possible explanation for the neutral link between sustainability quality disclosure and CFP is because profits from socially responsible conduct will compensate for the cost in a market equilibrium. Alternatively, the answer lies in the legitimation of the firm’s social and environmental activities in the eyes of the stakeholders. Or, even to reduce information asymmetry, the firms may use costly sustainability initiatives. The 7-year period of our study is robust enough to accommodate any turbulence in the market and/or in any specific economic sector.
Based on the findings, one may wonder why do firms pursue the sustainability path if these activities are beyond the firm’s legal obligation and may require sacrifice in short-term profits and/or may conflict with firm’s value maximization. Is the sacrifice of short term compensated by improvement in long-term financial performance? In our findings, the companies’ performance deteriorates throughout the years.
Finally, viewing corporate performance using only economic measures is not regarded as sufficient and, therefore, it should be measured also against social and environmental criteria. Shareholders may not want to invest in companies that are not following a socially responsible path. Similarly, stakeholders are concerned about whether a company is acting in an environmentally friendly way.
Suggestion for further studies is to compare these results with the firms listed in other sustainability stock indices. One limitation of this study is a possible bias in sample selection because our sample was drawn from firms included in the sustainability price index.
The results of this unique study contribute directly to the knowledge of the corporations providing voluntary CSR information in the form of quality SR and the importance of the development of globally accepted sustainability reporting standards.
Footnotes
Declaration of Conflicting Interests
The author(s) declared no potential conflicts of interest with respect to the research, authorship, and/or publication of this article.
Funding
The author(s) received no financial support for the research, authorship, and/or publication of this article.