
Abstract
Researchers in organizational ecology have started to pay more attention to audience perceptions. Legitimacy, for example, is no longer modeled as the number of organizations in a population. It is now thought to be dependent on how audience members perceive these organizations. It is believed that audiences penalize organizations that span categories because they cannot make much sense of them. This article will argue that category spanning dynamics follow the pattern proposed by the resource partitioning theory, thereby questioning the legitimacy of the claim that category spanning is detrimental to organization survival. Instead, the article develops a two-level model which distinguishes between category spanning and cluster spanning. The article will argue that cluster spanning, and not category spanning, increases the mortality hazard of organizations during all time periods. The theory is then tested within the context of the Lebanese newspaper industry (1851-1974). The result of both cluster analysis and survival analysis supports the two-level model.
Introduction
The concept of categories has spawned a wide set of research papers which stress the importance of members abiding by the rules set forth by the categories of which they are members. This line of research points to the negative impact that spanning categories have on the life chances of the organizations (Hsu, 2006; Hsu, Hannan, & Koçak, 2009; Hsu, Negro, & Perretti, 2008; Kovacs & Hannan, 2009; Leung & Sharkey, 2009; Negro, Hannan, & Rao, 2010; Pontikes, 2010; Zuckerman, 2004). This need to abide by social codes is confronted with the need of organizations to differentiate themselves from the competitors (Deephouse, 1999; Navis & Glynn, 2010; King & Whetten, 2008; Zuckerman, 1999, 2004).
Literature Review
One of the earliest, and most important, theoretical developments of organizational ecologists was the notion of niche width. 1 According to Freeman and Hannan (1983), “niche width refers to a population’s tolerance for changing levels of resources, its ability to resist competitors, and its response to other factors that inhibit growth” (p. 1118). The concept of niche width is at the heart of the study of generalist and specialist organizations. In essence, the study of the distribution and the dynamics of these two types of organizations is the study of niche width (Hannan & Freeman, 1977). Subsequent studies have compared the founding, disbanding, and survival rates of organizations that were classified into one of these two types. In his seminal paper, Carroll (1985) studied how the dynamics of generalists in fact led to the proliferation of specialists. The fundamental point made by that paper was that the two types of organizations were in fact connected in the resource space and that the activities of one group had a significant effect on the dynamics of the other.
The resource partitioning theory provides a very attractive theoretical framework for explaining real-world phenomenon that ran counter to dominant theories that predicted homogeneity in organizational forms within populations. Hannan and Freeman (1993) described how three environmental variables dictate what the best form of organization is: environmental variability, grain, and dissimilarity. In a similar manner, institutionalists posit that organizational fields are subjected to a strong force which pushes them in the direction of homogenization (DiMaggio & Powell, 1983; March, 1981). If organizations are forced to become homogeneous due to environmental pressures, then how can we explain the coexistence of both generalists and specialists in a diverse set of mature industries (Carroll & Hannan, 2004)? The resource partitioning theory provided a very plausible explanation.
An important question that researchers were faced with was how to determine the niche width of organizations. In other words, how do we decide which organization was a specialist and which was a generalist? This question is of fundamental importance because the researcher must be able to systematically classify the organizations into the proper group. Previously, this question was answered using a discrete mechanism. In their study of restaurants, Freeman and Hannan (1983) grouped 33 forms into three categories: generalists, fast-food establishment, and specialists. Carroll (1985) defined as generalists those organizations which published one or more general interest newspapers, while classifying the rest as specialists. Carroll and Swaminathan (1992) and Swaminathan and Carroll (1995) classified organizations in one of three forms: mass producers, microbreweries, and brewpubs. Boone, Carroll, and van Witteloostuijn (2002) considered the national newspapers which operated in every province to be the generalists, while local newspapers were taken as the specialists. Lomi (1995) divided the banks into core national banks and rural cooperative banks.
Some studies attempted to develop more flexible measures to determine the niche width of organizations. Baum and Singh (1994) used a measure of niche width which was based on the age groups which centers catered to; McPherson (1983) utilized a measure which was based on the demographic information of the members of voluntary organizations; Dobrev, Kim, and Carroll (2002) utilized the size of the organization to create a continuum along which the larger the organization the more “generalist” it was; Dobrev, Kim, and Hannan (2001) measured the niche width of an automobile producer as the spread of engine capacity over all models that are produced by a firm, but they only use the maximum and minimum engine capacities; and Hsu (2006) calculated the niche width as the number genres that each film was classified under. With the exception of the use of size as an indicator for the level of generalism, which is in itself problematic (Blau & Scott, 2003; Dobrev et al., 2001), all these measures share a basic assumption, and that is that the organization is a full-fledged member of each area in the resource space which it targets.
In recent years, Pólos, Hannan, and Carroll have developed a new theoretical framework which was based on the use of nonmonotonic logic (Hannan, Pólos, & Carroll, 2007; Pólos & Hannan, 2001, 2002). A primary departure from previous theoretical models is that “instead of treating categories as analytic, as products of researchers distinctions, we assume that the members of audience segments create categories and forms” (Hannan et al., 2007, p. 33). In their view, audience members, be they regular customers or industry critics, tend to group similar organizations into categories to which they assign labels. 2 Organizations are no longer thought of as being full-fledged members of the category or not being members at all. Instead, each producer is assigned a grade of membership 3 which can take any value between, and including, zero and one.
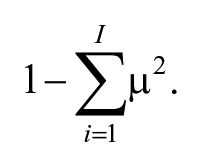
Using this new formulation, Hsu et al. (2009) revisited the topic of niche width. They proposed a measure which allowed for examining “the degrees of generalism, rather than a binary comparison of specialists versus non-specialists” (Hsu et al., 2009, p. 158). The measure proposed is Simpson’s index of diversity (Simpson, 1949):

where
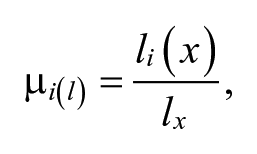
where lx is the total number of labels applied to the producer x. The numerator was set to one when a certain label was applied to the producer and to zero otherwise. The Simpson’s index can take on any value in the interval [0, 1], with zero indicating that the producer spans only a single category in which his grade of membership is one. The higher the index the higher the degree of generalism. This new conceptualization of the niche width was used in several studies, thus replacing the old binary classification scheme.
Kovacs and Hannan (2009) took the next logical step by proposing that the niche width of organizations needs to account for, at least to some degree, the structure of the category space. 4 According to them, the measure of niche width needs to include the “distance” between the categories that an organization spans. They argued that spanning categories that were close to one another should increase the niche width of the organization far less than spanning categories that had a large distance between them. The grade of membership of a certain producer was now modified so that the magnitude of the decline in the grade of membership depended on the distance between the labels. Next, the authors tackle the question of how to determine the distance between categories. This leads them to adopt the formula based on the work of Shepard (1987) where similarity is inversely related to distance. So the question of finding the distance now becomes one of finding the similarity. To find the similarity between two categories, the authors modified the measure proposed by Jaccard (1901) so that it allowed for asymmetry. With these new definitions of grade of membership, distance, and similarity, the authors also proposed a new formula for the niche width. The reason for this was that if we used Simpson’s index together with the new grade of membership formula, then the result can be negative, and this does not make sense (Kovacs & Hannan, 2009).
Development of Research Problem
The topic of niche width is linked to the concept of categories. Organizations that have a large niche width span categories while those that have a small niche width tend to concentrate their efforts on specific locations in the resource space (Hsu et al., 2009). The work of Kovacs and Hannan (2009), Hsu (2006), Hsu et al. (2009), and Hannan et al. (2007) all point in the same direction: Spanning categories is a hazardous act. Zuckerman (1999) and Zuckerman (2000) have shown that critics and analysts penalize products that do not fit in certain categories due to confusion over the product’s identity, while Zuckerman and Kim (2003) have also shown that market boundaries severely restrict the range of identities that economic actors can presume. Such results have been corroborated by a large number of researchers (Hsu, 2006; Hsu et al., 2009; Hsu et al., 2008; Kovacs & Hannan, 2009; Leung & Sharkey, 2009; Negro et al., 2010; Pontikes, 2010; Zuckerman, 2004). Several reasons have been proposed for such a downgrade: being a member of several categories means abiding by different social codes at the same time (Hsu & Hannan, 2005) which may lead to clashes of category codes (Kovacs & Hannan, 2009); there is an inherent trade-off between niche width and the capacity for performance (Hsu, 2006); organizations that do not abide by social codes lose legitimacy and hence appeal (King & Whetten, 2008); audience members find difficulty in evaluating the offerings of such organizations (Leung & Sharkey, 2009), or they simply do not view them favorably (Leung, 2010). Finally, Kovaçs and Johnson (2013) found that a number of the above factors might be involved.
While the general findings of most of these articles are aligned, several findings seem to suggest that the consequences of category spanning are context-dependent (Hsu et al., 2008). Pontikes (2008), for example, found that members of “lenient” 5 categories were able to span boundaries much more easily than members of categories which were not lenient. A similar result was obtained by Kovacs and Hannan (2009) and Hsu et al. (2008), who found that the effect of category spanning was contingent on the “fuzziness” of the category to which the organization belonged. Kovacs and Hannan (2009) found that once the structure of the space of categories is accounted for, quantitative results would differ not only by magnitude but also by sign. Time has also appeared to play an important role. Zuckerman, Kim, Ukanwa, and von Rittmann (2003) found that film stars that have many years of experience are able to straddle categories by acting in different genres, while less experienced actors were heavily penalized for the same action. On the contrary, Ruef and Patterson (2009) found that in the original stages of classification systems, there were low risks of devaluation because category heuristics were not well developed. With time, however, these heuristics developed into strict codes that members had to abide by. Rao, Monin, and Durand (2005) highlighted the dynamic nature of categories when they noted that the strength of category boundary was eroded as more and more producers crossed them. Recently, an interesting finding has suggested that in some cases, it might not be the properties of the categories themselves that determine the effect of category spanning, but factors exogenous to the categories. Pontikes (2010) found that different types of audiences react differently to category spanners while Phillips and Zuckerman (2001) found that it was the position of the producer inside the category that decided whether conforming was good or bad. Smith (2011), on the contrary, has found that the identity of organizations determines whether border-crossing activities are viewed positively or negatively.
While I believe that the category space needs to be accounted for, I believe that the formulation posited by Kovacs and Hannan (2009) could be further improved. This can be done in two ways. First, I believe that the entire structure of the category space needs to be taken into consideration, not just the distance between two specific categories. Second, I believe that the concept of distance needs to be accounted for not on the level of categories, but on the level of clusters that are formed from the dynamics of categories.
Problems With the Distance-Based Measures
One issue with the distance-based measure is that the sum of the grade of memberships of a certain producer does not necessarily add up to one. Theoretically, this is not really a problem because the grade of membership is not a probabilistic function, and therefore there is no requirement that the sum be equal to one (Hannan, 2010). However, by constraining the grades-of-membership to be equal to one, or at least equal to each other, we would be in alignment what is referred to as the principle of allocation. Hannan (2010, p. 168) stated that “the level of total category engagement is normally the same for all producers in a market,” while Hannan et al. (2007, p. 180) also imposed the “constant-sum” approach.
Another problem with the distance-based measure is that the grade of membership function is affected neither by features of the product or producer nor by the producer’s engagement in the category. Hannan et al. (2007) stated that “a natural step in seeking to comprehend the bases of membership in a label involves relating the feature values of the producers/products to their grades of membership in a label” (p. 60) and “ . . . the grade of membership in a position is the share of (producer) x’s engagement devoted to the audience at that position” (p. 180). If the grade of membership function reflects the appeal of an offering (Hannan et al., 2007), and engagement increases the appeal of the producer (Koçak, Hannan, & Hsu, 2009), then surely engagement affects the grade of membership of that producer (Hsu et al., 2009). Most research so far has used a binary function such that if a producer spans a category then the function is set to one and if not then it is set to zero (Carroll, Feng, Le Mens, & McKendrick, 2010; Hsu et al., 2009; Hsu et al., 2008; Kovacs & Hannan, 2009; Pontikes, 2008, 2010). I believe that the grade of membership should distinguish between the levels of commitment that the producer applies in each category.
The next issue with the distance-based niche width is more important than all of the above. Previous studies have shown that in many industries there comes a time when generalists take over the market. This is usually manifested as an increase in the market concentration ratio (Dobrev et al., 2002; Lomi, 1995; Marquis & Lounsbury, 2007). The increase in the number of generalists means that the proportion of times that categories are mentioned together will also increase. This, in turn, will lead to a decrease in the distance between the categories as the distance measure is based on the similarity measure, which is based on a frequentist approach. The decrease in the distance between the categories will lead to a decrease in the niche width of the generalist organization. So by increasing the number of generalists, these generalists are no longer generalists because their niche width decreases.
One of the proposed reasons that spanning categories is hazardous to organizations is that audience members penalize nonconformity. Imagine now that there exists a category space in which two certain categories always co-occur together at a certain point in time. Now imagine that a new organization comes along and decides that it wants to span just one of these categories. This would cause a decrease in the grade of membership of all exiting organizations, while the new organization will have a zero niche width because it only spans one category. Because a smaller niche width is more favorable than a larger niche width, the original organizations end up being punished while the new organization is not penalized for ignoring the second category, even though it is the new organization that has not conformed to the market dynamics.
The final problem with the proposed distance-based measure is that it only takes into account the actions of organizations that span the two focal categories when it calculates the distance between these categories. This might seem to be the logical thing at first, but it is important here to take note of the nature of categories. It is generally accepted that categories are socially constructed entities (Kennedy, 2005; Rosa, Porac, Runser-Spanjol, & Saxon, 1999; White, 1981, 2000). Therefore, the distance between categories is not an absolute measure that is independent of the surroundings. The distance between two categories is relative due to their socially constructed nature, so the context in which they exist must be taken into account. Previously, researchers have posited that the actions and resources of one population affect other populations (Freeman & Hannan, 1983), that competition is socially constructed (Porac, Thomas, Wilson, Paton, & Kanfer, 1995) and that it is largely a function of relative positions in the resource space (Baum & Haveman, 1997), and that the creation of reality in organizations is an ongoing process (Weick, 1995). Therefore, if in a socially constructed world (Berger & Luckmann, 1967), actions that take place in one organizational population can affect organizations in another population, it seems natural to argue that actions that take place, within the same population, in one category have an effect on other categories. In addition, if organizational reality and competition are themselves socially constructed, then significant shifts in the competition landscape (i.e., number of competitors and their average niche width) should affect how audience members evaluate all competitors. Dobrev et al. (2001) argued that “an organization can experience a change in its relative position without making any changes in its own product offerings” (p. 1306).
Clusters: A Multilevel Approach
How do we incorporate the category structure in the study of categories while overcoming the above issues? I believe that the solution lies in dividing the analysis into two parts. The distance-based measures proposed by Kovacs and Hannan (2009) incorporate the concept of distance at the category level, thus affecting the definition of grade of membership and niche width. My solution leaves the definition of niche width as proposed by Hsu et al. (2009) and incorporates the category space on a second level which I refer to as clusters.
It should be noted that clusters, as formulated in this article, are different from what Rosch, Mervis, Gray, Johnson, and Boyes-Braem (1976) referred to as superordinate categories. The delineation between subordinate, basic, and superordinate categories is a question of finding the “natural” level of categorization. Clusters, which are formed from category spanning activity, are on the contrary not natural. Their formation is dependent on the category spanning dynamics of organizations, and therefore they are nonnatural objects that are dynamically formed. This difference between superordinate categories and clusters is reflected in the fact that the question of the level of categorization is related to the taxonomy:
A taxonomy is a system by which categories are related to another by means of class inclusion . . . Each category within a taxonomy is entirely included within one other category (unless it is the highest level category) but is not exhaustive of that more inclusive category. (Rosch et al., 1976, p. 383)
The same cannot be said about clusters. A cluster does not necessarily include all of a category and a certain category can be included within more than one cluster. A cluster is not just another level in the taxonomy. It allows us to understand the relationship between different categories in the category space which arises due to the activities of organizations, hence the relationship between clusters and niche width as discussed above.
I determine the grade of membership μ of an issue in each category as the proportion of that issue that is dedicated to the category. The main advantage of this method is that this measure takes into account the engagement of the producer in each category. The greater the resources dedicated to a certain category, the higher the grade of membership. We can also see that this method allows for the sum of the grades-of-memberships to be equal to one for all newspapers. Now that we have a grade of membership in each category, we follow the lead of Hannan et al. (2007) and Hsu et al. (2009) and define the niche width using Simpson’s index of dissimilarity as
This measure takes values between zero and one, with a zero indicating that the organization spans a single category.
Now that we have the grade of membership and the niche width of the issue, we need to determine to which cluster the issue belongs. To do this, I use the statistical method of cluster analysis (Everitt, Landau, Leese, & Stahl, 2011). In the cluster analysis presented in this article, I used as a measure of proximity the Pearson correlation measure and used the weighted-average linkage as the linkage method. The reason for these two choices is as follows: First, with regard to the proximity measure, Everitt et al. (2011) noted that the nature of the data should determine the choice of this measure. If the variables measure the proportion of engagement that a producer dedicates to a certain category, then they can take any value between 0 and 1. In such a case, it makes more sense to talk about the correlation between the data than to talk about the distance. The variables provide an indication of the “relative profile” of the observation. The correlation between observations i and j is found using the following formula:

where
The above formulation has several desirable properties that overcome the limitations of including a distance-based measure on the category level. First, the grade of membership is dependent on the producers’ engagement, and the area under the fitness curve is constant and equal for all producers. Second, the proximity measure utilized also depends on the proportion of resources dedicated to categories. It is not enough to state that a certain organization spans a certain category in order to calculate its distance from other categories. Third, the determination of the best-fit number of clusters depends on all the information present, not just on information pertaining to certain categories. Changes in categories and organizations that take place outside the focal categories affect the best-fit number of clusters, and hence affect the assignments of all producer to the clusters. The determination of the best-fit number of clusters takes into account the differences between the category dynamics as well as the similarities (Everitt et al., 2011); thus, all the information is utilized to determine the number of clusters. Fourth, we no longer have the problem that a rise in generalists would lead to a decrease in the niche width of the generalists because we have uncoupled the concept of niche width from the concept of distance.
Revisiting Category Spanning: Formulation of Hypotheses
If spanning more categories leads to a decrease in the engagement that the producer dedicates to each category, why do producers seek to span more and more categories? Past research has shown that after a population has become legitimated, more and more pressure is placed on producers in order to distinguish their offerings from those of their competitors (Navis & Glynn, 2010). The result is that producers expand to new categories. In the case where the market is susceptible to economies of scale, this pattern is further enhanced because in addition to distinguishing their offers, category spanning will also drive down costs because the more categories a producer spans, the larger the number of audience members it attracts. This pattern will eventually lead to the rise of generalists, and the market will become dominated by organizations that span as many categories as possible. In the words of Carroll (1985), “in newspaper publishing, the dominance of generalists in the market represents the equilibrium state of a long, competitive process dictated by economies of scale” (p. 1268). Therefore, we would expect to see that organizations expand their offerings by entering new categories during the period of the “rise of the generalists.” This rise of the generalists will take place after the industry has successfully formed, because it is after the process of legitimation that organizations find themselves under more and more pressure to distinguish their offerings (Navis & Glynn, 2010).
According to the resource partitioning theory, this increase in the number of generalist organizations will lead to a highly competitive landscape in which only a few generalists can exist. By expanding their offerings in order to benefit from economies of scale and in order to attract as many audience members as possible, these organizations will find themselves competing with other large organizations in the same resource space. The abandoned edges of the resource space will attract new organizations that tailor their offerings in such a way that fills a small portion of the resource space. By doing so, these new specialist organizations will avoid competition with the large and established generalists, while they would manage to service audience members who are currently being neglected by the generalists. According to Carroll (1984), “Hawley’s model predicts that the losing competitors are transformed; the resource partitioning model predicts that those units die and that the differentiated units come from new sources” (pp. 1278-1279). Therefore, these specialists organizations are mostly made up of new organizations that seek to occupy a narrow niche that they have noticed is not being properly served.
Based on the above discussion, I do not believe that we can say “category spanning is hazardous.” Category spanning helps organizations distinguish themselves and helps them benefit from economies of scale. The effect of environments on organizations has long been a topic of interest and has received much attention from organizational theorists (Aldrich, 2008; Aldrich & Ruef, 2006; Lawrence & Lorsch, 1967; Pfeffer & Salancik, 2003). Both exogenous and endogenous environmental factors can cause a shift in the effect of the niche width of organizations (Swaminathan, 1998). Resource partitioning theory describes how endogenous changes can cause a significant shift in the effect of the niche width. Hannan and Freeman (1984) have argued that certain environments clearly favor generalist organizations. Many factors can help favor one form over the other, such as economies of scale (Dobrev et al., 2002) and network embeddedness (Echols & Tsai, 2005). More importantly, the timing in the industry evolution has proved to be critical in determining the effect of niche width (Dobrev et al., 2001). Research has shown that with time, the effect of niche width on organizational mortality and on the founding rates of different organizational forms is reversed. Swaminathan (1998) has shown how founding rates of specialist organizations increase as the concentration of the industry increases, while Dobrev et al. (2001) and Dobrev et al. (2002) showed that as market concentration increases the effects of niche width on the hazard rate changes from negative to positive. Therefore, I believe that the effect of category spanning, which determines the niche width, is not uniform throughout the lifetime of the industry. I believe that, as the resource partitioning theory predicts, at certain stages in the industry lifetime, the environment would favor generalists who are trying to distinguish themselves, or who are benefiting from economies of scale. During these periods, I do not believe that spanning categories will be hazardous to organizations.
However, once the industry has matured, the severe competition between generalists in the middle of the resource space will make it increasingly harder for generalists to survive. It is during this period that specialist organizations start forming. By not spanning many categories, these specialists will avoid direct competition with the generalists. If, however, an organization enters as a generalist, then it will be faced with severe competition from incumbent generalists, and therefore suffer from a high mortality rate. In addition, the intense competition for the center of the resource space will result in the death of some generalists because only a limited number of generalists can survive in the market (Carroll, 1985).
As explained above, cluster formation depends on the category dynamics in all the resource space, and not just between two focal categories or producers. It is important to note here that cluster spanning and category spanning are two separate things that can, in some instances, involve the same act. It is possible for an organization to expand its contents by spanning a new category. The result may be that this organization ends up in a new cluster. However, this is not always the case. It is also possible for an organization to span a new cluster by decreasing the number of categories spanned. Finally, it is possible for an organization to span a new cluster even if the number of categories that it spans remains the same. Specialist organizations have considerable freedom in their choice of “location” (Dobrev et al., 2002; Dobrev et al., 2001).
I propose that audience members are confused when producers span clusters. I believe that the act of moving from cluster to cluster is hazardous to the organization’s health because audience members will have difficulty in determining to which group the organization belongs. When a producer moves to a new cluster, then it will occupy a new position in this category space. This movement is determined by many factors, not just by whether the producer spanned more categories or not. Because the number of clusters is determined by using data from all producers, it might be the case that a producer ends up in a different cluster simply because the majority of organizations changed their category spanning dynamics. In such a case, the entire category space shifts and, even though the focal producer did not change its category spanning dynamics, it ends up in a new position. Because audience members view the position of the producer in relation to the position of all other producers, the end result will be that the producer’s position has changed. Another reason that is given to explain the hazardous effect of category spanning is that the organization that attempts to span a new category is not conforming to the “rules of the game.” An organization that crosses boundaries must be penalized, especially in a market in which boundaries are clearly delineated. However, it might be the case that the norm in the industry is to span many categories. Many studies have talked about a certain industry being crowded by generalist organizations. In such cases, it is the specialist organization that does not conform to the norms. Therefore, it is the organization that does not span categories that must be penalized for being the nonconformist. Here again, clusters help capture these dynamics. Finally, the work of Kovacs and Hannan (2009) explained that spanning distant categories is hazardous. While I follow their lead in taking into account the resource space, I do not mix the concepts of niche width and category distance together. Because distance is determined by the correlation between observations in this article, and the best-fit number of clusters is determined by the correlation that all observations have with all other observations, two different clusters represent two different sets of correlations, and therefore the distance between a producer in one set and another producer in another set is greater than the distance between two producers in the same set. This means that spanning clusters also captures the concept of distance. Instead of saying, “spanning distant categories is hazardous,” my model says, “changing your category dynamics relative to the dynamics of other producers in such a way that warrants a shift from cluster to cluster is hazardous.” This is similar to the argument made by Ruef and Patterson (2009), who stated that rare combinations of components would increase the hazard faced by organizations. Here, the word “rare” indicates a relative concept. In my model, spanning a combination of categories that is “rare” might lead the focal organization to end up in a completely new cluster.
This article has described how category spanning is different than cluster spanning. I have argued that the effect of category spanning is time dependent, while the effect of cluster spanning is uniform because it is confusing to audience members and because it might signal nonconformity. To test the above hypothesis, the models will control for both dynamics at the same time. As previously stated, not all cluster spanning is a result of category spanning, and not all category spanning results in cluster spanning. This explains why previous research has found that category spanning is not always hazardous.
Empirical Setting and Data Collection
The theories developed in this article will be tested within the context of the Lebanese newspaper industry. The newspaper industry has generally been a popular empirical setting in the past. It has been used in studies of organizational founding (Delacroix & Carroll, 1983), organizational mortality (Carroll & Delacroix, 1982), resource distributions (Boone et al., 2002), market partitioning (Carroll, 1985), management change (Carroll, 1984), interorganizational linkages (Miner, Amburgey, & Stearns, 1990), and organizational change (Amburgey, Kelly, & Barnett, 1993). The choice of industry was motivated by two reasons. First, there has been no study concerned with the organizational ecology model that has been tested within any Arab industry. Second, newspapers are well suited to the study of categories due to the nature of the product. Throughout the years, the number of newspapers published in Lebanon has been disproportionally large when compared with those published in other Arabic countries.
In the first stage of data collection, I collected the life history data of all the Lebanese newspapers from 1851 to 1974. The sources for this stage were Tarazi (1933), Dagher (1978), Khoury (1990), and Illias (1997). I then used Mruwi (1961), al-Majlis al Thaqafi al-Lubnani (1996), Khoury (1999), and Taleb (2011) to fill in some missing information. Finally, I conducted several interviews with industry historian Joseph Illiyas in order to fill in some missing information. By the end of this stage, I was able to collect information about the starting date, ending date, format (newspaper/magazine), and frequency of publication. A publication was considered a magazine if there was a table of contents at the beginning of the issue or if the page numbering was continuous, that is, if the first page in a magazine started off where the last page of the previous issue stopped. I was also able to record dates of when the ownership changed hands or when the journal changed its format.
By the end of this stage, I had collected the following information: There are a total of 1,759 newspapers, with 1,056 being published in Lebanon and 703 outside Lebanon. Around 81% of the publications in Lebanon were published in Beirut, while around 35% of publications outside Lebanon were published in Egypt. With regard to the publications in Lebanon, there are 59 cases of missing founding dates and 427 cases of missing disbanding dates. Out of these 427 cases, there are 164 cases of censoring before the end of the study. This means that while I did not find the ending dates of these publications, I managed to secure dates at which I knew that they were still in circulation. Finally, there are 119 cases of censoring due to the study ending at the end of 1974.
The next step was to identify the categories. The justification for the choice of categories is a question which must be addressed. In the case of this article, the justification is of a more practical nature than it is theoretical. While going through the newspapers, I noted the nature of the news stories and started classifying them. Items which were of a political nature or an economic nature were well expected in advance, but some other items came as a surprise. For example, I was surprised to see that many newspapers dedicated a significant portion of their space to literary issues that related to the Arabic language. This led me to decide to create a separate category for such items because their frequency meant that it would not be wise to disregard them by adding them to another more general category. During the process of going through the newspapers, I was able to identify nine different categories. The categories are Politics, Economics, Social Issues (education, immigration, etc.), Knowledge (math, physics, etc.), Literature (Arabic grammar, poetry, novels, etc.), Sport, Art, Advertisements, and Other (any item that could not be classified into any of the above groups was added to this group). The final data set consisted of 2,478 entries that belonged to 293 different newspapers.
Data Analysis
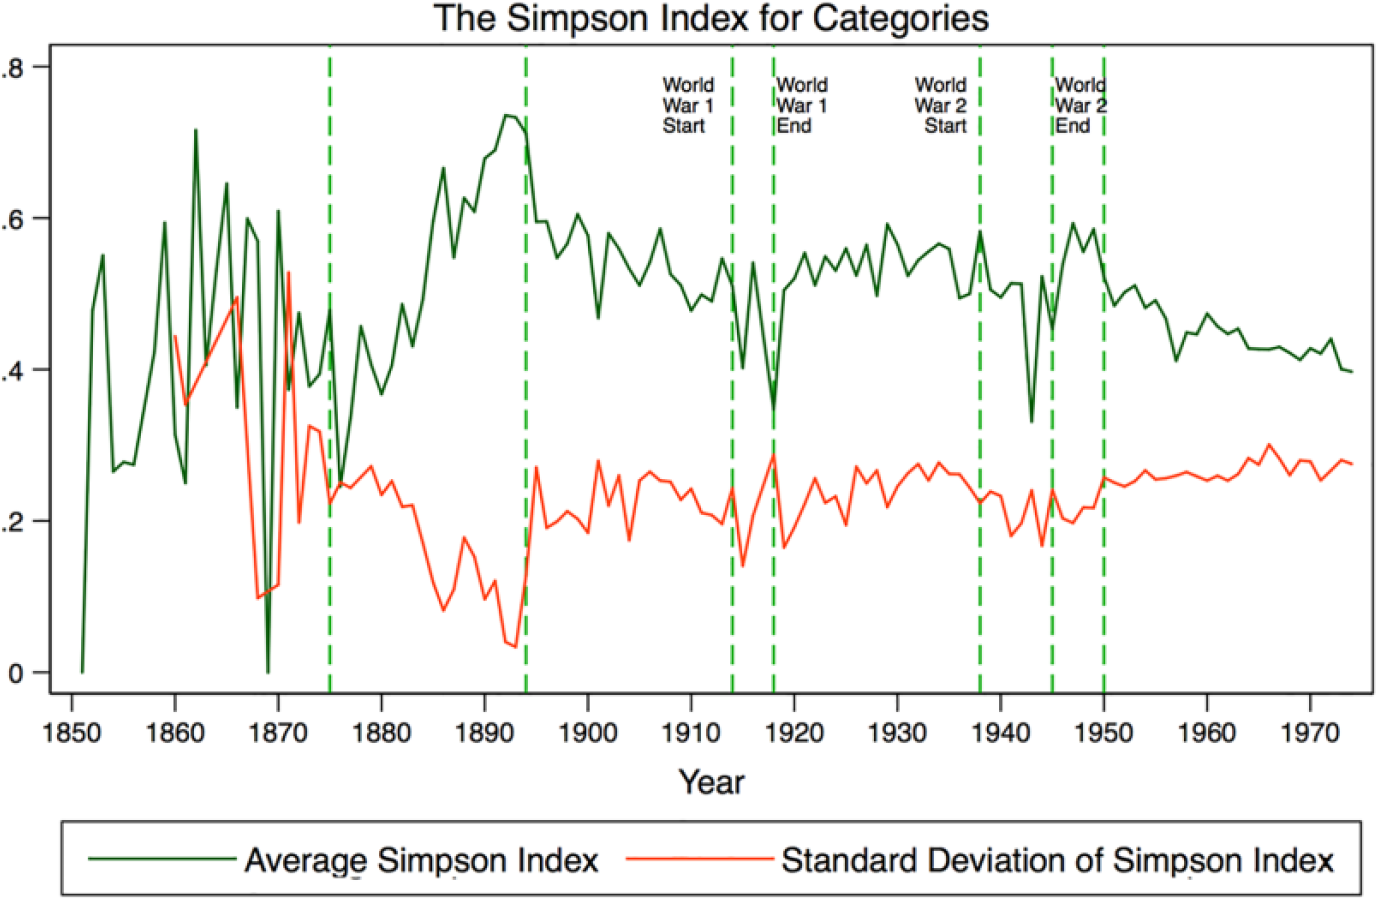
The first step in the analysis is to study how the newspaper issues spanned the different categories over the duration of the study period. To do that, I use Simpson’s index. I calculated this index for every single newspaper issue in the data set. I then grouped the issues according to their year of publication and calculated the average of the index and its standard deviation for every year. The results are presented in Figure 2. The vertical lines in the graph have been inserted at the points in which the graph shows that there was some change in the dynamics. Prior to 1875 (the first vertical line), the graph clearly shows that both the average and the standard deviation of Simpson’s index were shifting with no clear pattern. This is partly due to the fact that before 1865 there was a maximum of two issues per year. After 1875, we see a completely different dynamic in that the average of Simpson’s index kept increasing while the standard deviation was decreasing. The only explanation to this dynamic is that most of the newspapers were broadening their coverage. In other words, this period witnessed the rise of generalists. The fact that the standard deviation kept decreasing tells us that most of the newspapers followed this strategy. However, this dynamic was reversed after 1894 (the second line) where we can see that the average of Simpson’s index started decreasing while the standard deviation increased. A plausible explanation to this is that some newspapers were becoming more specialized, concentrating on one, or at least on a few, categories. However, this was not a universal strategy as illustrated by the standard deviation. Therefore, we would expect that this period saw the rise of some specialists with some newspapers remaining generalists. The third and fourth lines in the graph show the start and end of the First World War. We can see that the category spanning becomes more erratic during this period and represents a discontinuity in the general dynamics of Simpson’s index. The same can be seen during the Second World War (between the fifth and sixth lines). In between the two world wars, we see that neither the average of Simpson’s index nor the standard deviation exhibit any changes. The seventh (and last) line represents the point when the average of Simpson’s index starts decreasing while the standard deviation starts increasing. The dynamic during this period is similar to the one described above between 1894 and the start of the First World War in 1914. However, we can see that the slopes of the lines become more consistent and have less variation in the very last period. Again, the only explanation with regard to the last period is that some newspapers were more specialized while generalists continued to exist. This explanation is consistent with resource partitioning theory of Carroll (1985).
Survival Analysis
I next performed survival analysis on the entire period from 1851 to 1974 (Hosmer, Lemeshow, & May, 2011). The primary function of interest is the hazard function, which is the instantaneous rate of failure. It represents the probability that the event of interest occurs conditional on the subject having survived up to the present time:

T denotes the nonnegative time to event while t denotes time.
I used the proportional hazards Cox model. The results of the models are presented in Table 1. The models were successfully tested for the proportional hazards assumption. It should be noted here that all standard errors reported are robust because I used the cluster option because my data allow for multiple deaths for each newspaper. The first model in the table is the base model, and it includes several control variables. The first four variables are period control variables. The first variable indicates the start of the reign of Sultan ‘abd al-Hamid up to the constitution of 1908. The next two variables were period indicators for the two world wars. The fourth variable indicates the period after the implementation of the 1953 law which restricted the number of new licenses. The only statistically significant period indicator was the World War I variable. Figure 1 shows how the newspaper industry was almost wiped out during that period. Next, I added to the model some industry-specific variables. The first two are the total number of active newspapers and its square. Past research in organizational ecology has uncovered a U-shaped relationship between mortality and organizational density (Carroll & Hannan, 2004). However, our results indicate that there is a very narrow inverted-U shape, contrary to almost universal findings in previous research, but only the main term is significant. I also controlled for the total population of Lebanon. Numbers for the total population are severely lacking because the last census performed by the government was in 1932 and, due to religious and political grievances, the results of that consensus are highly questionable (Hudson, 1985). I collected the available data from Faour (1991), Harris (1997), and Tarābulsī (2007) and used linear interpolation to fill in the missing values. Although the coefficient is statistically significant, its value is extremely small. The last two variables I controlled for are the 1-year lagged number of founding and disbanding events. Some periods saw an increase in the founding events, for example, after the 1908 constitution, and I wanted to see whether an increase in founding events led to an increase in mortality due to increased competition. With regard to disbanding events, I wanted to see whether newspaper disbanding events tended to happen at the same time, that is, that an increase in disbanding events in 1 year was following with more disbanding events in the next. The results show that both coefficients are significant. It seems that a high number of disbanding events in 1 year predicted higher mortality rates for those that survive in the next, while a high number of founding events predicted a lower mortality rate in the following year.
Survival Analysis Results.

AIC = Akaike information criterion; BIC = Bayesian information criterion.
p < .05. **p < .01. ***p < .001.

Active newspapers (1851-1974).
Next, in Model 1, I included some organization-level control variables. I added a variable which indicated whether a publication dealt with politics or not, the number of pages, and the type of publication. Here it should be noted that other than newspapers and magazines, some journals where referred to as “matboo’a” (publication) in the sources. There were only 27 cases such as this. The model results show that these “publications” had a statistically significant higher hazard rate when compared with magazines but that the difference between magazines and newspapers was not significant. We see that after we added these organization-level variables, the number of active newspapers, and the lagged founding events are no longer significant. We can clearly see that Model 1 is a much better fit than the base model. I next added indicator variables that indicated in which period the newspaper was founded (results are not shown in the table) but none of them was significant and the resulting Akaike information criterion (AIC) and Bayesian information criterion (BIC) statistics were higher.
In Model 2, I added indicator variables to indicate the period in which the issue was published. There are six period indicators here, with Period 0 referring to the years 1851 to 1874 and Period 1 to Period 5 referring to each of the other periods as identified in Figure 2. I used the fifth period (1950-1974) as the reference category. The results show that being published in any other period was more hazardous than being published in the fifth period. All coefficients, except the Period 4 coefficient, are statistically significant. It is also interesting to see that the magnitude of the coefficients decreases with each consecutive period.
Dynamics of the category Simpson’s index over time.
Next, in Model 3, I added the variable span. It records when a newspaper enters a new category. The reason for including this variable is that I wanted to see whether entering new categories was statistically significant or not. It is important to note that this variable does not capture the number of categories spanned. It only captures whether the newspaper enters a category that it had previously not included. The result indicates that spanning new categories increases the mortality rate, but the result is not statistically significant. Next, I wanted to see whether the variable span was period dependent. 6 It was mentioned above that Period 1 seems to have witnessed a rise in generalists, while the rise in specialists occurred in Period 5. Perhaps spanning a new category is hazardous in the fifth period but not so in the first period. The result shows that spanning is hazardous in both periods. In fact, it is more hazardous in the first period than in the fifth period, but the result is not significant. These results indicate that entering a new category, without taking into account whether the number of categories spanned by the newspaper decreases, stays the same, or increases, is not significant. Next, I decided to see whether increasing the number of categories spanned increases mortality. To do so, I created a variable that I named catnum. This variable is set to one when the number of categories spanned by a certain issue is more than the number of categories spanned by the previous issue. Otherwise it is set to zero. The result of adding this variable is shown under Model 5 in Table 1. We see that the coefficient is positive but that, once again, it is not statistically significant. Next, I decided to see whether the variable catnum interacted with any certain periods. More specifically, I once again included the interaction of this variable with the period indicators for Period 1 and Period 5. Perhaps spanning a greater number of categories was not hazardous in Period 1 but was hazardous in Period 5. Model 6 shows that the coefficient of the variable has now become negative while both interactions are positive. However, only the interaction with Period 5 is significant. These results indicate that spanning more categories is not always hazardous to the health of the organization, thus supporting Hypothesis 1. Statistically speaking, the model shows that spanning more categories is only hazardous in the fifth period, which is the period of specialization. With regard to which model is a better fit, Model 5 or Model 6, the AIC and BIC statistic give contradicting results with the AIC favoring Model 6 while the BIC favoring Model 5.
I have argued in this article that cluster spanning, more than category spanning, is what is most hazardous to organizational health. So far the results indicate that spanning more categories increases mortality only in the fifth period. But what about cluster spanning? To see the effect of cluster spanning on mortality rate, I created a new variable that records whether an issue spans a different cluster than the previous issue. To do that, I first had to determine the best-fit number of clusters in each period. Milligan and Cooper (1985) examined 30 rules with the conclusion that while there was no single best rule for all situations, two seemed to work most of the time. These are the Caliński and Harabasz (1974) pseudo-F index and the Duda-Hart index (Duda & Hart, 1973). I used both rules to determine the optimal number of clusters for my data set. The results are presented in Table 2.
Best-Fit Number of Clusters.

Next, I assigned each issue in each period to one of the groups. An issue spanned a new cluster when it was not in the same cluster as the previous issue. So for example, if an issue of a newspaper was in the second cluster while the next issue was in the first cluster, I set the cluster spanning variable to 1. If they were in the same cluster then the variable was set to 0. Model 7 shows the result of including this variable in addition to the variables of Model 6. The results indicate that catnum is negative and not significant, but that its interactions with both the Period 1 and Period 5 indicators are positive. This means that spanning more categories increased mortality rates in both Periods 1 and 5. The fact that spanning categories increases the hazard of mortality in Period 5 lends support to Hypothesis 2. What is even more important for us is that the coefficient of the binary variable which records cluster spanning is both positive and statistically significant indicating that spanning clusters increases mortality rates, thus supporting Hypothesis 3. The AIC and BIC statistics clearly favor Model 7 above all other models. It is important to note here that a newspaper can span a different cluster without increasing the number of categories that it spans. What Model 7 tells us is that in such a case when catnum is zero, cluster spanning is hazardous to the organization’s mortality. In addition, if an issue increases the number of categories that it spans in Period 1 or Period 5 and, by spanning more categories, is placed in a cluster different from the previous issue, then there are two positive coefficients that will cause an increase in the mortality rate. In other words, category spanning captures only one hazardous dynamic while cluster spanning captures another. Finally, to see whether the effect of spanning clusters was period dependent, as was the case with category spanning, I interacted the spanning variable with the different time periods (results not shown in the table). All of the interactions proved to be statistically insignificant, and the resulting model was a worse fit than Model 7. This is in line with the statement in Hypothesis 3, and that is that cluster spanning appears to be period independent.
Categories or Features?
Hannan et al. (2007) defined “a type as a coupling of a label and a schemata that articulates a view about what pattern of feature values determine the applicability of the label” (p. 60). Later they stated, “We can now define a category as a type for which an audience segment achieves a high level of extensional and intensional consensus” (Hannan et al., 2007, p. 69). What if the “categories” that were identified by this article were nothing more than features? This would imply that the “clusters” which were formed were actually categories, and thus the findings of this article would be exactly in line with present research on the effects of categories.

The graph of the hazard linear predictor.
I wrote a program that displayed the amount of space dedicated to each category during the last period (1950-1974) of this study. This is the period that saw the rise of specialists. Specialists tend to span few categories, but they do not necessarily have few features. Therefore, if my identification of categories were correct, I would expect to see many of the clusters formed during this last period to be populated by newspapers that concentrate their content on a certain category. According to the Caliński and Harabasz measures, eight clusters is a very good fit, but not better than six, while according to the Duda-Hart index six clusters is not a good fit. Therefore, I chose to divide the data into eight clusters because both measures agree that it fits the data well. I then calculated the average proportion dedicated to each category in each cluster. The results are presented in Table 3. In this article, I have used the value 0.11 as the cutoff value to determine whether a newspaper issue spanned a category or not. We can see that, except for the category “sports,” every single category was spanned by at least one cluster. We can also see that there was always a single cluster which dedicated more than half of its content to that category. These results show that most of the clusters tended to dedicate the vast majority of their contents to a single category. They also show that each category was the center of attention of exactly one cluster. Next, I display the correlation matrix during that period for all categories. If these categories were in fact features, then we would expect to see a high correlation between some of them, if in fact organizations do form categories by combining features. In the words of Rosch et al. (1976), “Subordinate categories have lower total cue validity than do basic because they also share most attributes with contrasting subordinate categories” (p. 385). The correlation matrix is displayed in Table 4. The highest positive correlation is 0.2517, which is very weak. Again, this result shows that the categories that I identified are not features. Another important thing to notice in the correlation matrix is that out of the 36 correlations, 27 are negative while only 9 are positive. Again this vindicates my choice of categories because it shows that if one category is spanned then other categories tend not to be spanned.
Average Proportions Dedicated to Each Category in Each Cluster (1950-1974).

Note. The numbers in bold are the largest numbers in the column with the condition that they be greater than .11.
Correlations Between Categories (1950-1974).

Implications for Future Research
The cluster spanning theory that is developed in this article can be tested within the context of populations other than that of the Lebanese newspaper industry. By studying clusters, we would not only be studying the effects of category spanning, but we will also be studying how organizations group together during different periods throughout the lifetime of the industry. I believe that cluster analysis is a very promising direction which organizational ecologists should direct their attention to. Researchers in the field have always had their differences with regard to how to identify forms. This has led to huge efforts that were mostly directed at the study of a single organizational population. In a world in which boundaries between organizational populations are quickly eroding due to the rise of huge corporations, it would be useful if organizational ecologists were able to take into account more than one population at a time. Because cluster analysis is a multilevel approach, I believe that it allows researchers to do exactly that. While this article studied how clusters formed from category dynamics, there is no reason why the same approach cannot be used to study other levels. For example, the researcher can replace categories with industries. This would allow him or her to study how clusters form from the activity of organizations in different industries. Organizational ecologists need no longer concentrate their efforts on single industries. On the contrary, the researcher might choose to move downward instead of upward, in that instead of moving from categories to industries, he or she can move from categories to features. Categories are formed from the combination of features. A valid research agenda is to study whether the combination of features changes over time and how do categories emerge from these combination. Again, this can be done using the cluster analysis approach utilized in this article due to the fact that this approach allows for two separate but related levels. The researcher need not collect data that are continuous because various binary measures exist in the cluster analysis literature. Therefore, the nature of the data collected might differ from that used in this article. The methods used in this article can be applied to other settings with different sets of data, thus enabling researchers to test the theories in a large, and diverse, number of settings.
Conclusion
The resource partitioning theory argued that the hazards faced by generalists and specialists are not uniform and that they were time dependent. I tested this same idea but instead of relying on count models that studied the number of generalists and specialists, and instead of classifying organizations as generalists or specialists, I relied on the Simpson’s index to do the work for me. Next, I argued that if it were the case that category spanning is an aspect of the resource partitioning theory, then we would expect that the effect of category spanning was in fact not uniform throughout the life period of the industry. The survival models show that category spanning is period dependent. From there, I argued that instead of thinking of category spanning we should be studying what I referred to as “cluster spanning.” Clusters are formed from the dynamics of category spanning. I argued that the act of spanning clusters is hazardous to organizations no matter in which time period they were active. Some category spanning activities lead to cluster spanning activities, but there exists some category spanning activities that do not necessarily result in spanning a new cluster. Even more interesting is the fact that it is possible to span a cluster even when there is no category spanning activity. It should be noted, however, that even when we take into account cluster spanning in the above models, the effects of category spanning are still hazardous in certain periods. Ultimately, in some time periods, the highest hazard is faced by organizations that span both categories and cluster at the same time.
Footnotes
Declaration of Conflicting Interests
The author(s) declared no potential conflicts of interest with respect to the research, authorship, and/or publication of this article.
Funding
The author(s) received no financial support for the research, authorship, and/or publication of this article.