
Abstract
Thailand’s gross domestic product per capita is higher than many of its neighboring countries, however, the quality of life in Thailand varies tremendously as wealth is concentrated among the rich. This study uses both quantitative and qualitative methods. K-Means clustering combined with a recent cluster validity index is used to split respondents into eight groups with similar behavior in each group. Extreme Gradient Boosting is then utilized to analyze important factors that affect quality of life. One-hundred and twenty in-depth interviews are then used to highlight how individuals view the quality of life in Thailand. This study has a significant impact as policymakers can utilize our models to improve the quality of life for Thai residents in each category.
Plain Language Summary
While research on the quality of life in Thailand exists, most cover only certain parts of Thailand with a focus on health-related aspects of quality of life with particular age groups and in certain occupations. Further, studies on the quality of life in Thailand tend to be either qualitative or quantitative. Our research has an advantage as we study the quality of life in Thailand from people of all ages with different occupations from all regions, and we consider the quality of life from multiple dimensions using both quantitative (country-wide survey) and qualitative data (120 in-depth interviews). Our research is unique as unsupervised learning methods have not been used to study inequalities in the quality of life in Thailand. In this research we use both unsupervised and supervised machine learning methods to understand the quality of life of the Thai population. We use K-Means clustering combined with a recent cluster validity index to split respondents into groups with similar characteristics and Extreme Gradient Boosting (XGBoost) to analyze important factors that affect quality of life. In-depth interviews are then used to allow us to better understand individuals’ perspectives relating to how they perceive each factor as impacting their quality of life. The results of this study have a significant impact as policymakers can utilize our models to improve the quality of life for Thai residents based on their characteristics and backgrounds.
Introduction
Thailand is a developing country located in South East Asia. As of 2020, the country’s real gross domestic product (GDP) per capita is US$17,300. This is much higher than estimates for neighboring countries such as Cambodia (US$4,200), Laos (US$7,800), Myanmar (US$4,500), and Vietnam (US$8,200) (Central Intelligence Agency, 2022). Nevertheless, the quality of life (QOL) of the Thai population varies starkly.
The distribution of land and wealth in Thailand is highly concentrated among the rich. Laovakul (2015) pointed out that the top 10 percent of all landowners hold over 61.48 percent of all land compared to just 0.07 percent for the bottom 10 percent. The top fifth hold 326 times the amount of land of the bottom fifth. Furthermore, if assets are defined as land and buildings used for residence, business, agriculture, and other purposes, vehicles, and financial assets, the top 10 percent own 37 percent of total assets while the bottom 10 percent own less than 3 percent (Laovakul, 2015).
While many researchers have examined Thailand's QOL, the majority of them only looked at select regions (Jongudomkarn & Camfield, 2006; Kittipichai et al., 2015; Sirisuwan et al., 2021; Sittironnarit et al., 2020; Sudnongbua et al., 2010; Tamornpark et al., 2022; Yodmai et al., 2021) of specific age groups (Rojnueangnit et al., 2020; Sirisuwan et al., 2021; Somrongthong et al., 2017; Thavorncharoensap et al., 2010; Thongsing et al., 2020; Yodmai et al., 2021) and in some professions (Kittipichai et al., 2015; Sittironnarit et al., 2020; Vutyavanich et al., 2007). Most research focuses on health-related QOL (Glangkarn et al., 2011; Tamornpark et al., 2022; Thavorncharoensap et al., 2010; Thongsing et al., 2020; Wichit et al., 2017). Our study contributes to the body of literature by examining QOL in Thailand among individuals of all ages and from a variety of occupational backgrounds.
In addition, studies on the QOL in Thailand mostly fall into one of two categories: qualitative or quantitative (e.g., Jongudomkarn & Camfield, 2006; Kittipichai et al., 2015; Saladyanant et al., 2021; Tamornpark et al., 2022; Thongsing et al., 2020; Vutyavanich et al., 2007; Waewwab et al. 2022; Yodmai et al., 2021), there are some exceptions (e.g., Mormon et al., 2021; Pheap & Sripokangkul, 2017). Our study uses both quantitative and qualitative methodologies to examine quality of life across a number of domains. We take both objective and subjective QOL measurements into consideration to represent the differences in QOL between individuals within geographic segments.
This article begins with an overview of QOL and QOL in Thailand. Then we proceed to describe our methodology and characteristics of sample. We then proceed to the results and discussion section. We use both quantitative and qualitative data to facilitate our analyses. A country-wide survey is used to collect data and K-means clustering and Extreme Gradient Boosting (XGBoost) are used to group individuals according to similar characteristics and examine factors that affect QOL. Then, in-depth interviews are used to show how people perceive the QOL in Thailand.
Our article extends current understandings of QOL in Thailand by addressing the dynamics and factors that Thai people think affect their QOL. K-means clustering shows that overall, participants indicated that the factors that have the most impact on one's QOL are finance, job, education, family, and healthcare. Further, NCvalid allows us to create eight groups according to the dominant characteristics: 1) safety and public services, 2) family relationships, 3) public services and career stability, 4) financial status and access to education, 5) financial status and career stability, 6) unique, 7) financial status and safety, and 8) residential community conditions and public services.
Literature Review
Quality of Life
QOL refers to a person’s well-being and can be measured using different kinds of variables. It is the degree of comfort and satisfaction experienced by an individual or a group (Cambridge Dictionary, 2023; Ferriss, 2004). QOL has been a topic of interest across many fields for a long time; however, it has different meanings in each field. Health and medicine places a strong emphasis on this concept and produces ongoing research (Chan & Wang, 2013; Frazer & Mobley, 2017; Malik et al., 2022). This field focuses on individual achievement at the micro level by examining how different types of therapies affect the rehabilitation of people who receive the treatment. Meanwhile, economics mainly studies QOL at the macro level, for example, crime rate, pollution level, and access to health services (Cheshire & Magrini, 2006; Lambiri et al., 2007; Shapiro, 2006; Shi et al., 2021). In this article, we use sociological theory and research methods to study the QOL in Thailand as sociology allow us to understand the topic at both the micro and macro level.
Sociologists began studying the QOL of people in 1918 (Sewell, 1940) and have continued to study it since (e.g., Ferriss, 2004; Gerson, 1976; Sheykhi, 2021). Nevertheless, the concept of QOL is not popular among sociologists because it overlaps with many topics already studied by sociologists, for example, social stratification and inequality, poverty, and crime. These subtopics are used to measure the QOL of a population.
QOL can be categorized objectively and subjectively. An objective view of QOL is based on social factors, such as crime rate, life expectancy, unemployment rate, poverty rate, and GDP, independent of an individual’s perceptions. On the other hand, a subjective view of QOL relies upon an individual’s perception and evaluation of social conditions; for instance, safety, happiness, job satisfaction, and family relationships (Hagerty et al., 2001; Noll, 1996; Rapley, 2003; Sinha, 2019).
Different studies on QOL have different ways of constructing indicators of QOL (see, e.g., Leelakulthanit & Day, 1992; Ruta et al., 1994; Tikadar, 2019). While the literature on QOL diverges on QOL as a singular entity or a multidimensional construct made up of limitless number of domains (Rapley, 2003; Yadav, 2019), our research views QOL as a multidimensional construct. We constructed our survey to analyze QOL in relation to these variables: access to healthcare, access to education, access to public transportation, traffic conditions, pollution level, weather, safety, free time, family relationships, financial status, career stability, residential community conditions, natural environment, and political situation. Although certain variables may be universal, there is no comprehensive QOL standard that can be applied to all cultures (Campos & Johnson, 1990; Yadav, 2019). Thus, we use semi-structured interviews to capture the different perspectives that Thai citizens have on their QOL rather than rely solely on quantitative analysis.
Quality of Life in Thailand
Research within Thailand has studied inequality in many different dimensions, for example, economic and income inequality (Bootngam, 2012; Jenmana & Gethin, 2019; Kilenthong, 2016), education inequality (Bootngam, 2012; Kantachote, 2013), and health inequality (Hong et al., 2020; Srithamrongsawat et al., 2013). Studying inequalities in QOL requires the integration of various dimensions which allows us to reduce the shortcomings associated with studying inequality from only few dimensions.
Although research on the QOL in Thailand exists, most studies only cover certain parts of Thailand (e.g., Bangkok [Kittipichai et al., 2015; Leelakulthanit & Day, 1992; Sittironnarit et al., 2020], Northeast and South region [Jongudomkarn & Camfield, 2006], and Northeast region [Sirisuwan et al., 2021; Sudnongbua et al., 2010]) and focus on health-related aspects of QOL (e.g., Glangkarn et al., 2011; Thavorncharoensap et al., 2010; Wichit et al., 2017). Furthermore, many studies only focus on the QOL of certain age groups (e.g., elderly [Sirisuwan et al., 2021; Somrongthong et al., 2017; Sudnongbua et al., 2010] and children [Rojnueangnit et al., 2020; Thavorncharoensap et al., 2010; Torcharus & Pankaew, 2011]) or certain occupations (e.g., health care providers [Sittironnarit et al., 2020; Vutyavanich et al., 2007], blue-collar jobs [Kittipichai et al., 2015], and students [Sapsaprang et al., 2015]). QOL studies in Thailand also tend to be either qualitative (e.g., Jongudomkarn & Camfield, 2006; Saladyanant et al., 2021) or quantitative (e.g., Kittipichai et al., 2015; Sittironnarit et al., 2020; Vutyavanich et al., 2007), although there are some exceptions (see Mormon et al., 2021; Pheap & Sripokangkul, 2017).
Our research has an advantage in that we study the QOL in Thailand from people of all ages with different occupations from all regions, and we consider the QOL from multiple dimensions using both quantitative and qualitative methods. This is crucial as Leelakulthanit and Day (1992) stated that studies on the QOL in Thailand have dealt mainly with objective measures which usually measure specific population segments or geographical areas and do not account for variation in the QOL of individuals within those population or geographic segments. Therefore, in this study, we go beyond that as we use both objective and subjective measures of QOL.
The statistical methods used in this research are unique as we use both unsupervised and supervised machine learning methods to study the QOL of the Thai population. Unsupervised learning methods have been around since the 1930s and have been used in anthropology and psychology (Cattell, 1943; Zubin, 1938). Currently, unsupervised learning methods are not widely used in social sciences. However, these methods are very popular in medical science, online trade, and network analysis. A few works in the social sciences have applied unsupervised learning methods (see Gurusamy et al., 2017; Maione et al., 2019).
With supervised learning techniques, such as linear and logistic regression, we define independent variables that we want to study and see how they affect the dependent variable. However, with unsupervised learning methods, such as cluster analysis, independent variables are not defined. Instead, all or part of the variables are used to explore a population using mathematical models. The resulting number of clusters can either be hand-selected or determined using a cluster validity index.
To our knowledge, unsupervised learning methods have not been used to study inequalities in the QOL in Thailand. We, therefore, use unsupervised learning method in this study. This approach is advantageous as it can reduce the researchers’ bias. This method does not make preliminary assumptions about which population has a good or bad QOL. Supervised learning is then used to understand each subgroup. Semi-structured interviews is then utilized to allow readers to understand Thai citizens’ perspectives on their QOL.
Methods
In this article, we utilize both quantitative and qualitative data to analyze the QOL in Thailand. The Institutional Review Boards of Srinakharinwirot University and King Mongkut’s University of Technology Thonburi have approved this research (SWUEC/E-346/2564 and KMUTTIRB-COE-2022-035). We use methods from two disciplines—statistical science and sociology. We use statistical learning to analyze QOL at the macro level by exploring variables such as access to healthcare, access to education, access to public transportation, traffic conditions, pollution level, weather, safety, free time, family relationships, financial status, career stability, residential community conditions, natural environment, and political situation. Sociological theories are then used to explain the phenomena behind the impactful variables. It is crucial that we study QOL at both the macro and micro level as the statistical data only provides an overview of what QOL problems exist in Thailand. Enriching the statistical data with data collected from interviews allow us to understand the real problems through the eyes of the people themselves.
Survey
While Thailand can be subdivided into six regions: North, Northeast, Central, South, Eastern, and Western Thailand; however, we decided to collect our data from four regions: Central, Northern, Southern, and Northeastern Thailand as it is most common when collecting statistical data (National Statistical Office, 2023). We used consecutive sampling to collect data from as many sources as possible so that we could develop a clearer idea of the unknown factors affecting the QOL of people in Thailand. The fieldworkers were based in Bangkok, Phitsanulok, Songkhla, and Khon Kaen; therefore, the surveys were mainly administered in these four areas and their surrounding provinces from April 2022 to November 2022.
In the survey (see Table 1), there are 31 features collected categorized as: 1) personal features (age, sex, gender, marital status, religion, educational attainment, occupation, monthly income, family size, monthly household income, and region), 2) factors that affect QOL (access to healthcare, access to education, access to public transportation, traffic conditions, pollution level, weather, safety, free time, family relationships, financial status, career stability, residential community conditions, natural environment, and political situation), and 3) QOL evaluations (QOL self-score, QOL in Thailand, effect of COVID-19 on QOL, QOL related to inequality, government sector can improve QOL, and private sector can improve QOL). Note that machine learning sample size is complicated and has no formula to compute. We applied the rule of thumb that the sample size must be at least
Summarized Survey.

Demographic Characteristics of Respondents.

Machine Learning Models
In this study, we applied both supervised and unsupervised machine learning methods to analyze the data collected from the survey. First, we combined K-means clustering with a cluster validity index called NCvalid to split the 982 survey respondents into groups where respondents in the same group share some similar characteristics. Then, we applied XGBoost to each group to predict the respondents’ QOL self-score (Figure 1). The purpose of using XGBoost is not to predict one’s QOL self-scores in the future but to rank factors that affect QOL the most.

Machine learning models.
K-Means Clustering
K-means clustering (Macqueen, 1967; Steinhaus, 1956) is an unsupervised learning technique used to split a dataset into different clusters that are made up of data points that share similar characteristics based on the features we use. Let

where
NCvalid
NCvalid is a correlation-based cluster validity index (Wiroonsri, 2024). The larger NCvalid indicates the better clustering result. We decided to use NCvalid instead of other indices as it provides not only an accurate optimal number of groups but also sub-optimal options. We applied this index to the K-means clustering for
XGBoost
XGBoost is a supervised learning model used to predict a response
K-Fold Cross-Validation
We apply k-fold cross-validation to each of the XGBoost models to check its accuracy and tune its parameters. This method first splits the original dataset into
Semi-Structured Interviews
Semi-structured interviews with 120 Thai citizens from 4 regions in Thailand were used in this study. The interviews were conducted from March 2022 to May 2022. The results of the interviews are supplemented with participant observation and detailed fieldnotes. Interviews and informal conversations with the locales (e.g., government officials and business owners) were also used.
Research participants were approached at various sites (e.g., plazas, restaurants, universities, government buildings, and tourist attractions) in different cities of Thailand. The interviews usually took place in restaurants or in the respondent’s workplace or home. Four interviews were conducted via zoom as the participant had either tested positive for COVID-19 or had to quarantine. The interview instrument included questions on the respondents’ backgrounds, their points of view on QOL in general and QOL in Thailand, their own QOL, and the effect of COVID-19 on their QOL. The interviews lasted approximately half an hour. All but 20 interviews were tape-recorded and fully transcribed. Respondents that did not allow their voice to be recorded often cited the concern that their voice could perhaps lead to their identification. Extensive notes were taken during the non-taped interviews. The interviews were conducted in Thai by four research assistants who were local and/or has residency in Northern, Northeastern, Southern, or Central Thailand. The interviewer’s identity as a person from the same region as the respondent facilitated a level of comfort, particularly as respondents frequently discussed issues of QOL conflicts and the difficulties they faced due to where they lived. We used Atlas.ti to analyze the data. The respondents were compensated 300 baht for participating in the research.
Characteristics of Sample
All the respondents were Thai citizens. The respondents were from 4 regions, 30 respondents from each region—Northern, Northeastern, Southern, and Central Thailand. The respondents’ ages ranged from 16 years old to 77 years old, with an average age of 38 years old. All participants are 18 and above, except for one who was 16. A written approval was collected from the parents. The sample consisted of 75 females and 45 males. Most (91 percent) identified themselves as straight and 9 percent as LGBTQ+. Most participants were single (57 percent), 34 percent are married, others were widowed (3 percent), divorced (4 percent), and a few preferred not to specify their marital status (2 percent). The sample consisted of different religious affiliations, 83 percent were Buddhists, followed by Islamists at 12 percent, Christians at 3 percent, and atheists at 3 percent. One person did not reveal their religious beliefs. The sample was diverse in their educational attainment. The participant’s education level ranged from primary education to those with PhDs. Most had a bachelor’s degree as their highest educational attainment (49 percent). Our respondents were employed in different kinds of jobs, for example, college student, academic, business owner, government official, waiter, housekeeper, security guard, accountant, food delivery, and those who were unemployed. The average salary per month of the respondents was 17,881 baht, however, some had no income at all while others earned 100,000 baht per month. The calculation is based on 117 respondents as three of the participants opted out of providing their salary.
Ethical Considerations
Ethical approvals were obtained from the Institutional Review Boards of Srinakharinwirot University and King Mongkut’s University of Technology Thonburi. The purpose of the research, the voluntary participation in the study and the option to opt out of the research were explained. In addition, written informed consent was obtained from all interviewees. All data obtained are confidential.
Results and Discussions
K-Means
We begin by applying K-means clustering to our survey dataset using the features included in the top 5 ranked factors that participants think impact their QOL the most as detailed in the methods section. Then we apply NCvalid to select the final number of clusters. As shown in Figure 2, the index suggests that the first two options are three and eight, respectively. Since three is too broad for the purpose of this analysis, we thus select eight groups.

NCvalid corresponding to the number of clusters.
In Table 3, the overall average scores of QOL factors of each group are shown. Overall, participants ranked finance, job, education, family, and healthcare as having the most influence on one’s QOL. It is not surprising to see finance as the most impactful factor on one’s QOL as money plays a very significant role in everyone’s life today.
Average Scores of Quality of Life Factor in Each Group.
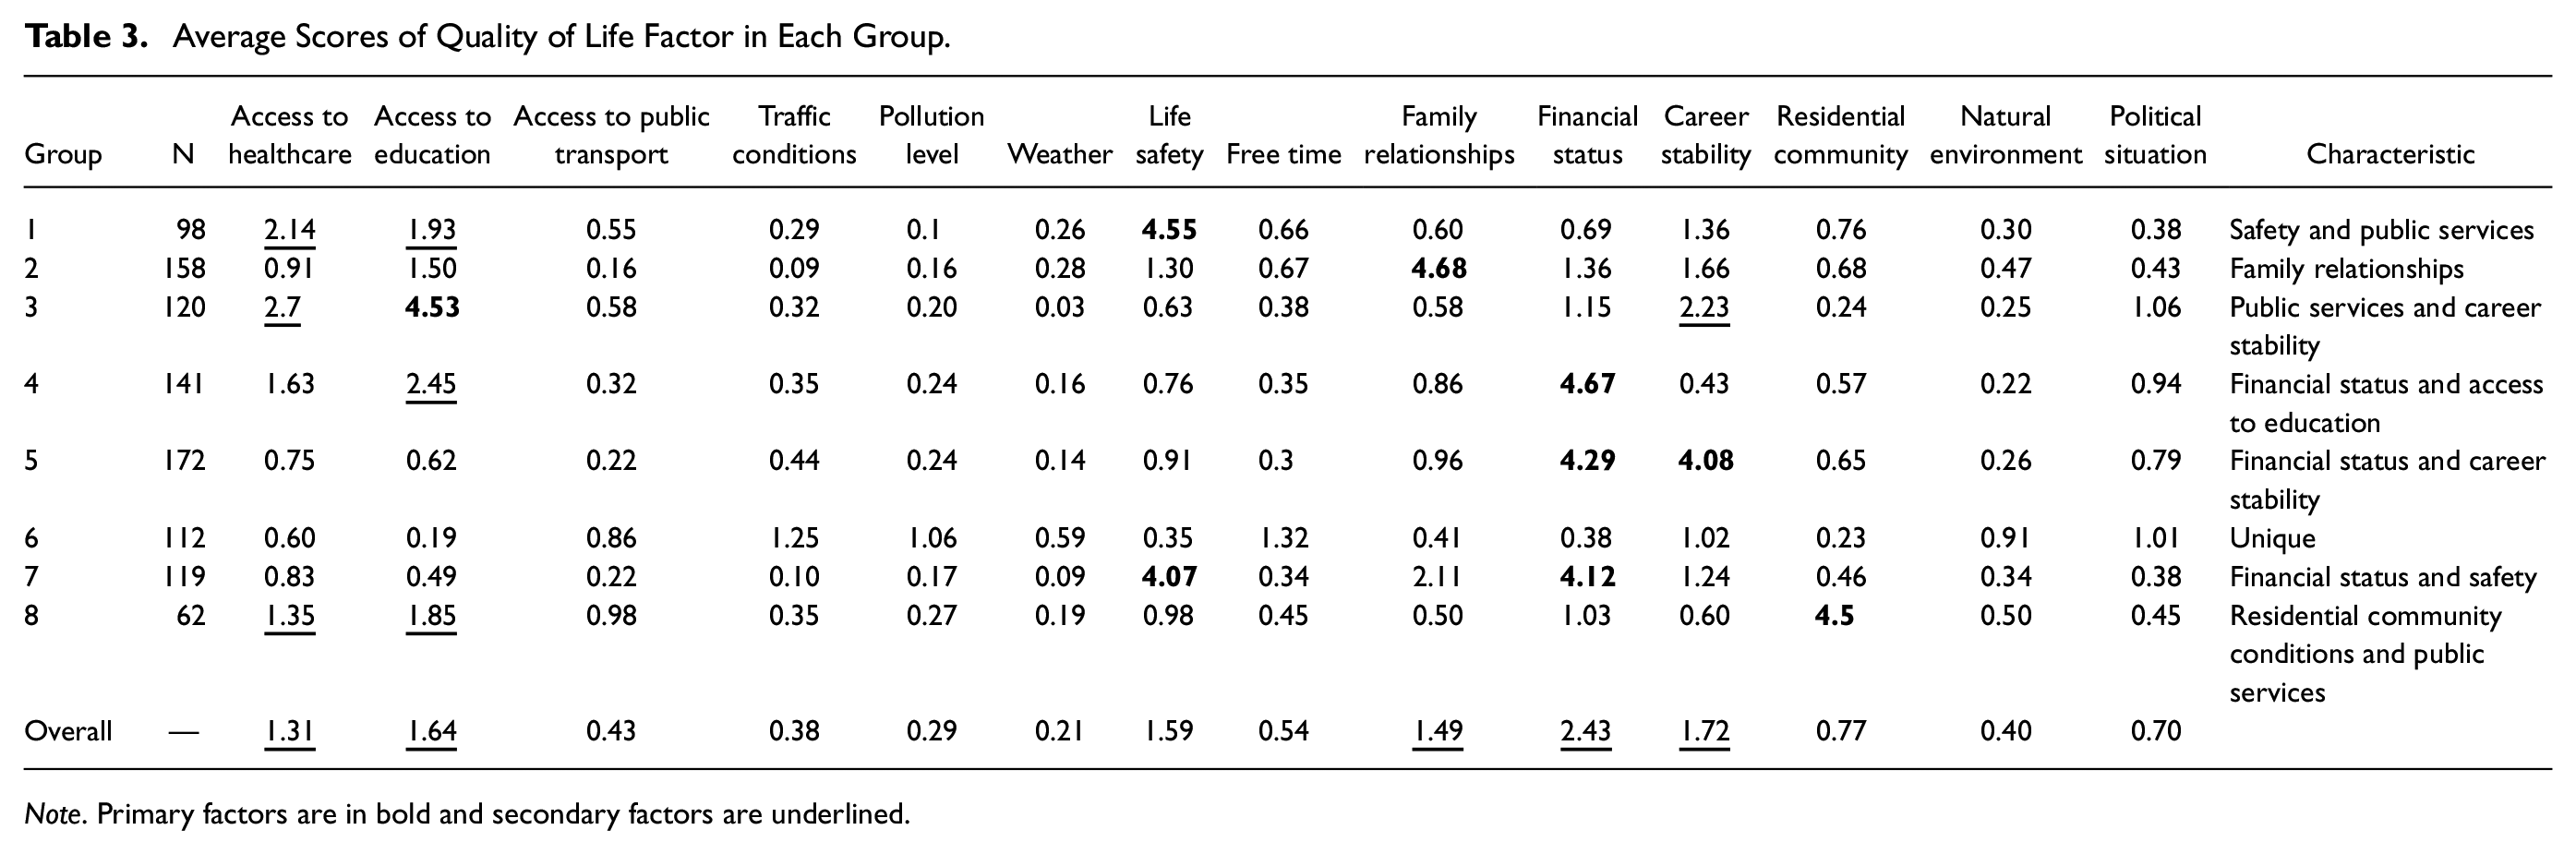
Note. Primary factors are in bold and secondary factors are underlined.
Based on Table 3 and Figure 3 we summarize the characteristics of each group that correspond to the dominant factors represented by that group. The criteria for selecting a dominant factor is if the second rank plus three is less than the first rank, then the first rank is considered the dominant factor for that group. Further, if the third rank plus 0.5 is less than the second rank, then we will not consider the third rank. This led to the creation of eight groups according to the dominant characteristics which are: 1) safety and public services (access to healthcare and education), 2) family relationships, 3) public services (access to education and healthcare) and career stability, 4) financial status and access to education, 5) financial status and career stability, 6) unique, 7) financial status and safety, and 8) residential community conditions and public services (access to education and healthcare).

Average scores of quality of life factors for each group.
In the following section we discuss characteristics of the Thai population that are likely to be present in the described groups. In Table 4 and Figure 4, we delve into the characteristics of each category.
Means of Quantitative Features in Each Group.

Note. Means of monthly income and monthly household income are computed from the midrange of each category.
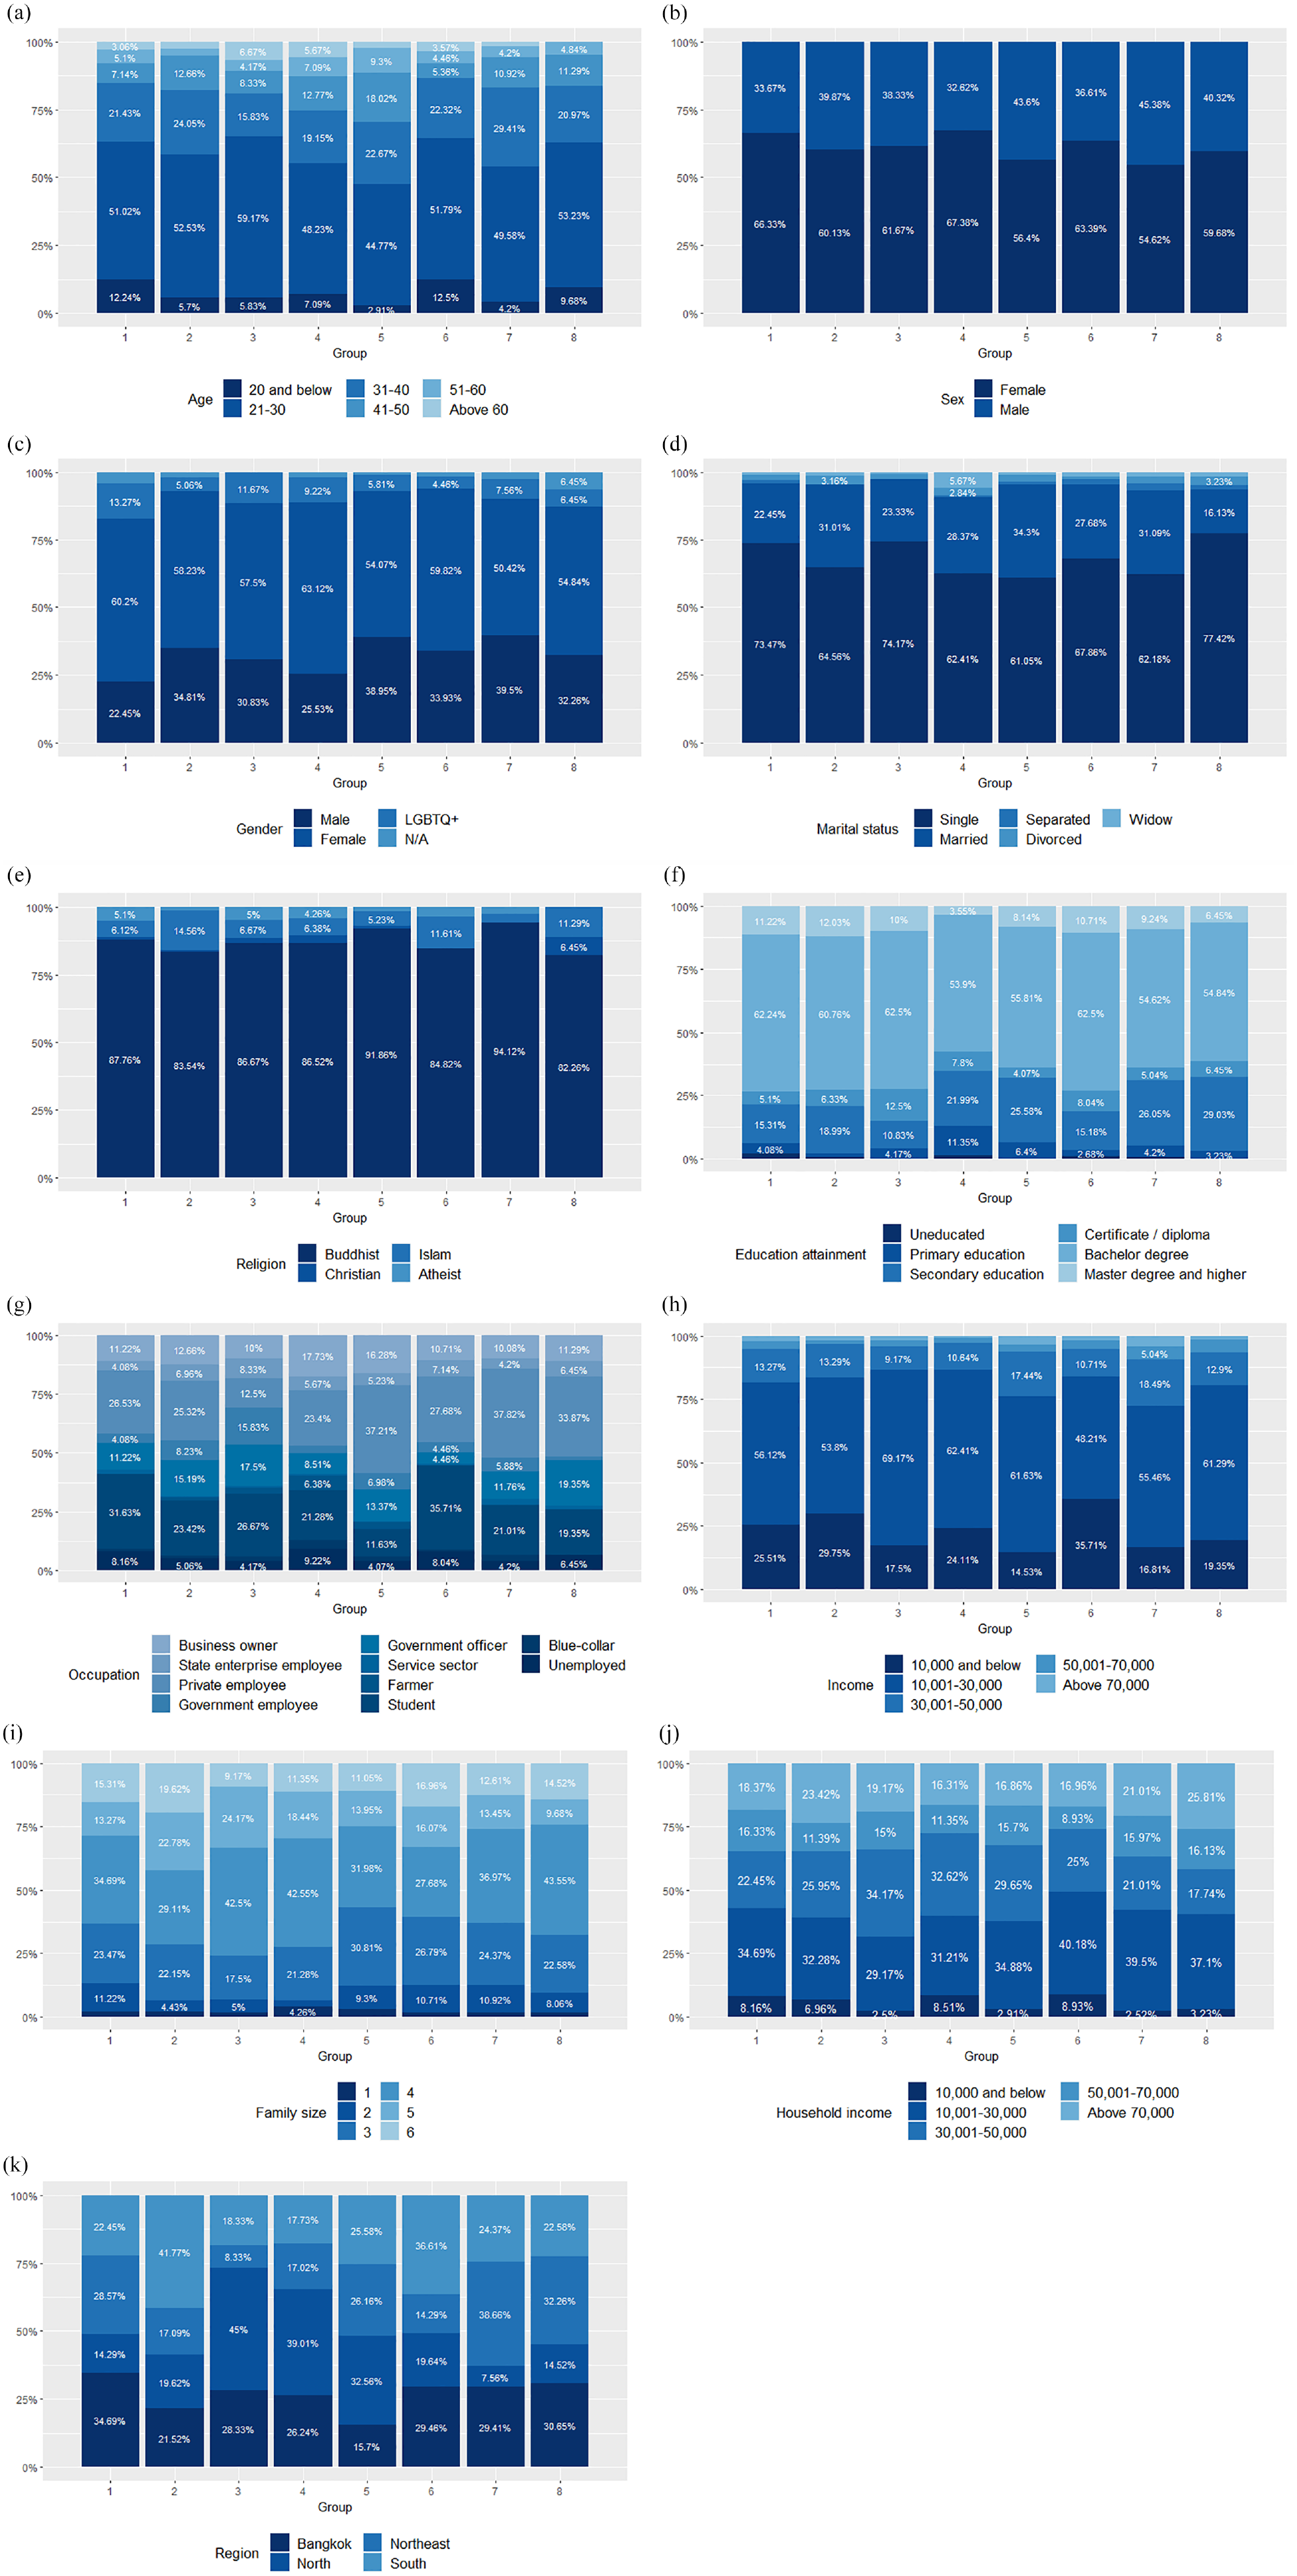
Characteristics of each category group: (a) Age, (b) Sex, (c) Gender, (d) Marital status, (e) Religion, (f) Education attainment, (g) Occupation, (h) Income, (i) Family size, (j) Household income, and (k) Region.
Safety and Public Services (Access to Healthcare and Education)
This group has the youngest average age at 29.99. People with the following characteristics and living in Central Thailand make up a high proportion of this group: LGBTQ+, atheist, student, single, and have a bachelor’s degree. This is not to say that everyone with these characteristics is in this group. Please refer to Figure 4 for details. This group is most dissatisfied with their own QOL (3.11/5) and also gives a low overall score to QOL in Thailand (2.45/5) (Table 4 and Figure 4, panels c, d, e, f, g, and k). Safety in one’s life is of great importance for this group, followed by access to healthcare and education. People in this category view themselves as having low QOL as they perhaps view that Thailand is lacking in terms of safety, and that the current healthcare and education is insufficient. For many, these are the basic human rights (Ghebreyesus, 2017; Mohan, 2003; UNESCO, 2023). For example, Ping, a 31-year-old e-commerce specialist who lives in Bangkok elucidates: First of all, it has to be a safe city. In the past, I didn’t think much about safety…but then I have a family and a kid, I started to think more about safety. I started to think about the future, would I dare let my kid go out often? Because seriously, our city is scary. It has many dangerous components.
When asked what he means when referring to the city as dangerous, he cites the traffic conditions, crime rates, and the lack of law enforcement, especially for powerful and wealthy people who escape punishment when they commit a crime. Other respondents cite the lack of/unsafe sidewalks, unsafe construction sites, and overall feeling unsafe about one’s life and property.
Jongudomkarn and Camfield (2006) pointed out that the social security system in Thailand does not sufficiently ensure the well-being of Thai people and many people have difficulties accessing government agencies. Even when they succeed in accessing government agencies, the services are often of dubious quality. Although it has been almost two decades since Jongudomkarn and Camfield’s (2006) study, many of the interviewees’ comments echo the ineffectiveness reported in their study of Thai healthcare.
Chai, a 25-year-old temporary government agency worker who lives in Mae Hong Son explains the sense of insecurity felt by many Thais in terms of healthcare: “Life after retirement, I think there’s nothing guaranteed…An allowance of a few hundred baht isn’t enough to cover the cost of living, and the medical treatments need to be improved.” Currently, old age allowance is given to all Thai citizens who are 60 years and above and do not receive welfare or other benefits from the government, state enterprises, or local government organizations. Thai elderly are given 600, 700, 800, and 1,000 baht if they are 60–69, 70–79, 80–89, and 90 and above, respectively (Department of Older Persons, 2021).
It is well-known among Thai residents that if you have money you can go to private hospitals for better health services. Long waiting time is the main reason for outpatient care’s dissatisfaction (Vongmongkol et al., 2021). Tarn, a 31-year-old independent researcher living in Bangkok explains why she now goes only to private hospitals: In the past, I went to the Somdet Chaopraya Institute of Psychiatry. So let’s say the doctor’s appointment is at 9 a.m. I have to leave to go to that hospital at 5.30 a.m. to get the queue card…So, even if the appointment is at 9 a.m., I’ll get to see the doctor at 10 or 11 a.m….The medicine is really cheap but the time spent on the whole process is not conducive for people to use the service. There’s no service mind. It’s like we’re getting a free service.
In addition, education is intrinsically important for this group. Most believe that a good education affects one’s QOL. Jiab, a 62-year-old woman who sells handmade windmills at a beach in Songkhla only completed the first year of primary education as her parents did not see the importance of education. She has a monthly income of 1,500 baht. This is below the poverty level. In 2021, the poverty line for Thailand is at 2,803 baht per month per person (Office of the National Economic and Social Development Council, 2021). Her main diet is sticky rice. She equates one’s QOL with education: Less educated people earn less. Educated people earn more…Uneducated people work at construction sites and earn less. Educated people, they have knowledge and can do any work. I didn’t receive much education so I do this job, and I have little income on which to get by.
Not everyone receives the education they want. Kung, a 20-year-old college student explains his situation: “In the past, I wanted to be an artist, not just drawing but also a singer. But studying music requires a lot of money…, like piano lessons,…those are not cheap. My family didn’t have that kind of money so I put my dreams aside. I have to work to pay for my tuition.” Kung, despite having many artistic talents, cannot pursue his dream but instead chooses to study in a field that has more affordable tuition.
Many people try to obtain high education as educational attainment has great impacts on one’s life. Wit, a 38-year-old private company employee with a master’s degree who makes 720,000 baht per year and is originally from Lampang and now lives in Bangkok, attributes his education to his good QOL: In my parent’s generation, there were limits as to what they could do. My dad’s a farmer, my mom’s a laborer. They couldn’t prepare anything for their children. I had to make my own decisions since I finished sixth grade. I almost didn’t get to study, but I tried and eventually I succeeded.
Family Relationships
This group equates QOL principally to family relationships. This agrees with previous research (e.g., Jongudomkarn & Camfield, 2006; Senasu & Singhapakdi, 2018). Many respondents claim that a happy life is based on good family relationships. This group has the highest family monthly income (52,437 baht on average); however, this group also has the largest family size at 4.36 persons per family on average (Table 4). High proportions of respondents in this group have attained graduate degree-level education, live in the Southern region, and are part of the Islamic religion (Figure 4, panels e, f, and k). Family relationships have a significant impact on one’s emotional well-being and physical life (Thomas et al., 2017). Dao, a 22-year-old who works as a tutor in Bangkok explains: Before my parents split up, everything was splendid. I was one of those people who, if they want something, will get it right away…I had a very good QOL…A good environment, company, school, home, everything was good… But once my parents separated….There were court proceedings. Everything got worse…. Things changed completely.
Since freshman, she had to work to support herself and pay her own college tuition which amounts to 45,000 baht per semester. In addition, having a high income means that everyone in the family can be provided for hence a better relationship. Yet, having a large size family is less advantageous as dilution of resources will occur (Rosalyn P & Dovina T, 2019).
Public Services (Access to Education and Healthcare) and Career Stability
Education is an important component of QOL and has widespread implications on an individual’s life. Both formal education (e.g., literacy, numeracy, and other skills) and non-formal education (e.g., culturalization and socialization processes) are essential contributors to QOL (Edgerton et al., 2012; United Nations, 1995). Health, as mentioned previously, is a crucial feature of the QOL. Being in good health means that the individual can work, support themselves and their families, contribute to society, and can enjoy recreational and cultural opportunities (van Leeuwen et al., 2019; United Nations, 1995).
This group has an average monthly family earning of 52,125 baht. People with the following characteristics make up a significant proportion of this group: diploma-level or bachelor’s degree-level education, state enterprise employee, government employee, government officer, single, live in the Northern region, and are atheist. This group ranked the COVID-19 pandemic as a crucial factor impacting their QOL (4.28/5). This group views QOL and inequality as being closely related (4.28/5) (Table 4 and Figure 4, panels d, e, f, g, and k). Kantachote (2013) shows that in Thailand educational disparity occurs between urban and rural areas. This still is true. Prang, a 19-year-old college student who works part-time as a waitress in Songkhla explains: Children in the city receive good education…, well better than children in the three southern provinces. Children in the three provinces end up at a vocational school. The children in the city go to a regular school because their parents can afford it. Those kids then go to college.
Indeed, it is not unheard of for children from rural areas to commute hours on a daily basis to urban areas for education and for students to migrate to Bangkok to pursue a bachelor’s degree at well-known universities.
COVID-19 pandemic caused many poor people to drop out from education. Boy, a 26-year-old teacher in Khon Kaen, explains: After COVID-19 arrived, rich kids’ parents could buy iPads (for online classes), had time for their children, and hire a tutor. Kids from well-to-do families didn’t lose out as much in learning…Kids with no money, when the school closed due to COVID-19, stayed home and helped their parents (by working)…They didn’t have money to buy an iPad, their phones have no internet, and some don’t have a phone. Their education stopped.
Nui, a 62-year-old small food stall owner in Bangkok, describes her daughter’s experience of online education as insufficient. She explains, “They switched to online studying but the tuition fee is still the same. My daughter didn’t understand the content so she proposed taking a semester off. She said we are losing money, but the quality of the education is not as good as before the pandemic.”
COVID-19 not only expanded the educational gap between the rich and the poor but it also exacerbated inequalities in Thailand’s healthcare system. Many respondents report how people with money are able to book an mRNA vaccine and can stay at a good hospital and receive medication if they contact COVID-19, whereas the poor have to wait for free vaccine and isolate at home or go to field hospitals which are not as hygienic and have fewer medical supplies. Indeed, many reported losing their loved one due to limited access to healthcare and medical treatment.
Apart from access to public services, career stability is also important for this group. It is thus understandable as to why this group has a high proportion of state enterprise employee, government employee, and government officer as those who seek secure employment will opt for a public sector rather than a private one (Chandoevwit, 2011). Further, finding a good stable career for many Thais means migrating from the outer provinces to the capital city of Bangkok. This trend is not new; indeed, it has been so ever since the 1970s (Goldstein & Goldstein, 1987). According to the interviewees, there are more job opportunities in Bangkok with higher salaries compared to other provinces. For many, career stability is more important than fulfilling their passion. Ping, a 31-year-old e-commerce specialist in Bangkok has a great passion for public transportation, yet chose to work as an e-commerce specialist. He explains: I know that I like this thing (riding a motorcycle, driving a taxi and a public bus) but this profession cannot meet my income requirements. Also, I like that I have fun at my full-time job and can progress on my career path. So yes, the career path is crucial.
Social inequality in Thailand has always existed but COVID-19 made it even more visible. Many people, especially merchants and unskilled laborers, such as waiters and construction workers, went without pay during the pandemic. Book, a 24-year-old officer worker who lives in Chiangmai comments, “There used to be a campaign that said ‘Stop germs for the nation by staying at home.’ For those who work and receive a daily wage, it’s impossible for them to stay at home. At that time, there’s social blaming if someone did not stay home: why must they go out and risk spreading the virus?” The government campaign thus creates an impossible scenario for many families, especially those with low incomes.
Career instability did not affect only those in the service sector and blue-collar workers, private-sector workers were also asked to take leave without pay or reduce their working hours as business operations slowed down. Most government officials, luckily, can rely on their paychecks coming in at the end of the month. Yet, this does not mean that the QOL of government officials is the same, as some must help support the rest of their family. Boy, a 26-year-old teacher explains, “The pandemic affected my family a lot, my dad, mom, siblings, relatives, some became unemployed, some had an unstable income. Then it circles back to me because I have to help out with whatever they are lacking.”
Financial Status and Access to Education
Individuals who make up this category value financial status the most, followed by access to education. This group has the lowest average monthly income (18,901 baht) and lowest average family monthly income (44,645 baht) (Table 4). People with the following characteristics make up this group: female, widow, have primary-level education, business owner, farmer, blue-collar worker, unemployed, and live in the north (Figure 4, panels b, d, f, g, and k). Perhaps people in this category wish to earn more because they have low incomes and did not obtain the education they wanted. Poverty often leads to low QOL (Kuznetsova et al., 2021; United Nations, 1995). Therefore, this group may base their QOL on how much money they have. Furthermore, higher education levels lead to jobs with higher salaries, which might explain why people in this group value access to education.
Money and wealth are directly linked with well-being and money can buy modern conveniences to make life easier, for example, electrical appliances and private transportation. Without enough money for daily expenses, many people go into debt. Being in debt has a tremendous effect on people’s physical and mental health. Finally, having money means that one can take the opportunity to retire (Fay, 2023; Jongudomkarn & Camfield, 2006).
An individual’s financial status impacts how they live. Wit, a 38-year-old private company employee with a monthly salary of 60,000 baht, points out: In the same market, different people have different perspectives…In the past, I chose quantity. I want lots of rice so I’ll be full. So one or two plates of rice with one side dish…It’s different now (that I have money), now in a meal I can have three side dishes and home-cooked rice…Now I don’t focus on just being full but I can enjoy eating…100 baht is different for each person. I may use mine to buy a cup of coffee, but some may use it to feed two or three people.
Many people aspire to be wealthier as people who are from wealthy families have the support and opportunity that a poor family does not. This is especially crucial in relation to the spread of COVID-19. Fah, a 32-year-old staff member at a government agency in Chiangmai, explains: People with money aren’t affected by this situation as much…For me, when I want to do something, there’s always some limitations. People with wealthy parents, when they want to do something, they’ll have support…. I’m not from a wealthy family. Even though my parents support me emotionally but if I fail, I’ve to start from zero. It’s discouraging. For people with financial means, when they fall, they fall onto a futon…they recover faster.
This finding concurs with the reports of Allen and Rebillard (2021) and Miranda (2020). Many people believe that COVID-19 impacts their family’s financial stability. Many have to use money more thriftily, many pull out their savings to survive, and most reduce unnecessary expenses and save the money for utilities, rent, and food. Several people work second jobs to bring in enough income.
Moreover, COVID-19 increases the divide between the rich and the poor, making it ever more present. Some people shame the poor for not staying at home and not wearing masks when they leave home. For the poor, it is not a choice to stay home as they must go out and work in order to have an income. Middle and upper-class people can obtain masks and sanitizer, however, that is not always the case for the poor. At one point, a box of 50 facial masks cost up to 800 baht; the minimum wage per day in Thailand ranges from 328 to 354 baht depending on which province you work in (Ministry of Labor, 2022).
Financial Status and Career Stability
People in this group feel that both financial status and career stability significantly impact QOL. Financial status and career stability go hand in hand. If a person loses their job, they will no longer be financially stable. This implies that the members of this group base QOL on the ability to make money from a secure career. This group has the highest average age at 34.91 and smallest family size (3.78). This group has an average income of 24,564 baht per month. People with the following characteristics make up this group: male, married, business owner, private company employee, and have secondary-level education. This group is most satisfied with their own QOL (3.55/5). Furthermore, this group ranks the overall QOL in Thailand the highest (2.98/5). Yet, this group has the least faith in the government’s ability to improve the QOL of its citizens (1.97/5) (Table 4 and Figure 4, panels b, d, f, and g).
Working life has important implications for QOL as it allows for self-fulfillment through personal development and social mobility. As most adults spend a great deal of time at work, the quality of their job and working environment undeniably have a fundamental impact on their lives (Senasu & Singhapakdi, 2018; United Nations, 1995). Career stability is important to this group. Jib, a 32-year-old professor in Bangkok says she feels insecure about her job as the university can choose not to renew her contract if her performance is poor: The work requirement is teaching and research…So you need to conduct research twice a year. I feel that it’s too much for anyone who has just started working. I mean I can do it, but it’s overwhelming…Everything looks good (to the outsiders). I don’t have to go to the office; I only go in on Thursdays. Even though I don’t have to go in, there’s a framework that pushes me at all times to keep up. So I work continuously.
Unique
There are no standout factors for this group. Each member of this group ranked the QOL factors differently when compared to other groups. For example, some respondents rank free time, traffic conditions, political situations, pollution levels, and natural environment as the top factors. Therefore, the respondents who rank factors uniquely are grouped together. We may say that this group is an outlier. This group views that QOL and inequality are least related (3.99/5) (Table 4 and Figure 4, panels e, f, g, and k).
Traffic congestion and pollution are on the increase in urban areas like Bangkok. Many people in Bangkok spend two to four hours per day commuting between home and work (United Nations, 1995). Ping, a 31-year-old e-commerce specialist who lives in Bangkok explains, “In Bangkok, traffic jams are very bad. When the light turns green, people want to go. The flow follows, then people run through the red light. If you’re stuck at another red light it could be 5 or 10 minutes…Once people are out of that red light, they try to make up for the lost time by rushing.”
Traffic jams in Bangkok mean people have less time to spend with their loved ones and on activities that they like. Also, traffic jams lead to air pollution which can lead to respiratory diseases. Bangkok is also known for constructing new buildings and renovating old ones, which leads to high levels of dust, and during the cold season, fine particulate matter (PM2.5) is quite common. For this reason, many interviewees choose to live in cities other than Bangkok. Many people plan on migrating back to rural areas once they retire for better quality of life.
While Leelakulthanit and Day’s (1992) study shows that Thais are “neither pleased nor displeased” with the Bangkok administration, the Thai government, and life in Thailand, our study shows otherwise. Many interviewees attribute a bad QOL in Thailand to politicians who corrupt and make false promises instead of putting money into projects that are helpful to the citizens. Meng, a 59-year-old state enterprise employee summarizes the situation as follows: The lives of the rich and the poor are very different. In the news, rich people kill someone without going to jail but poor people (trespass) looking for mushrooms are put in prison. The inequality is right here. The law is not strictly enforced and fair to everyone.…The government/politicians do not dare pass laws that will hurt themselves. That’s why there’s so much corruption.
Government officers, such as police, are often cited as one form of corruption. Police often take bribes from citizens in an exchange for dropping a charge and collect tributes. Kaew, a 24-year-old tattoo artist, explains that it is quite common for police to come in once a month to collect tributes as they claim that the tattoo business is a shady business. This scenario is not new and has been an ongoing problem as was documented by Trimek (2014). Indeed, in Table 4, for all eight groups, Thai citizens have more faith in the private sector than in the government for supporting their QOL.
Financial Status and Safety
Financial status is a dominant factor, followed by feeling safe in life. This group has the highest average monthly salary (26,933 baht). People with the following characteristics make up a substantial part of this group: male, married, separated from a spouse, live in the Northeast region, private company employee, service sector worker, and Buddhist. The individuals of this group, while somewhat satisfied with their own QOL (3.13/5), are very dissatisfied with the overall QOL in Thailand (2.44/5). Interestingly, all groups rate their own satisfaction toward their own QOL higher than that of the country’s QOL. In fact, this group has the least faith in the private sector’s ability to improve the QOL of Thai citizens (2.74/5) (Table 4 and Figure 4, panels b, d, e, g, and k). For a detailed discussion of financial status, refer to pages 22-24 of the previous section, and for safety please refer to page 14-15.
Residential Community Conditions and Public Services (Access to Education and Healthcare)
This group defines QOL primarily based on the neighborhood environment in which they live. The physical environment includes both the built environment (e.g., infrastructure) and the natural environment. Unfortunately, infrastructure investment is usually concentrated in more affluent areas in cities (Archer, 2021; United Nations, 1995). People with the following characteristics make up a high proportion of this group: single, divorced, secondary level education, government officer, live in central and northeast regions, Christian, and Islamic. This group is least likely to view that their QOL is affected by the COVID-19 pandemic (3.81/5), although, the number is still high (Table 4 and Figure 4, panels d, e, f, g, and k).
This research agrees with the previous research (e.g., Gomez et al., 2020; Zhang et al., 2020) that a person’s neighborhood environment impacts one QOL. Ping, a 31-year-old e-commerce specialist who lives in Bangkok, explains: If we’ve a low income, we can’t find good housing…When I was younger and was working as a bus ticket boy I rented a room with my friends. It’s 900 baht per month. The four of us lived together. It’s a room made from pieces of wood that were falling out and was located above a fish pond.…When there’s a flood, we had to wade out to go to work…We had to wait for public transport and there’re not many options.
This indicates that living in a good neighborhood requires money to pay for the rent. The secondary factors are access to education and access to healthcare. This group has the highest faith in the government (2.73/5) and the private sector (3.27/5) as having the ability to improve the QOL of Thailand’s citizens. Yet, interestingly, faith in the private sector is much higher than that of the government (Table 4). For a detailed discussion of public services, refer to pages 15–20.
XGBoost
In this study, we tune three parameters using 10-fold cross-validation: cutoff probability (CP), learning rate (LR), and maximum depth (MD). The final parameters selected, and their corresponding accuracies, true positive, and true negative rates are shown in Table 5.
Accuracy and Parameter Table.

Note. TPR, TNR, CP, LR, and MD are true positive rate, true negative rate, cutoff probability, learning rate, and maximum depth, respectively.
After tuning the parameters, we apply XGBoost to predict self-evaluated QOL (good/not good) using 15 features stated in the methods section. The 10-fold accuracy for each group is shown in Table 6. The overall 10-fold accuracy is 72.96 percent. In the same table, the features that affect self-evaluated QOL the most in each group are ranked. The top seven features that affect this the most are QOL in Thailand, age, occupation, monthly household income, region, and private sector’s and government sector’s ability to improve the QOL for Thai people. The factor QOL in Thailand dominates over the other features in three of the groups: 3, 5, and 6. This means that people who value education, health, career stability, and financial status have the tendency to think that one’s quality of life is directly impacted by the overall QOL in Thailand.
Ranking.

Note. Primary features are in bold, secondary features are underlined, and tertiary features are italicized.
QOL in Thailand and age dominate over others in the 4th group (financial status and access to education). Here, we come to a similar conclusion as for the three groups mentioned above. However, as money plays a very significant role in this group and income tends to be increasing, age is an additional relative factor.
Though no features dominate in the remaining groups, age plays the most important role in the 1st, 7th, and 8th groups (safety and public services, financial status and safety, and residential community conditions and public services). This implies that people belonging to different generations have different perspectives on safety and public services in Thailand.
For the family relationship group (group 2), there is no feature that dominates others. The most important ones are QOL in Thailand, monthly household income, and the government sector. We might say that people in this group have slower lifestyles and seem to rely on how much the whole family gains and how the government supports them.
Conclusion
Thailand has a real GDP per capita of US$17,300, and while this is much higher than neighboring countries (Central Intelligence Agency, 2022), the QOL of the Thai population varies tremendously as wealth and assets are often concentrated among the rich. Using surveys and in-depth interviews of Thai people throughout Thailand, this study examines the factors that Thai citizens consider affect their QOL.
While many scholars have studied the QOL in Thailand, most only cover certain parts of Thailand (Jongudomkarn & Camfield, 2006; Kittipichai et al., 2015; Sirisuwan et al., 2021; Sittironnarit et al., 2020; Sudnongbua et al., 2010) with particular age groups (Rojnueangnit et al., 2020; Sirisuwan et al., 2021; Somrongthong et al., 2017; Thavorncharoensap et al., 2010) and in certain occupations (Kittipichai et al., 2015; Sittironnarit et al., 2020; Vutyavanich et al., 2007). Most research focuses on health-related QOL (Glangkarn et al., 2011; Thavorncharoensap et al., 2010; Wichit et al., 2017). Our research advances the literature by studying the QOL in Thailand from people of all ages with different occupations from all regions.
Furthermore, studies on the QOL in Thailand tend to be either qualitative or quantitative (e.g., Jongudomkarn & Camfield, 2006; Kittipichai et al., 2015; Saladyanant et al., 2021; Vutyavanich et al., 2007), though there are exceptions (e.g., Mormon et al., 2021; Pheap & Sripokangkul, 2017). Our study considers quality of life from multiple dimensions using both quantitative and qualitative methods. We account for variation in the QOL of individuals within geographic segments using not only objective measures but also subjective measures of QOL to capture the differences.
One key difference from previous research is that for the quantitative analysis, we use both supervised and unsupervised machine learning, XGBoost and K-means clustering equipped with NCvalid, respectively, to analyze our data. To our knowledge, unsupervised learning methods have not been used to study inequalities in the QOL in Thailand. K-means allows us to cluster the respondents into different groups that share some similar characteristics. XGBoost lets us understand how the respondents rank the factors that affect their QOL the most. Using XGBoost, we are able to achieve the ambitious goal of understanding self-evaluated QOL (good/not good) using 15 features with an overall 10-fold accuracy of 72.96 percent. For the qualitative analysis, we use in-depth interviews with 120 Thai citizens. The interviews are used to support the quantitative analysis and allow us to better understand individuals’ perspectives relating to how they perceive each factor as impacting their QOL.
The practical implication which makes this research valuable is that it allows policymakers such as the Thai government to have a better understanding of the Thai citizens’ perception on important factors that affect their QOL. Policymakers can therefore use the results of this study to develop tools and form appropriate policies that will help improve Thai citizens’ quality of life. Doing so, the Thai government can prevent the brain-drain situation as when citizens are satisfied with their country of origin it is less likely that they want to migrate to another country. Further, this will allow Thailand to attract talented expatriates from other countries who can contribute economically and socially to develop the country.
An important step for future research is to collect more country-wide data and incorporate more variables as different cultures may perceive different factors as affecting their QOL. Furthermore, other clustering methods such as fuzzy c-means and DBSCAN could be applied as they have an additional benefit of spotting outliers. It would also be interesting to apply the Bayesian concept to this research since there are some intuitions behind each society that would allow for assigning a prior distribution for Bayesian analysis.
Footnotes
Declaration of Conflicting Interests
The author(s) declared no potential conflicts of interest with respect to the research, authorship, and/or publication of this article.
Funding
The author(s) disclosed receipt of the following financial support for the research, authorship, and/or publication of this article: This research was financially supported by the Office of the Permanent Secretary, Ministry of Higher Education, Science, Research and Innovation, Thailand (Grant number: RGNS 63-217).
IRB approval
This research has IRB approvals, the certification IDs are SWUEC/E-346/2564 and KMUTT-IRB-COE-2022-035.
IRB Statement
The Institutional Review Boards of Srinakharinwirot University and King Mongkut’s University of Technology Thonburi have approved this research (SWUEC/E-346/2564 and KMUTTIRB-COE-2022-035).
Data Availability Statement
Data sharing not applicable to this article as no datasets were generated or analyzed during the current study.