
Abstract
Consumers are becoming more health conscious. Increasingly, products that are labeled “healthy” are being marketed as new retailers and new brands vie for the consumers’ share of wallet. This research identifies the self-image factors that constitute a health conscious image of the self and examines how self-image impacts consumer buying of foods that are labeled healthy. It also makes an effort to find out whether specific self-image factors are significantly associated with demographics. This study employs a scale consisting of 15 statements that included four statements from the Health Consciousness scale developed by Gould. The psychometric properties of the scale used in the study are reported. The study uses factor analysis to identify five factors of consumer self-image as they relate to health consciousness. Furthermore, the study explores the relationship between demographics such as age, gender, education, and relationship status with the self-image factors and reports results for consumer preferences for choosing healthy foods when hungry. This research has important implications for marketers in the health food industry and for such other companies that might use consumer health consciousness as a basis for market segmentation and strategy design.
Keywords
Introduction
Self-concept or image consists of the “totality of thoughts and feelings having reference to him/herself as an object.” It is composed of attitudes one holds toward oneself; (Mothersbaugh & Hawkins, 2016) and includes four parts: Who I am now (actual self-concept), who I would like to be (ideal self-concept), how I would like to be to myself (private self-concept), and how I would like to be seen by others (social self-concept). Years of consumer research have confirmed an intimate connection between identity and consumption behavior (Weiss & Johar, 2013; White & Argo, 2009). Products help to define and maintain consumers’ self-concept by reinforcing their identities (Berger & Ward, 2010; Birdwell, 1968; Gao et al., 2008; Ward & Broniarczyk, 2011). Brands are important to consumers for their functional benefits and their symbolic meaning. They help them in portraying their self-image and how others perceive them (Elliott, 1997; Levy, 1959; McCracken, 1986). While product consumption symbolizes personal attributes, motivations, and social patterns, symbolic consumption reflects the personality and lifestyle of consumers, helping in expressing social distinctions (Sirgy, 1982). Consumers express their identities by choosing brands whose images are perceived to be similar to their own self-images (Aaker, 1999; Kassarjian, 1971; Sirgy, 1982). In fact, consuming products inconsistent with an important identity sometimes causes cognitive dissonance, motivating consumers to sometimes cease consuming the less identity-consistent product (Berger & Heath, 2008), leading them to seek out and consume products that are more identity consistent (Ward & Broniarczyk, 2011).
Health consciousness assesses the degree to which a person plays an active role in maintaining his or her health. It is a motivational component encouraging consumers to enhance or sustain their physical well-being by engaging in preventive behaviors and health care (Jayanti & Burns, 1998; Michaelidou & Hassan, 2008). Health conscious consumers purposively monitor their state of health and perform required actions to improve or maintain it (Gould, 1988; Michaelidou & Hassan, 2008)
Food is both privately and socially consumed and is an important part of consumers’ buying decisions. In recent decades, consumption of fast food and food away from home has increased in the United States (Krieger et al., 2013). According to Poti and Popkin (2011) and Powell et al. (2012), in 2007 to 2008, fast-food and full-service restaurants accounted for an estimated per day consumption of 275 kilocalories (kcal) among children, 564 kcal among adolescents, and 599 kcal among adults amounting to energy intake of 14% for children and 24% of total energy for adolescents and adults. Healthy diet helps to prevent type 2 diabetes, obesity, cardiovascular disease, and certain cancers (Centers for Disease Control and Prevention, 2012). The direct costs of diet-related diseases account for an enormous proportion of the total health expenditures in the world—diabetes mellitus type 2 alone accounts for 11% of the total costs worldwide (International Diabetes Federation, 2013). The type of food consumed is, therefore, likely to influence money spent on health care.
Eating healthy also gets a lot of publicity as it is seen as a panacea for curing obesity. Media has played a crucial role in highlighting obesity and its ill effects on both short-term and long-term enjoyment of life. Public policy makers have, therefore, aimed to foster healthy food choices (e.g., fruits, vegetables) and reduce consumption of unhealthy food. The social marketing campaigns urge people to consume fruits and vegetables and avoid fast food and sugary drinks in large sizes to contain high expenditures on health care. Media has also highlighted the irresponsible practices of the food business that have caused harm to health.
Consuming healthy food is seeing an upsurge not only in the United States but all around the world. It has, therefore, become “cool” to be seen as being a health conscious consumer. Since the late 1970s, nutrition-related behaviors have emerged as consumers’ most frequent activity to stay healthy (Harris & Guten, 1979; Ostberg, 2003). Research has also recognized “interest in health” as a key motive in the purchase of organic food (Grankvist & Biel, 2001; Lockie et al., 2004; Michaelidou & Hassan, 2008). Marketers are responding to these changed preferences by increasingly selling products labeled “healthy.” Food retailers and manufacturers also eagerly position themselves as health friendly to target health-conscious consumers (Leeflang & Van Raaij, 1995; Prasad et al., 2008).
Cornish (2012) classified healthy foods into nutritionally rich and nutritionally poor functional foods. His study revealed that although a number of functional foods (e.g., probiotic yoghurts, cholesterol-lowering spreads) are proven to provide genuine health benefits and have become a staple of the modern diet (Nestle, 2007), some other functional foods (e.g., low-fat cookies, zinc-fortified breakfast cereals), although fortified, lack real nutritive value (Pollan, 2009; Urala & Lähteenmäki, 2003) and provide no real health benefits (Nestle, 2007). Food choice theories suggest that consumers are more likely to be swayed by nutritional beliefs and labels than actual nutritional quality, at times making wrong choices.
It is, therefore, pertinent to understand whether only the consumers with a “health conscious” self-image would consume healthy labeled foods. The present study has been conceived to address this question. The following paragraphs summarize the extant literature in the area.
Literature Review
The survey of literature focused on self-image, self-concept, health orientation/consciousness, nutrition labeling, and healthy/organic foods consumption for identifying relevant studies.
Past research has established that self-concept influences a variety of consumer behavior decisions including choice of office decor (Gosling et al., 2002), brand preference (Escalas & Bettman, 2003), and choice of accessories (Berger & Ward, 2010). Identity-consistent products are consumed not only as a signal to others but also as signals to the self (Gosling et al., 2002; Shrum et al., 2013). Individuals have a need for coherence, meaning, and control (Heine et al., 2006; Swann, 1983; Swann & Bosson, 2010), and for this reason, they seek out products that provide feedback consistent with their self-concept. A consumer’s sense of self influences preferences for products that help maintain their self-concept (Ball & Tasaki, 1992; Oyserman, 2009). Consumers also utilize product choice to offset dissonance-arousing self-concept threats encountered in the environment (Rucker & Galinsky, 2008; Sivanathan & Pettit, 2010).
Consumers choose those brands that are harmonious with their personality and self-image (Ericksen, 1996; Graeff, 1996; Mehta, 1999; Sirgy, 1982; Sirgy et al., 1997; Sirgy et al., 1991) and psychologically compare their self-images with the stereotypical user of a brand (Sirgy, 1982). The interaction between the image of the product user in various media and consumer’s self-concept results in the consumer striving for self-image congruence (Sirgy et al., 1997), an important predictor of consumer behavior (Sirgy, 1982; Sirgy et al., 1997). Research has also shown that self-image congruence affects customers’ brand preferences and their purchase intentions (Ericksen, 1996; Mehta, 1999), facilitating the creation of positive attitudes and behavior toward brands (Ericksen, 1996; Sirgy, 1982, 1985; Sirgy, Grewal, & Mangleburg, 2000; Sirgy et al., 1997; Sirgy et al., 1991). According to Graeff (1996), self-image is positively related to customers’ product evaluations and triggers motives that create the need for self-consistency and self-esteem. However, there is a difference in the brand images of socially (e.g., conspicuous consumption) and privately consumed brands and, hence, the effects of self-image congruence are likely to be stronger for publicly consumed products (e.g., automobiles and jeans). Hume and Mills (2013) found that self-esteem and self-image also influenced private purchases such as intimate women’s apparel and fashion.
Due to interplay of factors such as price, income, product life cycle, consumer involvement, product utility and value, image congruence does not always materialize (Onkvisit & Shaw, 1987). Individuals can vary in the degree or level (high or low) of self-image congruence experienced by them. The extent to which self-concept is activated in a given context can also moderate the effect of self-image congruence on certain consumer behavior. Khan and Dhar (2006) showed that one instance of bolstering one’s self-concept through a virtuous action could increase the likelihood of choosing a luxury over a necessity in a subsequent unrelated choice.
Studies have also been conducted on self-image congruence and specific brands. Jamal and Al-Marri (2007) explored the impact of self-image congruence and brand preference on brand satisfaction among expert and novice customers of automobile brands. Bosnjak and Brand (2008) regressed consumption-related attitudes and intentions of Chevrolet car on participants’ perceived match between their self-concept and different positive and negative image facets.
Organic foods are purchased more due to perceived health benefits than their environmental benefits (Hughner et al., 2007; Shafie & Rennie, 2012; Yiridoe et al., 2005). Although children could increase their parents’ health conscious choices (Prasad et al., 2008), they could also increase their purchases of indulgent snack foods (Marshall et al., 2007). Health (and diet) concerns could shift the way shoppers approached indulgences and/or influenced their perceptions of which categories constituted indulgences. Mazar and Zhong (2010) demonstrated that when people considered green purchases such as organic food, they felt virtuous for taking a socially and environmentally positive action and were more likely to lie or show other negative moral behavior afterward.
A study by Chugani et al. (2015) found that satiation was linked to a consumer’s self-concept and the rate of satiation to identity-consistent products depended on the consumers active connections between their sense of self and the focal identity. Heath and Scott (1998) showed that if the brand-related information was inconsistent with the customers’ self-concept, it was not likely to gain customers’ attention, acceptance, and retention. Sirgy et al. (1997) reported that self-image congruence was a strong predictor of brand satisfaction (see also Jamal, 2004; Jamal & Goode, 2001), which was generally described as the full meeting of one’s expectations (Oliver, 1997) and was widely recognized not only as a key influence on the customers’ future purchase intentions of that brand (Taylor & Baker, 1994) but also as the key to retaining customers and improving profitability (Anderson et al., 1994). Dunning (2007) advocated that consumers were dynamic, motivated agents who evaluated both themselves and the world around them in a manner consistent with a set of “sacrosanct beliefs” and self-motives.
Bisogni et al. (2012) found that different life experiences, self-concept, resources, food availability, and conflicting considerations influenced people in developed countries not eating according to their ideals for healthy eating. Mai et al. (2012) showed that health conscious consumers were more willing to elaborate on health-related product attributes (e.g., nutrition facts) and emphasized food naturalness (e.g., non-genetically engineered foods).
Chang et al. (2003) found that those who had open, conscientious, and extroverted personalities had higher needs for health consciousness and used food traceability labels as a unique learning device and choice criteria.
Past research on the effectiveness of nutrition labeling has been remarkably inconclusive, irrespective of whether it was conducted in a grocery store (Moorman et al. 2012) or restaurant settings. Some studies concluded that providing nutritional information on restaurant menus lowered caloric intake (e.g., Milich, Anderson, & Mills, 1976; Roberto et al., 2010; Wisdom, Downs, & Loewenstein, 2010); yet, others found that the information had no effect (e.g., Elbel et al., 2009; Finkelstein et al., 2011; Harnack et al., 2008; Mayer et al., 1987; Schwartz et al., 2012). Even among studies finding an effect, the size of the effect tended to be small. Balfour et al. (1996) and Yamamoto (2005) found that only a small proportion of consumers (16% and 29%, respectively) changed their menu item selection when presented with nutrition information.
Cornish (2012) examined the impetus behind the consumption of both nutritionally rich and nutritionally poor functional foods and found that consumers were unable to distinguish between the two, and believed the health claims of both. The consumption of nutritionally poor foods could have a negative impact on consumer well-being, pointing to the necessity of educating consumers about what constituted a healthy diet, the role of nutrients as building blocks in healthy diets, and the importance of choosing appropriate sources for these nutrients to enable them to make healthier dietary choices.
A number of studies have been conducted on the impact of calorie information on labels on choice of low calorie foods. In a study conducted in New York City (Elbel et al., 2009), of the 28% of fast food patrons using calorie labels, 88% reported being influenced by the information; of the 68% customers dining at restaurants in Seattle, 45% said the calorie labels informed their meal choice, and only 13% reported the information influenced what they ordered for their child (Tandon et al., 2011).
Ellison et al. (2013) explored the potential relationships between caloric intake and diners’ socioeconomic characteristics and attitudes in a restaurant field experiment that systematically varied the caloric information printed on the menus. Results showed that calorie labels had the greatest impact on those who were least health conscious. In addition, using a symbolic calorie label could further reduce the caloric intake of even the most health conscious patrons. Finally, calorie labels were more likely to influence the selection of the main entrée as opposed to supplemental items such as drinks and desserts. The study concluded that if numeric calorie labels were implemented, they were most likely to influence consumers who were less health conscious. To reach a broader group of diners, a symbolic calorie label may be preferred as it reduced caloric intake across all levels of health consciousness. In another study in 2014, the same authors used field experiment data, to compare the effectiveness of calorie labels with a “fat tax” at reducing calories ordered. Results of the research study revealed menu labeling could influence food choice. The study found that when no calorie label was present, a greater proportion of higher calorie meals (more than 800 calories) were ordered than when either a numeric or symbolic calorie label was utilized, and that the symbolic calorie label led to greater calorie reductions than the numeric calorie label proposed by the Food and Drug Administration (FDA).
Gad et al. (2013) surveyed U.K. consumers and explained consumption motivations through examining antecedents of temporally dominated benefits in application to organic food. The research findings established significant associations of level of involvement, prior knowledge, product usage, and some association of time orientation with the temporally emphasized consumption benefits consumers ultimately pursued.
A number of research studies have focused on messages used to promote the consumption of healthy foods. Krystallis and Chrysochou (2011) examined whether health food (low fat) claims positively influenced levels of brand loyalty and found that products with health food claims could have noticeable advantages over competitors. Mohr et al. (2012) discussed serving size and its impact on calorie information and consumer guilt. Robinson et al. (2014) found that health-based messages used to promote fruit and vegetable intake were limited in their effectiveness. Instead, social norm messages, suggesting other people were eating healthily, were more effective.
Mai et al. (2015) found that the goal conflict between short-term indulgence and long-term health considerations was at the heart of unhealthy food choices. The research examined the potential of health consciousness to resolve the unhealthy = tasty intuition (UTI) and demonstrated that the UTI partly worked implicitly and independently of health consciousness.
Specific studies focusing on the impact of socio-demographic factors on the consumption of healthy food were also found. Research by Pasternak et al. (1996) showed that dietary guidelines were often not followed. Glanz et al. (1998) found that nutrition was more important to women and older individuals, making these groups more responsive to menu labels as opposed to young males. Gandini et al. (2000) suggested that despite the fact that socioeconomic status (SES) could be assessed in terms of income, occupation, and/or educational level, each of these dimensions had its own causal pathway toward dietary habits. Herman et al. (2003) argued that food choice was influenced by a desire to convey a certain impression or adhere to social norms (Leary & Kowalski, 1990; Roth et al., 2001). Shah et al. (2005) found that the workplace culture, social networks, and future salience mediated the relationship between occupation and diet. Grotza et al. (2011) examined the association between health behavior and socio-demographic variables and Health Locus of Control (HLC). They found that higher age, low SES, and migration background were associated with higher HLC scores.
While Elbel et al. (2011); Elbel et al. (2009) found that residents of low-income neighborhoods were least likely to report using calorie labels to make a lower calorie food choice, Dumanovsky et al. (2011) found consumers in more affluent communities were most likely to use this information. Women, especially those between the age group of 18 and 24 years more so than men, reported using calorie labels (Dumanovsky et al., 2011; Krieger et al., 2013, Blichfeldt & Gram, 2013), and compliance with dietary guidelines steadily fell as SES decreased (Grundy et al. 1999). Casagrande et al. (2007) and Lewis et al. (2011) suggested that the income–diet relationship was mediated by access to food and diet cost (Ahmed et al., 2012).
The educational level–diet relationship might be mediated by attitudes toward healthy eating, knowledge about food (Booth et al., 1992), family values (McLeod et al., 2001), and social support for healthy eating (Lee, 2009). Education seemed to be the most important variable to explain social differences in dietary habits (Cho et al., 2009; Huckfeldt & Sprague, 1995). Mediation of the educational level–diet relationship by attitudes toward healthy eating was twice as strong in women as in men (Wardle et al., 2004). LeDoux and Vojnovic (2013) found that among the 1,631 participants surveyed, favorable attitudes toward healthy eating were associated with both higher educational level and diet quality, and that higher educated people were more likely to pay “attention to health when buying food,” and “organic food consumption,” but were less likely to cite health in the perceived role of eating.
Gram and Blichfeldt (2014) explored female students’ food dilemmas to identify reasons why unhealthy food consumption happened despite the students’ good intentions to eat healthy diets and found that female students were well informed about nutrition, and several of them were experienced cooks from home but “bad” food sneaked into their diets, because of lack of time and energy, pressure from their studies and food cravings, along with more liberal rules in social situations.
Research studies also focused on the role of emotions and food choices. Ogden (2009) found that the link between emotions and food consumption was well documented, and both negative and positive emotions influenced eating behavior (Desmet & Schifferstein, 2008). Childers et al. (2011) advocated that emotional issues such as boredom, loneliness, unhappiness, and stress affected U.S. students’ consumption of particularly unhealthy foods.
Some researchers focused on factors influencing consumption of healthy foods. Herman et al. (2003) found that social influence affected eating, that behaviors were influenced by social comparisons (Hupkens et al. 2005; Mussweiler, 2003; Mussweiler et al., 2004), and that healthy eating was a normative standard (Jutel, 2005). McFerran et al. (2010a) examined the effect of body type of consumers on the food consumption of other consumers around them and found that people chose a larger portion following another consumer who first selected a large quantity but that this portion was significantly smaller if the other was obese than if she was thin.
An interesting study by Karmarkar and Bollinger (2015) focused on shopping with reusable grocery bags and its impact on consumers’ in-store behavior. Using scanner panel data from a single California location of a major grocery chain, and controlling for consumer heterogeneity, they demonstrated that bringing one’s own bags increased purchases of not only environmentally friendly organic foods but also indulgent foods.
A research by Huneke et al. (2015) examined the effect of service employees’ appearance on consumers’ food choice using an experimental study, involving a video manipulation and eye-tracking technique. The study demonstrated that exposure to the overweight employee did not stimulate greater attention to unhealthy meal alternatives, whereas exposure to the employee who displayed an unhealthy lifestyle did.
Kelly et al. (2016) focused on an increasing societal impact of ill health in later life. They found that lack of time (due to family, household, and occupational responsibilities), access issues (to transport, facilities, and resources), financial costs, entrenched attitudes and behaviors, restrictions in the physical environment, low SES, and lack of knowledge were the recurring barriers. Specific issues relating to population and culture were identified relating to health inequalities.
Thus, the studies reviewed have covered diverse aspects of consumption of healthy foods but most of them have focused on factors influencing purchase of healthy foods or the impact of food labeling legislation on choice of food. Some research was found on self-image as a variable influencing consumption of various products but there is a lack of research on the self-image of health conscious consumers and the relationships between self-image and consumption of healthy labeled foods. Furthermore, none of the studies attempted to identify how consumers defined themselves as being health conscious and how this might affect the choice of foods labeled healthy. It is to fill this gap that the present study is designed.
The objective of this research is to better understand how consumers view themselves in terms of health consciousness and whether some demographic factors are associated more significantly with the health conscious self-image, and further, whether consumers with a health conscious self-image are more prone to purchase food labeled “healthy.”
Hypotheses Development
There are no two opinions that with an increased consciousness to consume healthy foods and beverages, understanding the factors that influence consumer preferences toward health food is becoming increasingly important in the market today. Food consumption decisions are no longer restricted to being personal but carry a social image and are modified by peer approval that is dependent on the types of food consumed by individuals, especially because food is very frequently consumed in a social setting with family, friends, colleagues, and others. Self-image influences the consumption of products and that, in fact, consumers strive toward maintaining self-image congruity and as such choose products that support their self-image. Research has also shown that if products fail to match the self-image held by consumers, they are likely to avoid consuming them. To understand how consumers who support the self-image of being health conscious choose products labeled healthy, it is important to understand what constitutes the self-image of health consciousness.
This study aims to find out how people who consume products labeled healthy choose to describe themselves in terms of health consciousness. Do all the consumers define themselves in terms of the same variables? Can we address them as one segment of consumers who are concerned about their health? Are there differences in the perceptions of health consciousness among consumers regarding what constitutes a health conscious self-image? This leads us to examine the following hypothesis:
Previous research has also shown that demographic factors influence the consumption of food. It will then be pertinent to find out whether consumers who consider themselves as health conscious are likely to differ in their demographics. Thus, we need to examine a second hypothesis:
Research has also shown that consumers belonging to different demographic factors are likely to differ in terms of their consumption behavior. Would this analogy be applicable to consumers with a health conscious self-image in their consumption of healthy labeled foods too? We, therefore, need to understand as to whether consumers holding the health conscious self-image actually consume food labeled healthy when they are hungry or whether they choose products that are not labeled as such. This leads us to our third hypotheses:
Method
The study focused on understanding the factors that constituted the self-image of health consciousness and its effect on actual purchase of healthy food. A brief (5-6 min) self-administered online questionnaire was designed, pretested, and distributed to a random sample via emails. The email invitation provided a brief description of the study and a link to the survey. The respondents were allowed to opt to take the survey by filling an informed consent form prior to beginning the survey itself, but were unable to go back to previous screens to review or revise their responses, to reduce a halo bias that could contaminate results.
The survey included 15 items to measure the self-image of people toward health consciousness, and questions related to demographics and actual purchase behavior. For the purpose of this study, the Health Consciousness Scale created by Stephen Gould in 1988 was modified. Of the original nine items, four items were selected from this scale and 11 additional items were added to it. Two focus groups were conducted to identify behaviors related to the consumption of healthy labeled foods. These 11 additional items were identified and developed from the conversations in these groups. Two types of scale options were used: a five-point scale ranging from not like me at all (1) to like me (5) to describe themselves and another scale where they described their level of agreement from strongly disagree (1) to strongly agree (5) with their activities and opinions related to health conscious behavior. SPSS 18 was used for analysis.
Sample Profile
Care was taken to obtain unbiased data from different age groups, gender, education levels, ethnicities, and relationship statuses. The total sample consisted of 390 respondents. The incidence rate was 92.6%. The sample emerged to be largely Caucasian (98.7%), of which 26.5% (95) were male and 73.5% (263) were female. The respondents belonged to five different age groups. Two age segments appeared to be strongly represented, 18 to 22 years old (46%) and those above 41 years of age (36%). All but 11% of the respondents graduated with a high school diploma and 24% had acquired a bachelor’s degree. Approximately 52% of the sample consisted of respondents still studying for their undergraduate degree, and about 64% were either in a relationship or married and 36% were single.
Reliability
Before conducting further analysis of the data, it was important to assess the reliability of the scales used for measuring health consciousness. The user-defined missing values were treated as missing and statistics are based on all cases with valid data. For the purpose of calculating reliability, 29 cases were excluded list-wise as the responses were incomplete and 361 cases were used for this computation. The analysis revealed a Cronbach’s alpha of .753. The value of the alpha coefficient if an item was deleted was computed to ascertain whether its value could be further improved (Table 1).
Health Consciousness Scale: Reliability.

The analysis revealed that if we dropped item number 9, the value of the alpha coefficient would increase to .787. It was, however, not dropped from further analysis because its deletion would have increased the scale variance. To further understand whether some of the variables consumers used to describe themselves as health conscious could be further reduced, a factor analysis of the 15 statements was conducted.
Are There Different Self-Image Factors of Health Consciousness?
To identify prominent self-image variables, exploratory factor analysis was used. To assess whether the data were adequate for this purpose, the value of Kaiser-Meyer-Olkin (KMO) measure of sampling adequacy was computed (Table 2). This measure varies between 0 and 1, and although values closer to 1 are better, the value of .6 is a suggested minimum. The KMO measure was .840, which is considered good for conducting the factor analysis. The analysis also meets the requirements of Bartlett’s test of sphericity, which tests the hypothesis that the correlation matrix is an identity matrix, and there are correlations in the data set that are appropriate for factor analysis.
KMO and Bartlett’s Test.

Note. KMO = Kaiser-Meyer-Olkin.
The principal component method and varimax rotation were used. Factors with eigenvalues above one (EV ≥ 1; Kaiser, 1958) were selected after conducting the scree test (Cattell, 1966). This resulted in identifying five factors, explaining 69% variance. The rotated component matrix was used to identify statements composing each factor. The rotated factor loadings (factor pattern matrix) represent both how the variables are weighted for each factor and the correlation between the variables and the factor. Being correlations, their possible values range from −1 to +1. Furthermore, to identify the constituent statements, those with factor loadings below .26 were ignored. Items that did not load on any of the retained factors or with factor loading <.26 were sequentially removed based on the recommendation provided by Stevens (2002). He suggested that a loading of .722 can be considered significant for a sample size of 50, a loading greater than .512 is significant for a sample size of 100, and a loading greater than .364 is significant for a sample size of 200. By the same reasons, therefore, a factor that consists of a single statement that loads high is considered highly desirable. Furthermore, statements that loaded highly for more than one factor were retained only toward the factor they loaded highest on and were removed from consideration from other factors. Accordingly, Table 3 lists the statements that were found to constitute the factors
Rotated Component Matrix.
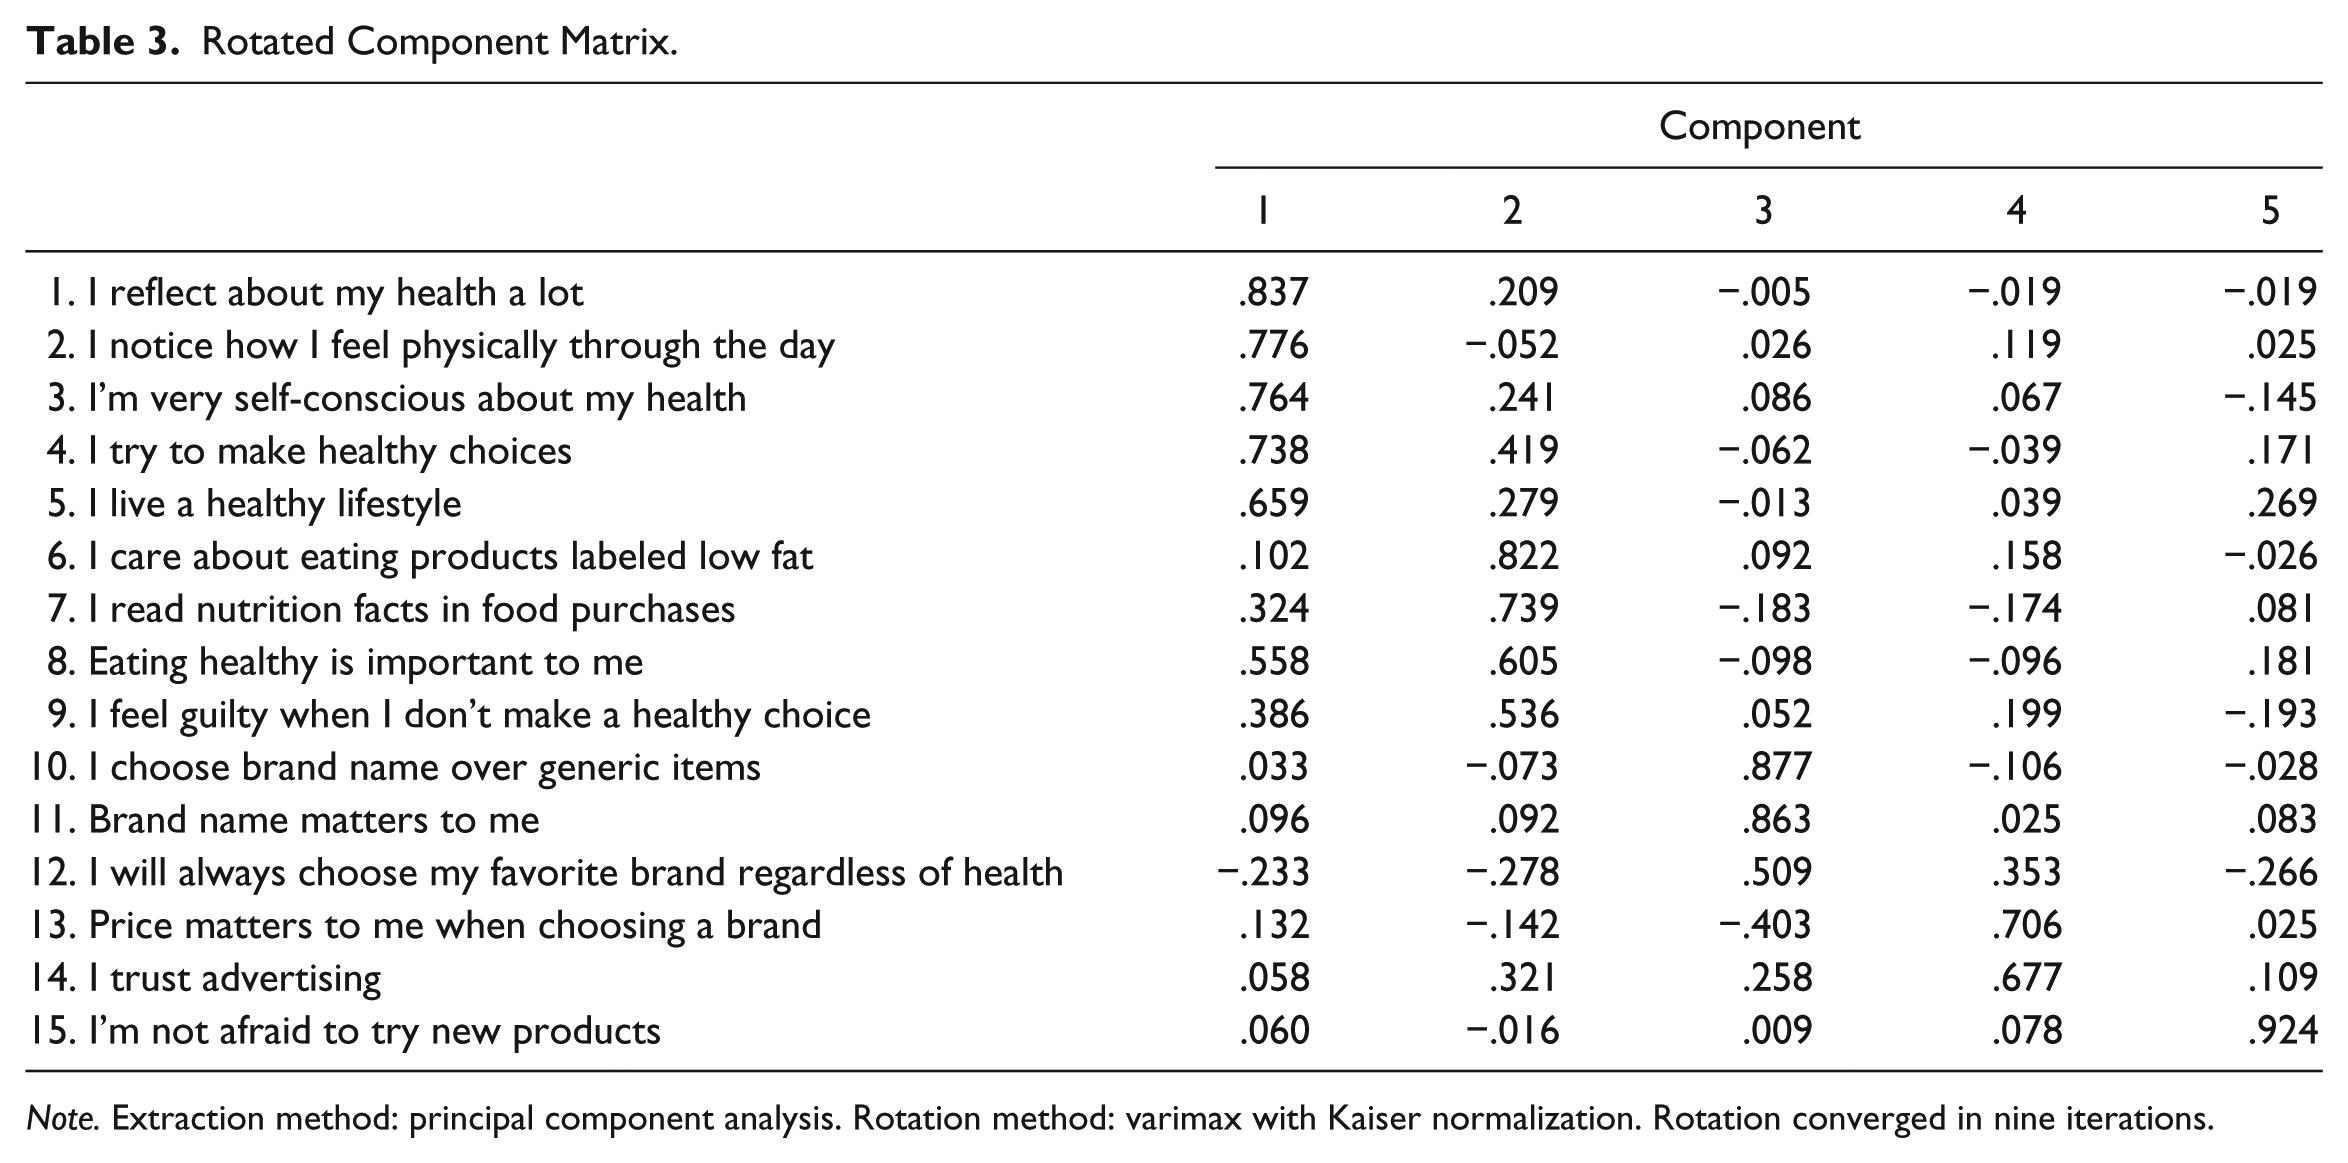
Note. Extraction method: principal component analysis. Rotation method: varimax with Kaiser normalization. Rotation converged in nine iterations.
Description of Factors
The five factors identified by the research portray the different self-image variables that constitute each factor. These are described below.
Self-Image Factor 1
This factor represented the self-image that identified itself with an overly concern for health. The respondents subscribing to this self-image constantly reflect about their health and believe that they live a healthy lifestyle. They closely monitor their physical condition throughout the day, are self-conscious about their health, and try to make healthy choices in their food consumption decisions. They are, thus, actively seeking healthy labeled food products. Accordingly, we labeled this factor as health conscious.
Self-Image Factor 2
This image identifies with those who like to eat healthy, as it is important for them to monitor their calorie intake. They correlate a healthy body with an ideal weight and make efforts to avoid obesity. They actively search for nutritional information and like to consume products with claims of low-fat ingredients. They, thus, associate healthy eating to mean control over calorie and fat intake. They might even feel guilty if they discovered that they made an unhealthy choice. This self-image factor is named as weight conscious.
Self-Image Factor 3
This self-image identified itself with those who considered themselves as very brand conscious in choosing products labeled healthy. They do not prefer generic products and need the assurance of a known brand name. They are also unlikely to feel comfortable trying new and unfamiliar brands or unbranded food products that make health claims. They are brand loyal and may sometimes even choose unhealthy products and purchase their preferred brand instead. This factor was labeled the brand conscious.
Self-Image Factor 4
This factor represents those who are very price conscious and choose brands that are not expensive. They also trust advertising. The two factors combine to indicate that their choice of healthy labeled products depends on whether such brands are well advertised and have a low price. They are unlikely to use unfamiliar brands of healthy labeled food or items that are expensive. They are also brand conscious to the extent that they may not try unbranded products even if they promise a health benefit and are inexpensive. This factor was called the value conscious.
Self-Image Factor 5
This factor consists of those who like to try new brands and are more open to experimenting with them. They are the early adopters of food products that are new that may or may not carry a health benefit. They focus more on the experiences they have with brands rather than seek assurance from well-known brands. They are likely to try new unknown food items, which makes them least brand loyal, but they might choose products that are not healthy. This factor is labeled variety conscious.
Thus, the results indicated that there were at least five different self-image factors that could explain the health conscious self-image held by consumers of healthy products. Consumers perceive themselves differently even on health consciousness, and are likely to differ on the basis of how strongly they associate themselves on the health consciousness continuum. They are likely to have different expectations from healthy labeled foods and choose different types of labels that describe healthy foods. The next section identifies whether specific demographic factors were associated with the different self-image factors identified thus far.
Self-Image Factors and Demographics
It was assumed that every health conscious consumer would display a similar behavior toward healthy labeled foods and that such consumers would share similar demographics. Because the self-images of health conscious consumers were found to be different, it was of interest to identify whether the factors representing different self-images related to same or different demographics. The following demographics—age, gender, marital status, and level of education—were studied. Thus, sub-hypotheses for our second hypothesis were developed. It was hypothesized that,
The results of the analysis are presented below.
Relationship Between Self-Image Factors and Age
Respondents were classified into five age groups. To understand the relationship between the different self-image factors and age groups, an ANOVA was conducted. The F test was applied to test the significance of differences between two variances: the among group variance and the between group variance. Significant F values indicate that the means are significantly different from one another.
The results showed significant relationships between self-image and age for the health conscious, F(4, 356) = 4.22, p = .002; weight conscious, F(4, 356) = 4.51, p = .001; and value conscious, F(4, 356) = 5.42, p = .000. No significant relationship was found between the brand and variety conscious self-image factors and age. The descriptive for self-image factors and significant age groups are summarized in Table 4.
Descriptives for Self-Image Factors and Age.

The Tukey–Kramer multiple comparison of means was employed to understand whether the differences between the means pertaining to age groups were significant (Table 5).
Self-Image Factors and Age: Comparison of Means.

Significant at .05 level.
The results reveal that for the health conscious self-image, as compared with the age group of 18 to 22 years, there was a highly significant mean difference for the age group of 41 to 59 years (M difference = 0.59, sig. = .001) and as compared with the age group of 23 to 30 years, there was a highly significant mean difference for the age group of 41 to 49 years (M difference = 0.59, sig. = .001). The mean differences were not significant for the 50+ age group. In other words, the age group of 41 to 49 years was different in their self-image of health consciousness both from the 18 to 22 years and 23 to 30 years age groups. Considering the means and standard deviations (Table 4), we see that the highest mean for health conscious self-image was for the age group of 41 to 49 years (M = 0.45, SD = 0.96).
For the weight conscious self-image, as compared with the age group of 18 to 22 years, there was a highly significant mean difference for the age groups of 31 to 40 years (M difference = 0.70, sig. = .009) and 41 to 59 years (M difference = 0.48, sig. = .009). The differences between the 18 to 22 years group were not significant for the 23 to 30 years or 50+ years age groups. In other words, the age groups of 31 to 40 years and 41 to 49 years were significantly different in their self-image of weight consciousness from the 18 to 22 years age group. Considering the descriptives (Table 4), we see that the highest mean for weight conscious self-image was for the age group of 31 to 40 years (M = 0.51, SD = 0.90).
For the value conscious self-image, as compared with the 18 to 22 age group, the mean differences were highly significant for the age groups of 41 to 50 years (M difference = 0.56, sig. = .001) and 50+ years (M difference = 0.50, sig. = .004). The differences were not significant for the age groups of 23 to 30 years and 31 to 40 years. The descriptives (Table 4) show that the highest mean for value conscious self-image was for the age group of 41 to 40 years (M = 0.35, SD = 0.90) and second highest for 50+ years (M = 0.30, SD = 0.96).
Thus, the findings suggest that there are differing self-image perceptions among age groups on the health, weight, and value conscious factors. At a younger age, the consumers are still not financially independent and have limited means. Furthermore, their anxiety about health and weight is spurred by their desire to look attractive as they join college, look for partners, or enter the job market. The concerns around weight start changing around middle age, when career and familial responsibilities take precedence over maintaining the normal physical exercise routine. These responsibilities also motivate the consumers in the above 40 years age group to obtain more value in their brand choice. Furthermore, the perceptions of an ideal or acceptable weight might be different for people belonging to diverse age groups, differences in height, and gender. Thus, within the broad category of weight conscious consumers supporting a self-image of health consciousness, the choices may be different.
As consumers age, they are likely to seek more value in their purchases of healthy labeled products. Students and younger consumers are able to settle down financially by age 30. Their choice of healthy labeled food may not necessarily be dictated by the value they obtain from such foods as they celebrate their new-found financial independence and, at the same time, start their own families. The senior consumers, however, may seek more value in their purchases as they support their college-going children or change careers or provide for their impending retirement. No significant differences were found for self-image groups of brand conscious or variety conscious factors on the basis of age.
Relationship Between Self-Image Factors and Gender
The sample consisted of 95 men and 266 women. Because gender influences the consumption of some products, it was important to identify whether it influenced the consumption of products labeled “healthy.”
A cross tabulation by gender for the self-image variables was conducted to understand whether there were significant differences among men and women in how they perceived themselves with regard to health consciousness. The results are presented in Table 6.
Relationship Between Self-Image Factors and Gender.

Significant at .5 level.
The results reveal that the gender differences in self-image factors are significant among men and women for the weight, brand, and variety conscious self-image factors. Although both genders are weight and brand conscious in their self-image, men appear to be more weight, brand, and variety conscious as compared with women. There are no significant differences among men and women on the health and value conscious self-image. While previous research (Glanz et al., 1998; Gram & Blichfeldt, 2014) showed that women were more health conscious than men, this study reveals that men are becoming more weight, brand, and variety conscious in their selection of healthy labeled foods. This change could probably be explained with changing socio-demographic environment where more and more men are choosing to remain single, or engaged in building a body or are staying at home to take care of kids and, in this process, improve the quality of diet consumed by them. Because more women are choosing to go out to work, they are unable to maintain the consumption of healthy foods due to time constraints and, therefore, may not be able to necessarily choose healthy labeled food that might help them influence their weight or to find time to purchase branded items. They may also be more brand loyal than men because the relationship with the variety conscious self-image was not significant. The results are supported by the study conducted by Gram and Blichfeldt (2014), which found that despite the fact that female students were more health conscious, their actual consumption of food was becoming more unhealthy due to lack of time and energy and work pressure.
Self-Image Factors and Relationship Status
The respondents were asked to select any one of the following to describe their relationship status—single, in a relationship, married, divorced, separated, and widowed. Because the responses in the two categories divorced and widowed were very few, they were merged in the category of single. Only three categories were, therefore, used for further analysis—single, in a relationship, and married.
To understand the relationship between the self-image factors and relationship status, we computed ANOVA. The results for ANOVA for the self-image factors showed a significant relationship between the relationship status and self-image of the weight conscious, F(2, 356) = 3.452, p = .03, and a highly significant relationship with the value conscious, F(2, 356) = 4.989, p = .01. There was no significant relationship between the self-images of health, brand, and variety conscious consumers and relationship status. The descriptives are presented in Table 7.
Descriptives for Self-Image and Relationship Status.

Tukey–Kramers’ multiple comparison of means revealed that there were significant differences between the married respondents and those who were either single or in a relationship with regard to the weight and value conscious self-image factors (Table 8).
Self-Image and Relationship Status: Comparison of Means.

Note. RS = relationship status.
Significant at .05 level.
As compared with singles, the married respondents are likely to significantly differ in their weight conscious self-image (M difference = 0.33, sig. = .02), value consciousness self-image from both singles (M difference = 0.37, sig. = .01), and those in a relationship (M difference = 0.32, sig. = 03). The descriptives in case of the weight conscious self-image were higher for singles (M = 0.18, SD = 1.06) as compared with married respondents (M = 0.15, SD = 0.95). In case of value conscious self-image, the married enjoyed a higher mean value (M = 0.23, SD = 0.99) as compared with singles (M = 0.15, SD = 0.95) and those in a relationship (M = 0.10, SD = 0.98).
The results appear to be true as singles are more concerned about their weight, looking forward to getting into relationships, to look more physically appealing as compared with the married who become more accepting of their own or partner’s weight gain. Furthermore, the married respondents are the most value conscious as they deal with marital and familial responsibilities, and the desire to save.
Self-Image and Education
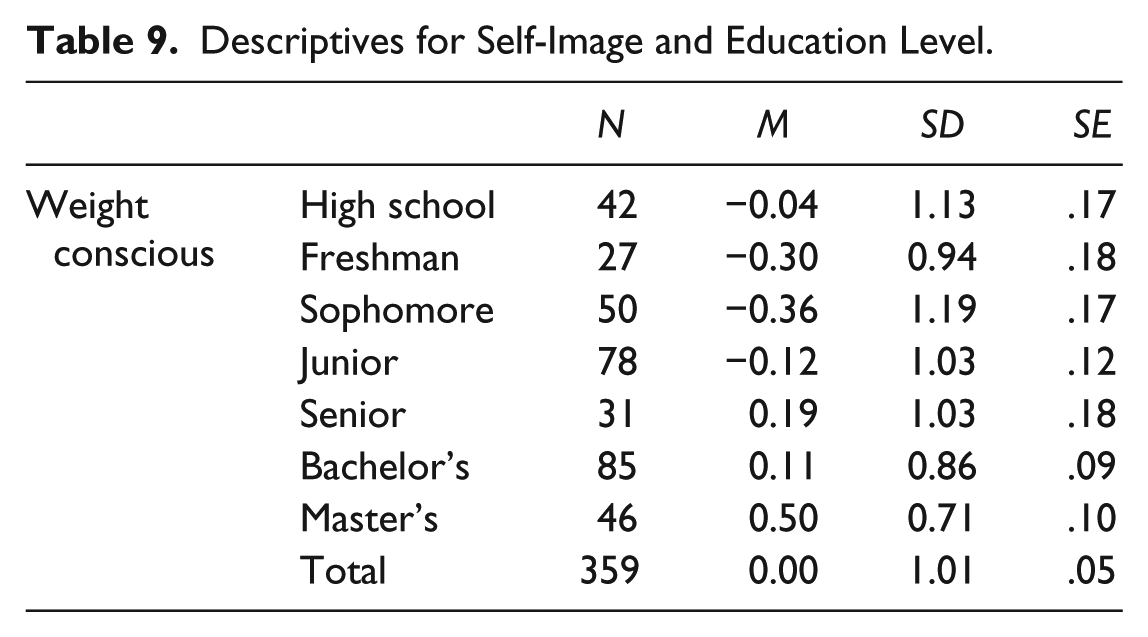
The respondents reported the following educational qualifications: high school diploma, freshman, sophomore, junior, senior, bachelor’s degree completed, and master’s degree completed. ANOVA was employed to identify the relationship between self-image factors and education. The results revealed that there was a highly significant relationship between weight conscious self-image, F(6, 352) = 4.002, p = .001, and education. No other self-image was found to have a significant relationship with education. The descriptives for the weight conscious self-image are reported in Table 9.
Descriptives for Self-Image and Education Level.
To ascertain which educational groups differed on this self-image factor, the Tukey–Kramer’s multiple comparison of means test was conducted (Table 10).
Self-Image and Education: Comparison of Means.

Note. HSD = high school diploma.
Significant at .01 level.
The analysis showed that there were highly significant differences in the means for graduates in their self-image about weight consciousness relative to freshmen (M difference = 0.79, p = .009), sophomores (M difference = 0.85, p = .001), and juniors (M difference = 0.62, p = .003) in college. The descriptives for the self-image and education revealed that the respondents with a master’s degree (M = 0.50, SD = 0.71) had the highest mean value followed by sophomores (M = 0.36, SD = 1.19), freshman (M = 0.30, SD = 0.94), and juniors (M = 0.12, SD = 1.03). This implies that consumers at different educational levels assign a different meaning to what they perceive as being weight conscious. As consumers get more educated, their self-image with regard to what weight they consider as healthy also changes. Thus, people subscribing to different self-image factors differ on account of demographics. Next, we explore the relationship between the self-image factors identified above and preferences for actual consumption of healthy foods when the consumers were hungry.
Consumer Behavior: Preference for Healthy Foods When Hungry
Data were collected on whether the respondents preferred to consume products that were “healthy,” “not healthy,” or had “no preference” for either when they were hungry. ANOVA was conducted to identify relationship between the self-image factors identified above and the consumption preferences of consumers when they were hungry. The results reveal that the differences were highly significant for four self-image factors—health conscious, F(2, 358) = 41.40, p = .001; weight conscious, F(2, 358) = 30.03, p = .001; brand conscious, F(2, 358) = 4.27, p = .01; and variety conscious, F(2, 358) = 4.75, p = .009. The differences were not significant for the value conscious self-image factor.
To identify which of the self-image groups were significantly different on account of preference for healthy labeled foods, Tukey–Kramers’ multiple comparison of means was employed (Table 11).
Self-Image and Consumption Behavior: Comparison of Means.

Significant at .05 level.
For the health conscious consumers, the mean differences were highly significant for those who preferred healthy food as compared with those who preferred unhealthy product (M difference = 1.71, sig. = .000) or those who were indifferent (M difference = 0.71, sig. = .000) when hungry. Highly significant differences were also found between those who preferred unhealthy food and those without such preference (M difference = 1.01, sig. = .000). The descriptives support this result and show that as compared with making healthy choices (M = 0.35, SD = 0.92) or having no preference (M = 0.36, SD = 0.89) for healthy labeled food, the consumers with the health conscious self-image are more likely to choose an unhealthy product (M = 1.36, SD = 0.83).
Consumers with a weight conscious self-image who chose healthy foods had significant differences from those who selected unhealthy options (M difference = 0.68, sig. = .031) and highly significant differences with those who had no such preferences (M difference = 0.78, sig. = .000). More consumers supporting the weight conscious self-image are likely to have no preference (M = 0.43, SD = 1.03) for healthy products when hungry, but some may choose a healthy option (M = 0.35, SD = 0.85) over an unhealthy option (M = 0.33, SD = 1.10).
Similarly, for the brand conscious self-image factor, highly significant differences were found between those who would choose the healthy options and those who had no such preferences (M difference = 0.32, sig. = .01). A look at the descriptives (Table 12) revealed that those who had no preferences (M = 0.19, SD = 1) had a higher mean value as compared with those who selected healthy options (M = 0.13, SD = 0.99).
Descriptives for Self-Image and Consumption Behavior.

Among those with a variety conscious self-image, the differences were significant among for those choosing healthy options and those choosing unhealthy options (M difference = 0.69, sig. = .04). The descriptives for the variety conscious revealed the highest mean for those who chose unhealthy options (M = 0.57, SD = 1.29). Thus, the variety conscious are likely to choose unhealthy options as well. The relationships were not significant for the value conscious consumers and they may focus more on price/value rather than the health benefit. These results show that some consumers may not actually conduct themselves in a way that supports their self-image.
Conclusion and Implications
Thus, the research shows that consumers with a self-image of health consciousness differ in how they see themselves with regard to both their image and the preference for healthy labeled products. The study identified five different self-image factors: the health conscious, weight conscious, brand conscious, value conscious, and the variety conscious. The differences in self-image are likely to influence what the label “healthy” means to each of the self-image groups and the preference for healthy labeled products. Marketers will need to understand these differences and design their products, advertising, and communication strategies to appeal to these different segments
Furthermore, the self-image factors have particular relationships with the different demographic variables (Table 13). We found significant relationships between the self-image factors and age, gender, relationship status, and education. For example, consumers who held the health conscious self-image differed on account of age, and the age groups of 18 to 22 years old were significantly different from the 41 to 49 years old, and from 31- to 39-year-old consumers with a weight conscious self-image. In terms of value consciousness, 18- to 22-year-old consumers differed significantly from above 50 years of age and 23 to 30 years old differed significantly from 41 to 49 years of age. Thus, the meaning of a healthy self-image changed with age. The same advertising appeals will, therefore, not work with all consumers.
Summary of Significant Results.

Gender was found to be having a significant relationship with the different self-image variables. Both men and women were more likely to be holding the image of health and weight consciousness, but compared with women, men were more likely to see themselves as weight, brand, and variety conscious. These results do not seem to support previous research findings, which concluded that women are often more responsible eaters than their male peers; they tend to eat more vegetables, less fast food, and drink less alcohol than male students (Beasley, Hackett, & Maxwell, 2004); or that female food consumers seem to experience conflicting desires and practices when consuming food as they are typically more concerned with healthy eating (Rasmussen et al., 2012), more preoccupied with their weight, and often have a higher consumption of chocolate and other sweets than men (Rasmussen et al., 2012). This study, however, sees a reversal and actually finds that as compared with women, men are taking charge of their own health by consuming a greater variety of healthy labeled foods that help them control weight gain and prefer branded products.
Similarly, the relationship status influences the self-image people have with regard to the consumption of healthy labeled products. In terms of education, the study found significant differences on the self-image of weight consciousness between the less educated (high school) and those who had undergraduate (and seniors) or graduate qualifications. These results support results from previous research by LeDoux and Vojnovic (2013), which shows that education plays an important role in the selection of healthy diets.
Thus, we find the existence of sub-segments of self-images that would require different strategies for marketing healthy products. Not only will they need to be advertised to differently but the healthy food products and services will also need to be designed, labeled, priced, and packaged differently keeping in mind the different meanings the healthy self-image holds for different consumers. Brands after all are symbols that consumers choose to express themselves with and these findings have important repercussions for how the brands engage with their consumers.
The actual preferences of consumers who had a self-image of health, weight, or brand consciousness were found to be significantly congruent with their self-images. They appeared to choose more products labeled healthy as they did not differ significantly among themselves, but consumers with a self-image of value or variety consciousness were more likely to be different with regard to preferences for products that were labeled healthy. Marketers need to adopt strategies that emphasize value or variety to attract these segments of consumers toward the consumption of foods labeled healthy. In addition, these segments require better pricing- and value-based offers to attract them to such foods.
The strategies to market healthy foods for example to those holding the self-image of being brand conscious will require building brand awareness and recall and focus on building a positive brand image and unique positioning to appeal to target consumers. Innovative customer engagement strategies will be required to succeed in the marketplace. To attract the value conscious consumers, successful strategies would require assessing the customer lifetime value of consumers who prefer less expensive healthy foods. The manufacturers will have to weigh in on benefit of attaining the profits through higher volume versus profits through premium pricing. Accompanying these will of course be separate positioning and distribution strategies. There cannot be a one-size-fits-all approach to marketing products labeled healthy. Evidence has shown that health conscious consumers are more preventive in their general outlook than less health conscious consumers and that they tend to believe more in the efficacy of actions that can benefit their health (Gould, 1988; Jayanti & Burns, 1998).
This research points out that within the self-image factors that differentiate health conscious consumers, the marketers also need to consider the demographics if they need to better target their consumers to obtain better sales. There are sub-segments within the broad segments identified by the five self-image factors with significantly distinct preferences, demographics, and behavior patterns. Furthermore, even though consumers consider themselves as being health conscious, the actual choice of healthy food products will also be influenced by value perceptions and variety offered.
According to USDA report by the Economic Research Service (2015), over the past 30 years, food prices have risen faster than some other consumer goods, such as housing and transportation. Inflation-adjusted (real) prices for poultry and dairy products have been stable, while real prices for red meats, eggs, and fresh fruits and vegetables grew by 18%, 21.5%, and 40% between 1985 and 2014, respectively. Over the same time period, real prices for fats and oils, sugar and sweets, and nonalcoholic beverages fell. The price of corn sweetener decreased nearly 20% since 1985. Processed foods, many of which are included in the sugar and sweets category, are less affected by commodity-level price swings and are generally more closely linked to the costs of inputs such as electricity and wages. Industrial electricity costs and manufacturing wages both increased at a rate about 10% lower than overall inflation since 1985. These price trends will further affect the consumption of healthy labeled products as consumer expectations from these products will differ depending upon their self-image. In these times, when marketers are faced with tough competition and increasing accountability on the marketing rate of return, challenges of improving customer relationship and experience management, the basic equation of catering to the right consumer segments is becoming more important than ever.
Limitations and Further Research
The data have a limited generalizability having been confined to the state of New York. The survey may be distributed nationwide to ascertain whether additional segments of self-images regarding consumption of healthy products emerge or whether there is a replication of these image factors. Questions pertaining to income and occupation need to be added to the survey. There is also a need to look at situational factors that may influence the decision to purchase healthy labeled foods and consumer perceptions of brands that are available to health conscious consumers. Furthermore, there is a need to conduct studies on value and variety conscious consumers to identify what strategies could attract these segments to consciously choosing healthy foods, especially in the light of the fact that the cost of health care is also among the highest in these segments.
Footnotes
Declaration of Conflicting Interests
The author(s) declared no potential conflicts of interest with respect to the research, authorship, and/or publication of this article.
Funding
The author(s) received no financial support for the research and/or authorship of this article.