
Abstract
This article provides an empirical illustration of the utility of the bifactor method for unidimensionality assessment when other methods disagree. Specifically, we used two popular methods for unidimensionality assessment: (a) evaluating the model fit of a one-factor model using Mplus, and (b) DIMTEST to show that different unidimensionality methods may lead to different results, and argued that in such cases the bifactor method can be particularly useful. Those procedures were applied to English Placement Test (EPT), a high-stakes English proficiency test in Saudi Arabia, to determine whether EPT is unidimensional so that a unidimensional item response theory (IRT) model can be used for calibration and scoring. We concluded that despite the inconsistency between the one-factor model approach and DIMTEST, the bifactor method indicates that, for practical purposes, unidimensionality assumption holds for EPT.
Introduction
In educational testing, it is often important and necessary to investigate the underlying structure of a test through dimensionality assessment endeavors at the test level. Such efforts provide the researchers and practitioners with evidence regarding test validity, shed light on the relation between different domains, and help check the tenability of the pivotal assumption of unidimensionality in item response theory (IRT). Violation of this assumption can result in biased item and ability parameter estimates (e.g., Ackerman, 1989; Kirisci, Hsu, & Yu, 2001), which can further negatively affect IRT equating (e.g., Dorans & Kingston, 1985) and cause incorrect classification of examinees into different proficiency groups (e.g., Zhang, 2010). There have been numerous studies in psychometric literature that address the issue of dimensionality assessment (e.g., Childs & Oppler, 2000; De Champlain, 1996; De Champlain & Gessaroli, 1998; Hambleton & Rovinelli, 1986; Hattie, 1984, 1985; Jang & Roussos, 2007; Nandakumar, 1994; Nandakumar, Yu, Li, & Stout, 1998; Stone, 2006; Tate, 2003).
A number of methods can be used to assess the dimensionality of test responses (for a brief introduction of those methods and their implementation in different software programs, see Gessaroli &Champlain, 2005, or Svetina & Levy, 2012). Those methods can be categorized based on different grouping schemes that have been proposed in psychometric literature. For example, Svetina (2012) suggested dividing them into different groups based on criteria such as methodological nature (exploratory vs. confirmatory), modeling framework (factor analysis vs. IRT), and distributional assumptions (parametric vs. nonparametric). Another grouping scheme, which is based on whether a method assumes local independence or essential independence, was proposed by Gessaroli (1994). The third grouping scheme (J. Zhang & Stout, 1999), which is more relevant to our current study, divides those methods into four categories based on the combination of whether they are parametric or nonparametric and whether they attempt to assess the full number of dimensions required to explain the interaction between examinees and items, or they simply attempt to detect departure from unidimensionality.
In this study, we focus on techniques for unidimensionality assessment and demonstrate that in this context, method effect exists. In other words, different unidimensionality assessment methods may lead to different results. We argue that in cases where researchers are faced with inconsistent findings from different methods, the bifactor approach (which will be described in detail in the following) can provide actionable information regarding the practical consequences of accepting versus rejecting unidimensionality and hence assist the researchers in making more informed decisions. It should be noted that whereas we use the one-factor model approach and DIMTEST (which will be described briefly in the following section) in the remainder of this article to illustrate the existence of method effect in unidimensionality assessment, it is for demonstration purposes only and our focus is on the utility of the bifactor approach when other methods disagree. The applicability and suitability of different unidimensionality assessment methods are beyond the scope of the current study.
One-Factor Model Approach
To address questions regarding unidimensionality, both parametric and nonparametric methods can be used. In the parametric framework, factor analysis based on tetrachoric correlation can be conducted to compute a list of popular model-fit indices of the one-factor model, in which all items load on the same factor, and then the researchers can determine whether the model fits the data well using the commonly used cutoff criteria (Hu & Bentler, 1999). The rationale for this method is that due to the mathematical equivalence between the one-factor model of dichotomous indicators and the two parameter logistic (2PL) IRT model (e.g., Kamata & Bauer, 2008; Takane & de Leeuw, 1987), departure from unidimensionality will cause misfit in the one-factor model, and such misfit can be detected by those model-fit indices. However, because the validity of this approach hinges upon the robustness of Hu and Bentler’s (1999) cutoff criteria, which have been questioned in the psychometric community (e.g., Marsh, Hau, & Wen, 2009), we believe caution has to be exercised whenever a researcher decides to apply them. In addition, this approach does not provide a statistical significance test.
DIMTEST
DIMTEST, a nonparametric procedure created by Stout (1987) and refined subsequently by Nandakumar and Stout (1993) and Stout, Froelich, and Gao (2001), provides the capability to test whether the data significantly deviate from unidimensionality. Based on a less stringent assumption of essential unidimensionality proposed by Stout, DIMTEST also allows the researcher to specify a guessing value, which we believe conveniently complements the previous factor-based approach that assumes there is no guessing in the data. This method can be especially useful in the scenario when multidimensionality is suspected but the underlying multidimensional structure is unclear.
Bifactor Model Approach
Although those two methods address unidimensionality from different perspectives, they do not, when unidimensionality assumption is negated, inform researchers of the practical consequences of fitting a unidimensional model to their multidimensional data at hand. A relatively new approach proposed and recommended by Reise, Morizot, and Hays (2007) provides such information. It attempts to detect the magnitude of deviation from unidimensionality by comparing the factor loading of the one-factor model with the factor loadings on the general factor of a corresponding bifactor model, whose loadings on the secondary factors are based on content information. The similarity of those two sets of factor loadings should be indicative of how unidimensional the data are. Rather than directly addressing the issue of unidimensionality, this method takes a step back by assuming that multidimensionality, in the form of a bifactor structure, exists in the data, and asks the empirical question of “what will happen if we ignore the bifactor structure and fit a unidimensional model to the data.” If the two sets of factor loadings are highly similar, researchers may conclude that a unidimensional model should be adequate as the effect of the multidimensionality is too trivial to merit a multidimensional model.
It should be noted that the validity of the bifactor method largely depends on the correctness of a bifactor structure. In other words, when data exhibit a bifactor structure, we assume the bifactor model is the correct model and this method is essentially a comparison between the true bifactor model and a misspecified unidimensional model that ignores the secondary dimensions. When the factor loadings are similar, we conclude that the consequences of model misspecification are ignorable and the assumption of unidimensionality approximately holds for practical purposes. However, if the bifactor model is not a correct representation of the data, the comparison between two misspecified models becomes meaningless. As nicely put by Reise et al. (2007), “the bifactor model should not be applied arbitrarily to account for residual variation, but rather is only meaningfully applied when there are definable ‘content facets’ that form well-structured secondary dimensions” (p. 28). Although relatively new, this method has already been applied as an additional step to check unidimensionality (e.g., Dimitrov & Shamrani, 2015).
In the remainder of this article, we demonstrate with a real data set that the bifactor method can be a valuable tool when the traditional dimensionality methods disagree. Considering its requirement of meaningfully formed secondary dimensions, the bifactor method has wide applicability in the context of educational testing, as educational test data usually display a bifactor structure in the sense that those tests are frequently constructed to measure a general proficiency with items from different content domains.
Method
Data
Currently, the National Center for Assessment (NCA) located in Riyadh, Saudi Arabia, is interested in understanding the test structure of English Placement Test (EPT)—a high-stakes English proficiency test used for placement and admission purposes. Such an interest stems from the following practical concern: NCA is considering the use of IRT for item calibration and student scoring for EPT, and it aims to garner empirical evidence concerning whether the unidimensionality assumption required of the popular unidimensional IRT models holds. In other words, NCA is only interested in finding out whether the extent to which EPT test data depart from unidimensionality is great enough to raise concerns over the valid application of IRT.
A recently administered EPT test form was used for the data analysis. Same as other EPT tests, the current test consists of 88 multiple-choice items distributed across the following three sections: Reading Comprehension (RC; 23 items), Sentence Structure (SS; 45 items), and Compositional Analysis (CA; 20 items). The sample contains dichotomously scored item responses of 2,629 students who took this test form. A preliminary data analysis shows that the three sections are highly correlated and EPT is highly reliable. The correlation coefficient is .86 between RC and SS, .83 between RC and CA, and .87 between SS and CA, all suggesting a positive strong relation among the three sections. Cronbach’s alpha for the current test form is .95.
A data cleaning procedure was conducted before we embarked on the dimensionality assessment: Three items with item-total correlation close to zero were deleted from the data. Among them, one is from the RC section and the other two from the SS section. The remaining 85 items were used to assess dimensionality. Table 1 lists summary statistics based on those remaining items for each of the section. As can be seen, on average items from three sections have approximately the same medium difficulty at around .55 and item-total correlation values above .40. We consider the difficulty of the current EPT items desirable due to the fact that items of medium difficulty tend to maximize the item true score variance; as for the item-total correlation, based on our experience with item analysis, we believe that the current values are consistent with those found in other language tests, suggesting a moderate to strong relation between individual items and the total score.
Summary Statistics.
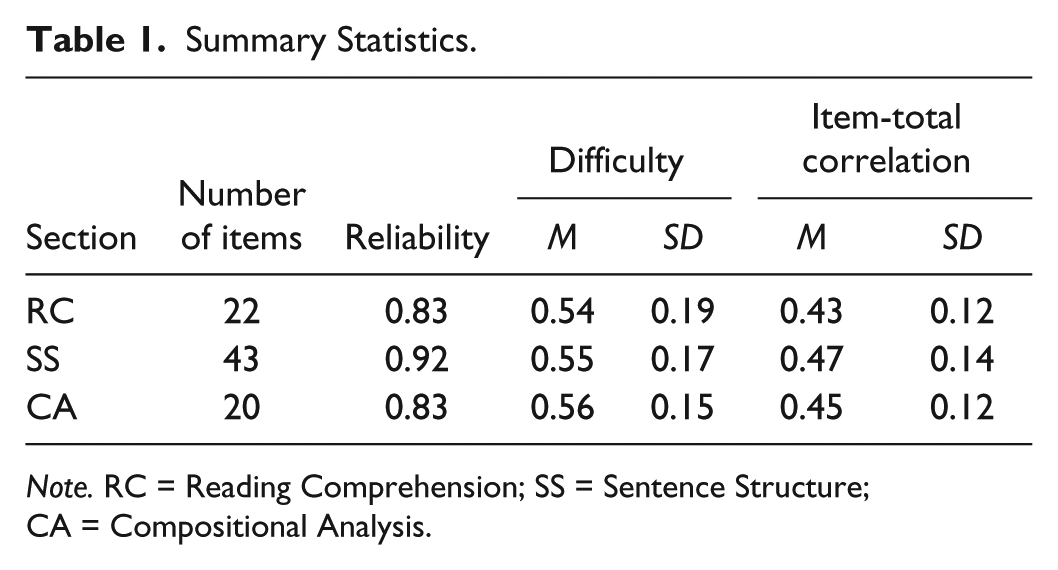
Note. RC = Reading Comprehension; SS = Sentence Structure; CA = Compositional Analysis.
Procedure
It should be noted that because the focus of this article is the demonstration of the utility of the bifactor approach other than an exhaustive application of unidimensionality assessment techniques available, we did not discuss any exploratory approach in the remaining part of this article. Nevertheless, we conducted an exploratory factor analysis (EFA) at the beginning, and the results revealed that there is a dominant factor accounting for approximately 35% of the overall variance.
The first step is to run a confirmatory factor analysis (CFA) of a one-factor model depicted in the left panel of Figure 1. This model hypothesizes that all item responses in EPT are driven by a general factor of English. It provides information regarding the unidimensionality of EPT: Excellent model fit constitutes evidence for unidimensionality of EPT, whereas mediocre model fit suggests that unidimensionality is not supported.

One-factor model versus bifactor model.
The second step is to test the null hypothesis of unidimensionality using DIMTEST. To run DIMTEST, the data need to be divided into an assessment subtest (AT) and a partitioning subtest (PT), which includes items hypothesized to measure a different dimension than the AT items; then, it is tested whether the covariances among items in AT are zero after conditioning on a latent variable supposedly measured by PT by comparing the computed statistic (T) with a critical Z value corresponding to the upper 100 × (1 − α) percentile, where α is the significance level (Stout, 1987). Choice of AT can be determined in either an exploratory or confirmatory manner: If a subset of items is suspected of forming a different dimension based on theoretical or substantive concerns, the confirmatory approach can be used; otherwise the exploratory approach should be used. In the current data set, considering the theoretically closer association between CA and SS items due to the componential nature of language proficiency, we implemented the confirmatory approach by choosing RC items in the data as the AT, and the remaining items (SS and CA items) as the PT.
The third step is to run a CFA of the bifactor model and compare the loadings on the general factor with the previous model. As mentioned previously, a comparison of the factor loadings of the one-factor model and the general factor loadings of a corresponding bifactor also provides information concerning unidimensionality. Based on the fact that EPT consists of those three aforementioned sections, we proposed the bifactor model depicted in the right panel of Figure 1. This model stipulates that aside from a general factor of English driving item responses in all three sections, there are three section-specific factors measured by RC, SS, and CA items, respectively. Those section-specific factors are assumed to be orthogonal to each other and the general factor. For model identification purposes, the general factor and the section-specific factors are all constrained to follow a standard normal distribution.
Results
Model Fit of the One-Factor Model
The one-factor model was estimated using Mplus with the default weighted least squares mean and variance adjusted (WLSMV) estimator for categorical variables. Table 2 lists the factor loadings of all 85 items. In this section, our particular interest is the model fit of the one-factor model. The following is a list of common goodness-of-fit indices reported in Mplus: comparative fit index (CFI) = 0.967, Tucker–Lewis index (TLI) = 0.966, root mean square error of approximation (RMSEA) = 0.026 with a 90% confidence interval of [0.025, 0.026]. Using Hu and Bentler’s (1999) model-fit cutoff criteria, namely, CFI > 0.95, TLI > 0.95, and RMSEA < 0.06, we concluded that the one-factor model fits the data excellently.
Factor Loadings of the One-Factor Model and the Bifactor.

Unidimensionality Test in DIMTEST
DIMTEST allows the users to specify a guessing parameter before the analysis, and it has been shown that guessing values matching the true value tend to produce inflated Type I error rates with the combination of large sample and short test, whereas lowering the guessing values decreases the Type I error rate, which, in the case of longer test, might be excessively stringent as the Type I error rates might drop below the nominal rate (Socha & DeMars, 2012). As EPT is a high-stakes test and we believe the consequence of a Type II error is more severe than a Type I error, we decided that the guessing value should be lowered for DIMTEST to have more power at the expense of potential inflated Type I error, and we specified in DIMTEST 0 and 0.1 as the guessing values, which are lower than 0.21—the mean estimated guessing values of a 3PL IRT model calibrated using FLEXMIRT (Cai, 2012). When the guessing value was specified as 0, the computed T statistic is 2.6707 with a corresponding p value of .0038; when the guessing value was specified as 0.1, the computed T statistic is 2.6848 with a corresponding p value of .0036. Based on these results, we rejected the null hypothesis that the EPT test is unidimensional.
Comparison Between the One-Factor and the Bifactor Model
As can be seen in the preceding section, the findings from the one-factor model approach and DIMTEST are incongruent with each other. In this section, we demonstrate how to use the bifactor approach to determine whether unidimensionality assumption should be assumed for all practical purposes, despite the disagreement between the other two methods.
The loadings on the general factor of the bifactor model are also listed in Table 2. To facilitate the comparison of the two sets of factor loadings, in the left panel of Figure 2, we plotted the factor loadings between the one-factor model and the bifactor model.

Factor loading comparison.
As mentioned earlier, the comparison of the factor loadings of the one-factor model and the general factor loadings of a corresponding bifactor model reveals the departure of the data from unidimensionality (Reise, 2012; Reise et al., 2007). The left panel shows that although the two sets of factor loadings are not almost identical, they are highly similar. The correlation between the two sets of factor loadings is .999. In other words, the choice of the bifactor model over the one-factor model has virtually no effect upon the factor loadings. Based on the similarity, we concluded that the departure from unidimensionality in the data is negligible.
The right panel of Figure 2 presents the loadings on the secondary factors in the bifactor model. They are noticeably smaller than their counterparts on the general factor, and, as can be seen, the majority of them range from −0.2 to 0.2. Such small factor loadings on the secondary factors, in contrast to the substantial general factor loadings, suggest the existence of a dominant general factor.
To further understand the proportion of variance explained by the general factor in contrast to the secondary factors, we computed the explained common variance (ECV; Reise, Moore, & Haviland, 2010), based on the following equation (where λ is factor loading, g is the general factor, and RC, SS, and CA are the three section-specific factors):

Plugging in the factor loading estimates of the bifactor model, we have ECV = 0.89, indicating that 89% of the common variance are explained by the general factor. In other words, the three section-specific factors only account for 11% of the common variance.
Discussion
In this article, we demonstrated that although there are different methods available for unidimensionality assessment, they might disagree. In such cases, the bifactor approach can be an effective tool to help determine whether unidimensionality assumption is practically tenable.
To this end, we ran a CFA with the one-factor model using Mplus and examined popular goodness-of-fit indices to determine the model fit. Results indicate that the one-factor model fits the data well. We also used DIMTEST in a confirmatory manner to test whether the data are unidimensional. We rejected the null hypothesis of unidimensionality and concluded that the unidimensionality assumption is violated for EPT.
In face of such a discrepancy, we used the bifactor approach by running another CFA with the bifactor model and comparing its factor loadings on the general factor with those of the one-factor model. Results show that the two sets of factor loadings are highly similar, and the correlation between them is greater than .999. In addition, the factor loadings on the secondary factors of the bifactor are negligible and substantially smaller than those on the general factor. Consequently, we concluded that, despite the inconsistency between the one-factor model approach and DIMTEST, ignoring multidimensionality in the current data set has no practical effects, and hence, the unidimensionality assumption holds.
We believe that when a researcher is faced with similarly ambiguous findings from different unidimensionality assessment method, the bifactor approach can serve as an excellent arbitrator by providing detailed information regarding the practical consequences of fitting a unidimensional model to a data set with multidimensional structure. In our current study, although the one-factor model approach and the DIMTEST approach do not agree, the bifactor approach shows that assuming unidimensionality does not make any practical differences, and therefore, we conclude that the unidimensionality assumption is tenable for EPT.
We illustrated, in this article, that the bifactor approach can play a critical role in determining dimensionality when other methods provide inconsistent results. It should be noted, however, that they may agree with each other in other data sets, and in such scenarios, researchers and practitioners inevitably face the question of whether the bifactor approach is necessary. We advocate that whether other unidimensionality assessment methods disagree or not, the bifactor approach can be useful to help determine, for all practical purposes, whether fitting a unidimensional model is harmful enough to bias the item parameter estimates and invalidate the ability estimates and subsequent decisions based on them. In other words, although in the current study both the factor analytic approach and the DIMTEST procedure address whether response data are unidimensional enough and provide a dichotomous answer that does not provide adequate information regarding what to do subsequently, the bifactor approach allows detailed examinations of the consequences of ignoring multidimensionality by fitting a unidimensional model. If the bifactor approach shows that the choice of a unidimensional model has no practical impact upon the factor loadings, the researcher, knowing the consequences of ignoring multidimensionality in his or her particular case, can still assume unidimensionality with the data at hand and proceed with whatever unidimensional model of choice even if the other two methods suggest otherwise.
As shown in this study, the one-factor approach and DIMTEST disagree, an interesting phenomenon that points to some possible future studies. For example, although there are a large number of studies on the performance of DIMTEST, rarely are there any comparisons between performances of the one-factor approach and DIMTEST. A simulation study might help address such methodological questions.
In regard to the dimensional structure of EPT, results of our study provide meaningful and substantial information supporting its unidimensionality. Such information can serve as valuable evidence in NCA’s decision-making process regarding the possibility of transitioning from classical test theory (CTT) to IRT.
Footnotes
Declaration of Conflicting Interests
The author(s) declared no potential conflicts of interest with respect to the research, authorship, and/or publication of this article.
Funding
The author(s) received no financial support for the research and/or authorship of this article.