
Abstract
After the Asian financial crisis in 1997, firms listed on Bursa Malaysia were allowed to repurchase their shares on the open market. The number of companies engaged in share buyback is increasing and has become a tool to stabilize price by signaling undervaluation of the share. However, studies on share buyback in Malaysia are limited to the price performance surrounding the buyback events. This study aims to fill this gap by examining long-run price performance after the actual share buyback event over a sampling period of 2 years from 2009 to 2010 for Malaysian firms listed on FTSE Bursa Malaysia. There is no evidence to conclude that there exist long-term abnormal returns using the calendar-time portfolio approach that support the inefficient market hypothesis. On the contrary, buy-and-hold method was found to be significant supporting that the Malaysian stock market is semi-strong efficient.
Keywords
Introduction
Share buyback, also known as share repurchase, refers to the action of a firm to reacquire its shares from the open market thereby reducing the number of outstanding shares. Share buyback activities have grown dramatically in the last 30 years, and it has become an increasingly important event not just in the United States or Europe, but also in Asia. The most common reason for share buyback is “undervaluation” of the company’s shares (Ikenberry, Lakonishok, & Vermaelen, 1995) and as a more flexible payout mechanism compared with dividends (Jagannathan, Stephens, & Weisbach, 2000). The history of share buyback in Asian markets started in the early 1990s in Hong Kong, Japan, Korea, Malaysia, and Taiwan. In 1991, Hong Kong legalized share buyback through the Companies (Amendment) Ordinance 1991 (Firth & Yueng, 2005) followed by Japan and Korea in 1994 (Hackethal & Zdantchouk, 2006).
In the United States, the volume and value of buyback program announcements grew from 115 (US$15.4 billion) in 1985 to 755 (US$115 billion) in 1996, at a rate of 23% per year (Jagannathan et al., 2000). Around 80% of the announced programs were carried out in the open market and the actual buyback increased from US$8.8 billion in 1985 to US$63 billion in 1996. In Malaysia, the buyback program was introduced during the financial crisis to boost the market, which is in contrast to the share buyback activity in the United States. Share buyback has reduced significantly during the recession in 2008 with a buyback value of US$339.6 billion as compared with US$589.1 billion in 2007, a reduction of 42.3% (Amenta, 2013; Taub, 2009). Due to the uncertainty of future cash flow, many firms chose to conserve capital by pulling back on expenditures including share buyback.
Share buyback has long been authorized in developed markets such as in the United States and Europe. Research has shown that buyback announcements have positive effects on the price returns (Dann, 1981; Ikenberry, Lakonishok, & Vermaelen, 2000; Masulis, 1980; Park & Jung, 2005). In the local market, studies by Jais and Chin (2001) and Lim and Bacha (2002) are consistent with the findings of more developed markets. Abnormal returns are also found in the studies of actual buyback programs in overseas markets and also in Malaysia (Isa, Ghani, & Lee, 2011; Vermaelen, 1981; Wong, Lim, & Chong, 2011; Zhang, 2005).
In Malaysia, share buyback was permitted in 1997 in the Kuala Lumpur Stock Exchange (KLSE), currently known as Bursa Malaysia Securities (Bursa), due to the depressed capital market during the Asian financial crisis. Many stocks experienced price declines with the Kuala Lumpur Composite Index plunging from 1012.84 points in July 1997 to 477.57 in January 1998. Companies are allowed to repurchase their underpriced shares to shore up the share prices, hence helping to stabilize the weakening market. By buying back their shares, the company can reduce the supply of the floating shares outstanding so that the share price will be supported or even increase eventually.
However in Malaysia, the previous findings are only limited to the price impacts surrounding the share buyback events (Isa et al., 2011; Jais & Chin, 2001; Lim & Bacha, 2002; Shahar & Abdullah, 2007; Wong et al., 2011). The effect of the long-run price performance after the actual buyback has not received adequate attention using Malaysian data. Few studies looked at the impact of share buyback on performance and indicated that the initial market reaction to the open-market share buyback announcement is incomplete (Ikenberry et al., 1995, 2000; Jagannathan & Stephens, 2003; Latif & Mohd, 2013). This suggests that the economic benefits may not be completely realized immediately, and long-term drifts of abnormal returns following the announcement exist. This is also supported by Lakonishok and Vermaelan (1990) who found that the abnormal returns remained after 2 years of buyback execution through fixed-priced tender offers repurchase. Other documented empirical evidence of delayed market reactions to other types of events exists in the form of initial public offerings (IPOs; Ritter, 1991), mergers (Agrawal, Jaffe, & Mandelker, 1992), proxy contests (Ikenberry & Lakonishok, 1993), spinoffs (Cusatis, Miles, & Woolridge, 1993), and seasoned equity offerings (Loughran & Ritter, 1995).
Ikenberry et al. (1995) discovered that the long-run abnormal returns following the repurchase execution are superior in the high book-to-market (BTM) firms, which is 45.3% above the control benchmark, unlike the market reaction to repurchase announcement which is similar across all BTM group. Zhang (2005) indicated that the price performance after the actual buyback varies with a clear and regular pattern across the BTM and firm size groups. This is consistent with a local study by Wong et al. (2011) using Malaysian data. There is increased participation by small size firms in buyback activities in Malaysia because the managers want to signal information to shareholders and media about the potential of their firms (Ramakrishnan, Ravindran, & Ganesan, 2007). This happens because there is a wider information asymmetry in smaller firms which results in them delivering superior price performance in share buyback programs compared with bigger firms.
Therefore, the long-run share price performance following a buyback event in Malaysia on the firm size and BTM ratio should be examined to determine the sustainability of the share price post-buyback based on these factors.
This research extends the existing studies by assessing those factors affecting the long-term price performance following the share buyback. It also investigates the existence of long-term abnormal returns following the buyback events to determine the effectiveness of buyback as a tool to increase and maintain share prices in the long-horizon and to conclude whether share buyback can be part of long-term investment strategy. The research investigates the long-run price performance of buyback firms compared with the benchmark following the actual buyback programs. It then investigates the effect of BTM ratio on the long-run price performance subsequent to the buyback event. Third, it investigates the effect of market capitalization on the long-run price performance after the buyback event.
This study also attempts to test the relevance of hypothesized factors that affect the long-term returns after share buyback. Many studies found that small and value firms deliver superior long-run abnormal returns following the actual buyback (Ikenberry et al., 1995; Wong et al., 2011; Zhang, 2005). Therefore, this study will look into the relationships between the market capitalization and BTM ratio with the long-term returns subsequent to buyback.
Literature Review
An early study of the long-term share price behavior following the tender offer repurchases by Lakonishok and Vermaelan (1990) showed that the repurchasing firms earn significant positive abnormal returns over 22 months after the expiration of the offer. Using data from 1962 to 1986, they found that the positive return is largely contributed by the small firms who experience a significant decline in share prices prior to the repurchase. Large firms, however, behave differently in which they experience positive abnormal returns prior to the repurchase and zero abnormal returns post-repurchase. This suggests that tender offer share buyback by large firms may be motivated by corporate restructuring activities rather than undervaluation.
Ikenberry et al. (1995) reported the same results for the open-market buyback program in the U.S. market from 1980 to 1990. By using a buy-and-hold strategy, the abnormal return over a 4-year period outperforms the market index by 12%. The results also reported that firms with high BTM ratio earned 4-year abnormal performance of 45.3% with respect to a controlled benchmark and concluded that undervaluation motivates these firms to carry out buyback. Firms in the lowest bottom two of BTM quintiles exhibit abnormal returns close to 0 or slightly negative, implying that true undervaluation was not the primary motive.
Further study done by Ikenberry et al. (2000) on the long-term performance of open-market stock repurchases in Canada found that the abnormal return over a 3-year holding period is about 7% per year. Using a sample from 1989 to 1997, they also found that high BTM firms experienced higher post-announcement returns compared with low BTM firms and suggests that better long-term performance is anticipated from repurchase motivated more by undervaluation than other motives.
M. L. Mitchell and Stafford (2000) found evidence that is consistent with Ikenberry et al. (1995) by utilizing the buy-and-hold returns approach in the U.S. market. The abnormal return over a 3-year period is 14.5%. However, their estimates using the calendar-time portfolio approach produced no evidence of long-term abnormal performance.
Grullon and Michaely (2004) found positive long-term price performance in their study of the actual repurchase. Studying U.S. market using data from 1980 to 1997, they found that 3-year post-announcement abnormal return is positively related to the current and future profitability while inversely related to the cost of capital.
Chan, Ikenberry, and Lee (2004) found in the U.S. open-market repurchase program that the long-term result suggests the market does not fully incorporate the information during the announcement of the buyback. They reported that by controlling both size and BTM effects, the abnormal return over a 4-year period is 23.56%. Chan, Ikenberry, and Lee (2007) extended their previous study by reexamining the long-run abnormal returns after the open-market repurchase announcements. Using both the buy-and-hold strategy and the calendar-time portfolio approach, they established robust and significant evidence of positive long-term share price return. They concluded that managers possess the timing ability and that the pseudo-market timing only drives a small portion of the return buyback drifts.
Yook (2010) further stratified the firms in the U.S. market into firms with actual repurchase and without actual repurchase after the announcement. Firms with actual repurchase experience significant returns over a 3-year period, whereas the firms without actual repurchase experience negative returns, although not significant. The actual repurchase firms are then further broken down into frequent and infrequent repurchasers. The results showed that infrequent repurchasers earn superior returns than frequent repurchasers.
Hong Kong and Japan are two of the very few Asian countries listed in the developed market defined by all five major financial services firms. Zhang (2005) studied the price performance subsequent to share repurchase of firms listed in Stock Exchange of Hong Kong from 1993 to 1997. The study found that the 3-year buy-and-hold abnormal return (BHAR), which is benchmarked against a portfolio of control firms, is up to 20%. The study concluded that over a long-horizon, there is strong evidence that the value-firm managers are capable of delivering superior performance to long-term shareholders.
Unlike in the United States, share repurchase was allowed in European countries at a much period due to many concerns such as creditor protection, price manipulation, unequal treatment of shareholders, and insider trading by the firms (Rasbrant, 2011). Sweden was the last country in the European Union to permit share buyback in March 2000. Similar to Hong Kong and most Asian countries, firms in Sweden are obliged to disclose their repurchase activities on a daily basis, and they are also required to obtain shareholders’ approval to authorize the repurchase programs. These are as opposed to the quarterly disclosure in the U.S. market and direct authorizations by the Board of Directors for the share repurchase programs. The daily disclosure rules may have an impact on the share price as they allow market participants to be notified of any buyback activities and related updates more frequently on a daily basis. Another interesting factor to note about share repurchase in Sweden is that the repurchase volume on the repurchase days is quite large, thus leading to a price support on the repurchase days. On average, the repurchase volume stands at 31% (median 22%) of the total outstanding shares of the firm on the repurchase days. Using data from Stockholm Stock Exchange from 2000 to 2009, Rasbrant (2011) found 6% to 7% positive abnormal performance in 12 months following the initiation announcement, and this is positively related to the portion of shares bought back in the program.
Based on the results described above, it is evident that the studies in the developed markets, especially in the United States where share buyback programs first started in the 1960s, strongly support the existence of long-horizon positive drifts in stock prices for over 3 to 4 years post-announcement and post-repurchase of both the tender offers and open-market share buyback programs.
According to Technical Committee of the International Organization of Securities Commissions (IOSCO; 2004), Asian countries are bound to more stringent regulations compared with the United States in which firms in these countries must get approval from their shareholders before executing buyback activities. Taiwan, for instance, requires firms that announce buybacks programs to buy back all the intended shares within 2 months, and failing to do so, a letter explaining the cause of failure must be produced to the Financial Supervisory Commission. In Malaysia and Singapore, the number of shares bought back by the firms is limited to 10% of the outstanding shares, as opposed to the unlimited number of shares that can be bought back in the United States. In most Asian countries, the daily disclosure of open-market repurchase is mandatory whereas it is only a discretionary in the United States. Taken together, these stricter terms could have a different impact on the long-term price performance subsequent to share buyback in Asian countries.
Lee, Jung, and Thornton (2005) conducted a study in the Korean market from 1994 to 2000. The Korean market is unique in such a way that the repurchase program must be completed within 3 months after the announcement, beginning 3 days after the decision to repurchase by the Board of Directors, unlike the share repurchase program in the United States where repurchases continue for 3 years or more after commencement (Stephens & Weisbach, 1998) or at least 1 year in other countries. Their study is aimed to eliminate the confounding effects of ongoing repurchases that could influence the long-term price performance post-repurchase and also the lagged price response due to repurchase announcement. Another feature of the Korean market is the stringent disclosure requirements that are mandatory for the repurchasing firms. A repurchasing firm is required to submit reports for both planned and completed stock repurchase via Stock Repurchase Plan and Stock Repurchase Completion Report, respectively. The firm also has to state the reason if the repurchase of targeted stock is incomplete. The price performance results then show evidence of positive abnormal performance in the 3-month period but no evidence of abnormal performance in the post-repurchase 3-year period, thus supporting the efficient market hypothesis.
Even though regulation in Korea is in essence similar to that in Taiwan (e.g., the disclosure of the stock repurchase plan, the intended percentage of shares to be repurchased, and the execution period), a study by Wang, Lin, Fung, and Chen (2013) showed an interesting result. Using data in Taiwan from 2000 to 2010, they found that the cumulative abnormal daily returns for 6 days surrounding the announcement period is 2.7% whereas the 3-year BHAR is 38.8% and 19.67% by using the calendar-time portfolio approach, thus ruling out the conclusion by Lee et al. (2005) that strict regulation is the key factor in resolving investor skepticism. This finding, however, conflicts with Su and Lin (2012), which stated that there is no evidence that the repurchasing firms experience positive and significant long-term abnormal return relative to the matching firms when using the cumulative abnormal returns (CARs) and buy-and-hold strategy. By using the calendar-time portfolio approach, Su and Lin (2012) also found significantly negative return drifts over 12, 24, and 36 months, implying that the repurchased stocks underperformed in the post-repurchase period.
Studies of share buyback are limited in Malaysia. Jais and Chin (2001) investigated 34 announced companies in 1997 to 1998 and reported that announced and implemented buyback firms earned a significant abnormal return of 3.75% over a 2-day period whereas the announced but not implemented firms earn a statistically insignificant 1.23%. Lim and Bacha (2002) extended the study using data from 1997 to 2001 with 131 announced companies and reported that announced and implemented buyback firms earned a significant abnormal return of 2.97% over a 3-day period whereas the announced but not implemented firms earn a statistically insignificant 0.01%. Shahar and Abdullah (2007), however, found no abnormal returns experienced by the actual 26 buyback firms for the tender offer share repurchase. Isa et al. (2011) found that, on average, firms earn a CAR of 1.25% over 20 trading days subsequent to the actual buyback. They also reported that there is a general price decline prior to the actual buyback day, suggesting that managers tend to time their repurchase after several days of successive price drops. Wong et al. (2011) also reported a significant positive return of 0.53% over 20 trading days subsequent to the actual buyback. They also found that the abnormal return is affected by the firm size and BTM ratio. A recent study done by Latif and Mohd (2013) to investigate the signaling and substitution hypotheses in Malaysian firms found that the signaling hypothesis was supported but not the substitution hypothesis.
The study of motivations that drive the implementation of buyback in Malaysia has been conducted by Zainudin and Regupathi (2003) who stated that most of the reasons for buyback are to stabilize share price, pay stock dividend, and as investment and increase earnings per share. The signaling hypothesis, however, is not mentioned in the study. Ramakrishnan et al. (2007) complemented this by concluding that managers used share buyback as an effective information signaling tool to the investors.
These are empirical studies of share price performance surrounding the buyback events. No study of long-term price performance following a repurchase has been documented in Malaysia.
Method
A research framework has been developed based on a review of literature to determine whether share repurchase can be used to increase the share price in the long run and, therefore, be used as a long-term investment tool.
This study covers open-market share buyback programs for all 865 Malaysian firms listed on the Main Market of Bursa Malaysia from 2006 to 2010. Based on a related local study by Isa et al. (2011), the financial crisis period should be excluded from the sample as it may clutter the results. Similar studies in the U.S. market also exclude the financial crisis periods, for example, in 1987 and 1997 as they want to avoid having unusual repurchases dominating their studies (Chan et al., 2007; Grullon & Michaely, 2004; Ikenberry et al., 1995; Stephens & Weisbach, 1998; Zhang, 2005). According to Gurcharan, Wong, and Folk (2010), the global financial crisis that started with the U.S. sub-prime mortgage in 2007 and 2008 led to serious financial challenges globally, including in Malaysia. Therefore, open-market share buyback programs for all 865 Malaysian firms from 2009 to 2010 are considered in this study.
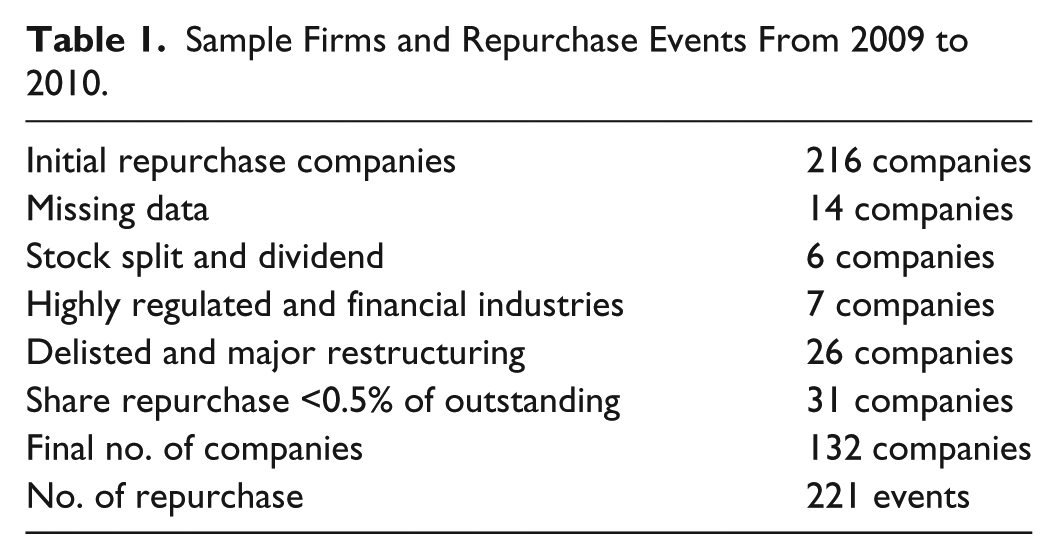
Firms that are not engaged in share buyback programs are excluded from the subsequent study, leaving only a total of 216 firms taken into consideration. Out of this number, 26 firms have been delisted or involved in major restructuring, stock split, and dividend distribution within the study period. Seven firms in utility and financial services sectors are also excluded from the sample as these firms have different regulatory settings and are imposed with various requirements that may influence the profitability (Latif & Mohd, 2013; Lee et al., 2005). Twenty firms with incomplete daily prices and financial information are also not included in the sample.
Based on a study by Isa et al. (2011), daily transaction size in Malaysia is typically very small, with 98% being below 0.5% of the total outstanding shares. The sporadic pattern of buyback implementation could be due to the managers being cautious in their repurchase strategies and does not project management confidence to suggest the undervaluation of the shares. To ensure that repurchase implementation presents a measurable impact financially, only firms that have bought back cumulatively 0.5% of their outstanding shares within the sampling period are included in the final sample. Finally, a total of 221 share buyback events is recorded for the 132 firms studied during the period. Table 1 below shows the sampling criteria followed to reach the final sample.
Sample Firms and Repurchase Events From 2009 to 2010.
Data such as daily share prices, BTM ratio, and market capitalization for the firms listed on the Main Market of Bursa Malaysia from January 2009 until December 2013 are extracted out from Bloomberg terminal service and exported to Microsoft Excel for further analysis. This includes the yield of Malaysian Treasury Bill and the daily prices of FTSE Bursa Malaysia KLCI Index (FBMKLCI), FTSE Bursa Malaysia (FBM) Small Cap, Morgan Stanley Composite Index (MSCI) Malaysia Value, and MSCI Malaysia Growth indices for the market return and factors.
The information on share buyback dates, volumes, and values are obtained from Bursa Malaysia’s website and Bloomberg terminal.
Similar studies in the emerging and developed markets define a 3-year period as an appropriate measure for long-term performance (Grullon & Michaely, 2002; Ikenberry et al., 2000; Lee et al., 2005; M. L. Mitchell & Stafford, 2000; Wang et al., 2013; Zhang, 2005). In this study, the abnormal return for a multiple event window periods subsequent to the actual share buyback is the dependent variable.
The independent variables include the BTM ratio of the firm, which is taken from the nearest announced value prior to the actual buyback event and the market capitalization of the firm on the actual buyback event.
The hypotheses examined in this study will be tested using the standard event study methodology popularized by Fama, Fisher, Jensen, and Roll (1969) in capturing the price reaction to new information. This model was later used by Zhang (2005) and Hackethal and Zdantchouk (2006) to measure the abnormal returns surrounding the buyback events. Based on the literature and research objectives, the study’s hypotheses are formulated.
Lakonishok and Vermaelan (1990) reported a significant positive abnormal buy-and-hold return over 22 months after the expiration of the offer. The same results are also reported by Ikenberry et al. (1995) for the open-market buyback program. By using the same strategy, the abnormal return over a 4-year period outperforms the market index by 12%. This result is evidence not only in a developed market but also in the emerging market (Wang et al., 2013).
In contrast to the short-run method, “the analysis of long-run abnormal returns is treacherous” (Lyon, Barber, & Tsai, 1999). The reality of price over-reaction and under-reaction subsequent to an event seems to point to market efficiency. However, Fama (1998) pointed out that long-run return anomalies, regardless of under-reaction or over-reaction, are chance results and, hence, consistent with the efficient market hypothesis. The long-run return anomalies will disappear if reasonable methods are used. Most previous studies that reported positive long-run abnormal returns use the BHAR method (Chan et al., 2004, 2007; Ikenberry et al., 1995, 2000; Lakonishok & Vermaelan, 1990; Zhang, 2005). Barber and Lyon (1997) and MacKinlay (1997) proposed the BHAR method over the CAR, as CAR will produce significant biases as a result of a new listing, rebalancing, and skewness. They also claimed that BHAR is the appropriate measure because it reflects the investor experience.
Fama (1998) argued against the BHAR method as it suffers from cross-correlation and bad model problems. He suggested a monthly calendar-time portfolio abnormal return (CTIME) approach as a substitute. This approach was first used by Jaffe (1974) and Mandelker (1974) by tracking the performance of event-firms’ portfolio in calendar-time relative to either an explicit asset pricing model or a benchmark.
Lyon et al. (1999) then extended their prior study by comparing BHAR and CTIME, and concluded that both methods have their advantages and disadvantages. The advantage of BHAR is that it yields an abnormal return that mirrors the investor experience whereas the disadvantage of this approach is its high sensitivity toward the problem of cross-sectional dependence among sample firms and a poorly specified asset pricing model. Meanwhile, the advantage of CTIME is that it can handle the cross-correlation problem and is less sensitive to the poorly specified asset pricing model. However, CTIME yields an abnormal return that does not accurately measure the investor experience.
M. L. Mitchell and Stafford (2000) also compared the reliability of BHAR and CTIME approaches using mergers, seasoned equity offerings, and share repurchases. They found that unlike CTIME, BHAR is not an adequate methodology as it assumes independence of multiyear event-firm abnormal returns.
This study seeks to minimize the confounding effect due to multiple repurchase programs by a firm within the study window. The confounding effect will contaminate the clean estimation of price performance subsequent to the first repurchase if the firm announces or carry out another new repurchase programs within the estimation period of the first repurchase. The new announcements or actual repurchases would produce the noise effect that is incorporated in the evaluation of returns of the first repurchase. Therefore, this study used both methods carried out by M. L. Mitchell and Stafford (2000) in using CTIME and also the standard method, BHAR approaches, to estimate the abnormal return.
For the BHAR method, the difference of a sample firm’s daily compounded returns and the benchmark daily compounded returns are calculated for three window periods, 1 year (0, 1), 2 year (0, 2), and 3 year (0, 3) following the actual repurchase day (Zhang, 2005). The BHAR of firm i and event date t is defined as follows:

where BHARi,t1 − T is the buy-and-hold return of buyback firm i from day t1 to day T. Ri,t is the return of the buyback firm during day t and Rb,t is the return of the benchmark. The calculation of long-term abnormal return can be very sensitive to the selection of benchmark (Barber & Lyon, 1997; Gray & Whittaker, 2003; Kothari & Warner, 1997). Gray and Whittaker (2003) proposed a matched-firm benchmark based on size and industry, for it has lower levels of bias as measured by mean squared error (MSE). However, in this study, index benchmark is used based on the firm size. FTSE Bursa Malaysia Small Cap Index (FBMSC) is used as a benchmark for firms with a market capitalization of RM1,300 Mil and below, FTSE Bursa Malaysia Mid 70 Index (FBM70) for firms between RM1,301 Mil and RM10,000 Mil, and FBMKLCI for firms with size above RM10,000 Mil.
The statistical test of BHAR is based on the equal-weight cross-average which is calculated as follows:

By using this alternative approach, an equal-weight portfolio of firms is constructed consisting of all firms that have implemented buyback programs within the previous 36 months, supposed a 3-year period of abnormal returns are to be analyzed. Portfolios are rebalanced monthly to include firm that has just executed a transaction and also to exclude firms that reach the end of their 36-month period. The monthly abnormal return earned by this portfolio is defined as the portfolio’s excess return. As opposed to the BHAR method in which the abnormal return is calculated from each of the event-firms, the excess returns from the CTIME method are regressed on the three Fama–French (Fama & French, 1993) factors as these are the monthly portfolio returns of the event-firm.
The three Fama–French (Fama & French, 1993) as follows:

where Rp,t is the portfolio’s return in month t; Rf,t is the risk-free rate (3-month Malaysian T-bill); Rm,t is the monthly market return in month t; SMB t is the average return on small market capitalization portfolio minus the average return on large market capitalization portfolio; HML t is the average monthly return on high BTM equity portfolios minus the average monthly return on low BTM equity portfolios (refer to Fama and French, 1993, for a detailed description of SMB t and HML t ). The ordinary least square regression is estimated on portfolio returns. The intercept, alpha, is the measure of the average monthly abnormal return on portfolios of buyback firms (Latif, Mohd, Hussin, & Ismail, 2013; Yook, 2010).
In the work of Fama and French (1993), the factors of SMB and HML are self-constructed. However, in this study, market portfolios that are readily available in the market are utilized to represent the SMB and HML factors. In Malaysia, Abdullah, Hassan, Redzuan, Muhammad, and Abdullah (2013) used market indices as a proxy for those factors. The return differential between FBMSC (a proxy for small capitalization portfolios) and FBMKLCI (a proxy for large capitalization portfolios) is used as the SMB factor. For the HML factor, this study uses the return differential between MSCI Malaysia Value Index (a proxy for high BTM ratio portfolios) and MSCI Malaysia Growth Index (a proxy for low BTM ratio portfolios).
Based on Yook (2010) and Su and Lin (2012), the event windows are defined as from Month 0 to Month 12 (0, 12), from Month 0 to Month 24 (0, 24), and from Month 0 to Month 36 (0, 36) in which Month 0 is the month of actual share repurchase.
In reference to the findings that use CTIME as a method of calculation (Lee et al., 2005; M. L. Mitchell & Stafford, 2000; Su & Lin, 2012; Yook, 2010), this study suggests that the firms involved in the actual share repurchase program will earn a very small insignificantly positive or significantly negative long-term abnormal return. Using those different methods, the first hypothesis that the study is proposing is as follows:
The BTM ratio has also been identified as another important factor by local and overseas researchers in determining the share price performance following share buyback programs (Chan et al., 2004; Ikenberry et al., 1995; Vermaelen, 1981; Wong et al., 2011; Zhang, 2005). By using buy-and-hold returns over 4 years, Chan et al. (2004) found that high BTM companies have larger returns over their matched sample which is 28.35% compared with 22.92% for low BTM companies. Firms with high BTM, or “value stocks,” were also proven by Hackethal and Zdantchouk (2006) to have outperformed the “glamour stocks” or firms with low BTM by 45%.
Market capitalization has been identified as an important factor by local and overseas researchers in determining the share price performance following share buyback programs (Chan et al., 2004; Ikenberry et al., 1995; Vermaelen, 1981; Wong et al., 2011; Zhang, 2005). These studies including Ramakrishnan et al. (2007) found that information asymmetry which has caused greater undervaluation and mispricing is larger in small firms due to less public disclosure and focus by the analysts as compared with bigger firms. Zhang (2005) concluded that smaller firms have higher abnormal returns, which are 0.95% in the immediate response and 2.78% in 20 trading days after the event as compared with −0.134% and −1.549% for larger firms.
Based on findings that use BHAR as a method of calculation(s), this study suggests that the firms involved in the actual share repurchase program will earn positive and significant long-term abnormal returns.
Finally, the information on the firms’ share prices, event dates, and return model are consolidated and processed in Event Study Metric software to calculate the abnormal returns and to obtain the statistical analysis.
Results and Discussion
The final sample consists of 221 open-market share buyback events carried out by 132 firms listed on the Main Market of Bursa Malaysia within the study window.
Table 2 shows the share buyback activities recorded for all the 132 sample firms from January 2009 to December 2010. One hundred thirty-two participating firms reported a total of 221 events of share buyback in the entire study period. Panel A in Table 2 shows the different repurchase events done by those firms. Half of the firms have a repurchase event within 25 days whereas the rest have more than 25 days.
Summary of the Total Share Buyback Activities in Bursa Malaysia From January 2009 to December 2010 for the 132 Sample Firms.
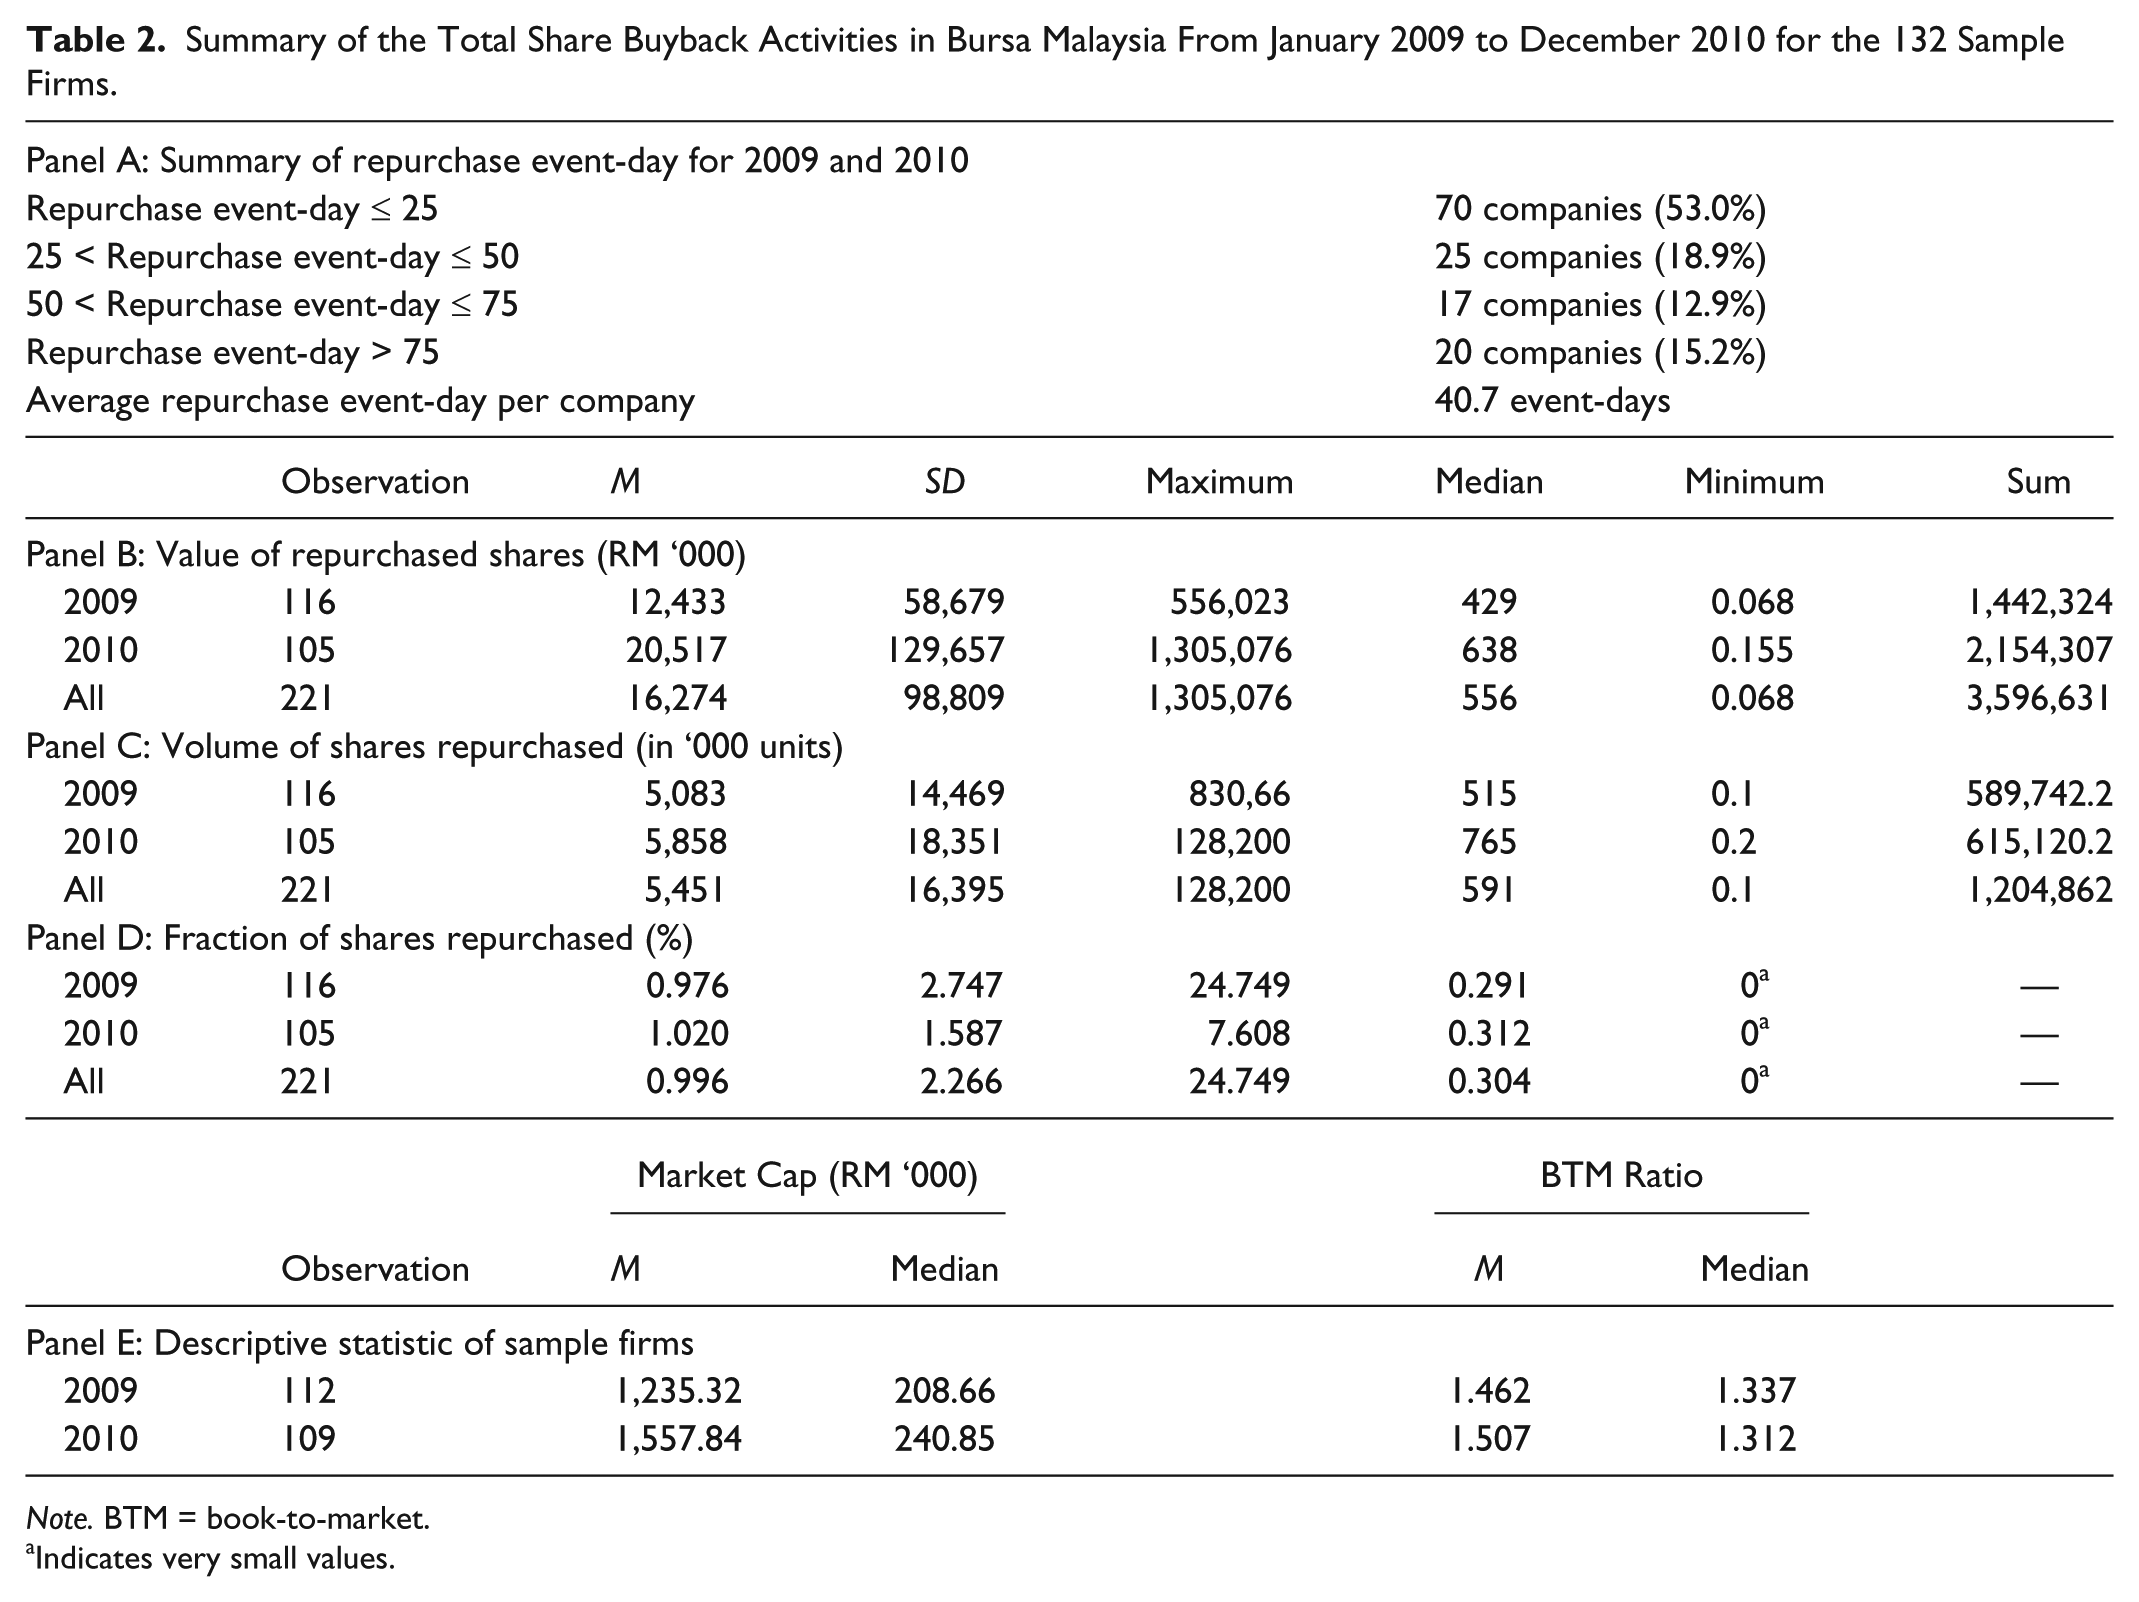
Note. BTM = book-to-market.
Indicates very small values.
Panel B shows the increase in dollar value of the shares repurchased accordingly. Panel C illustrates that the number of shares repurchased increased from 2009 to 2010, even though the number of events recorded decreased. This may be due to the increase in the volume of repurchases in one execution. Many firms may be changing strategy by buying back their shares in large amounts per transaction to gain measurable price support. This is supported by the figures in Panel D in which the mean and median of the percentage of shares repurchased based on the outstanding shares are also increasing.
This table also shows that there is a greater difference between the median and the mean for Panels B and C. The median that is less than the mean indicates that the distributions are positively skewed and the greater difference between those values shows that there are several firms in the sample that carried out considerably higher volume and dollar value of share repurchase than the rest of the firms in the sample. Panel E also shows positively skewed distributions for the market capitalization and BTM ratio of the sample firms. However, there is a greater difference between the median and mean of the market capitalization, and this indicates that the sample contains more small size firms whereas based on the BTM ratio, the sample is practically normal.
Abnormal returns are computed using BHAR and CTIME over three time periods: 1 year (0, 1), 2 years (0, 2), and 3 years (0, 3) as mentioned in the “Method” section. The results for BHAR and CTIME are shown in Tables 3 to 9.
Full Sample Post-Repurchase Performance Calculated Using BHAR for Three Time Periods.

Note. BHAR = buy-and-hold abnormal return.
Post-Repurchase Performance Calculated Using BHAR for Three Time Periods Based on BTM Ratio.
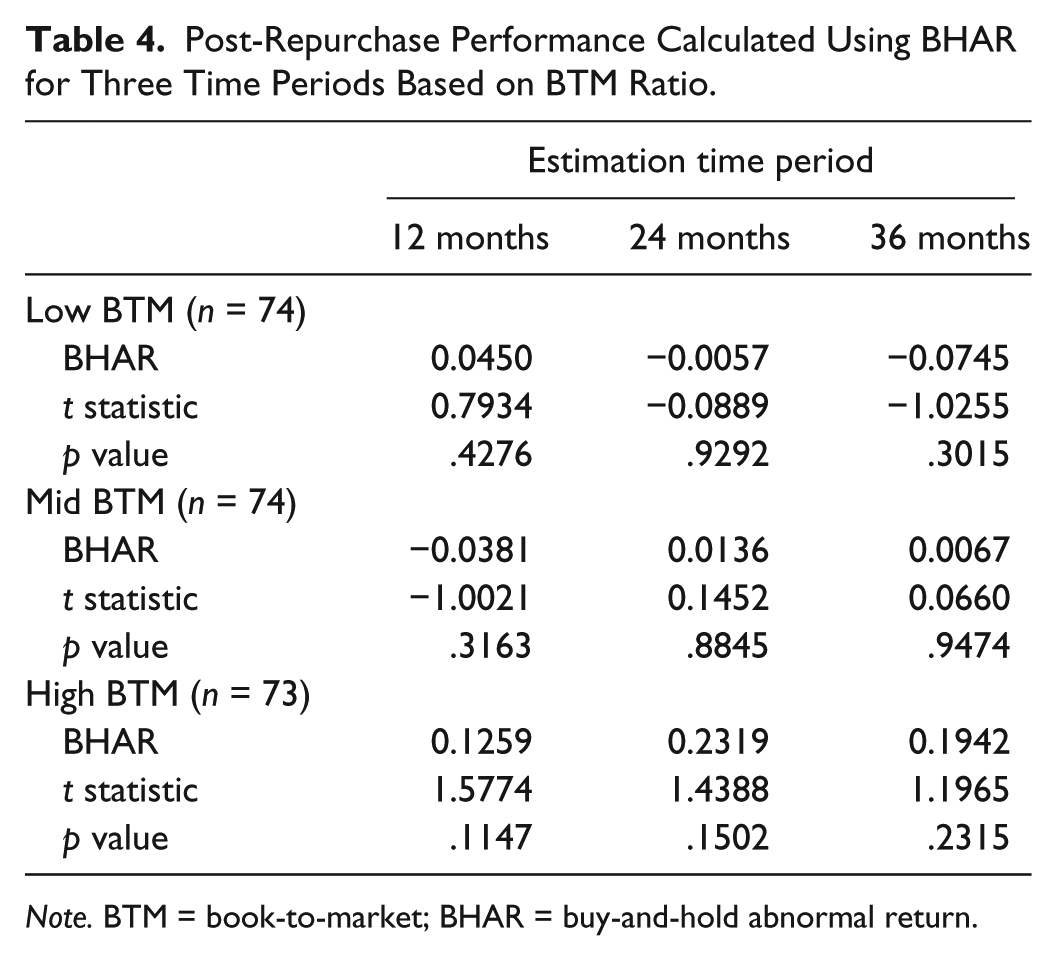
Note. BTM = book-to-market; BHAR = buy-and-hold abnormal return.
Post-Repurchase Performance Calculated Using BHAR for Three Time Periods Based on Market Capitalization.

Note. BHAR = buy-and-hold abnormal return; MCAP = market capitalization.
Descriptive Statistics of the Averaged Abnormal Returns for the Full Sample Event-Firm Using CTIME.
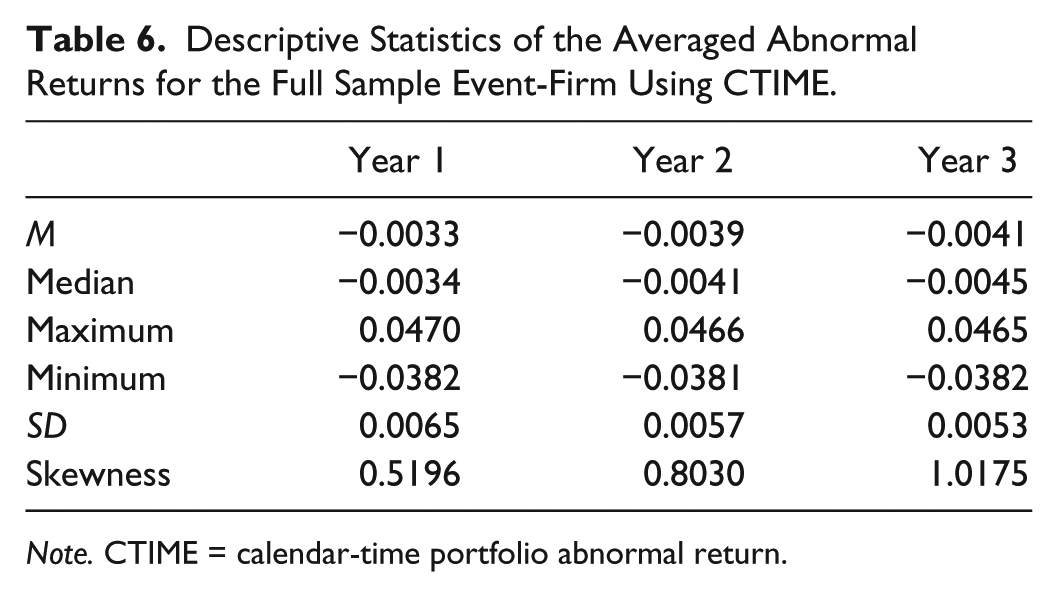
Note. CTIME = calendar-time portfolio abnormal return.
Full Sample Post-Repurchase Performance Calculated Using CTIME for Three Time Periods.

Note. CTIME = calendar-time portfolio abnormal return.
Post-Repurchase Performance Calculated Using CTIME for Three Time Periods Based on BTM Ratio.
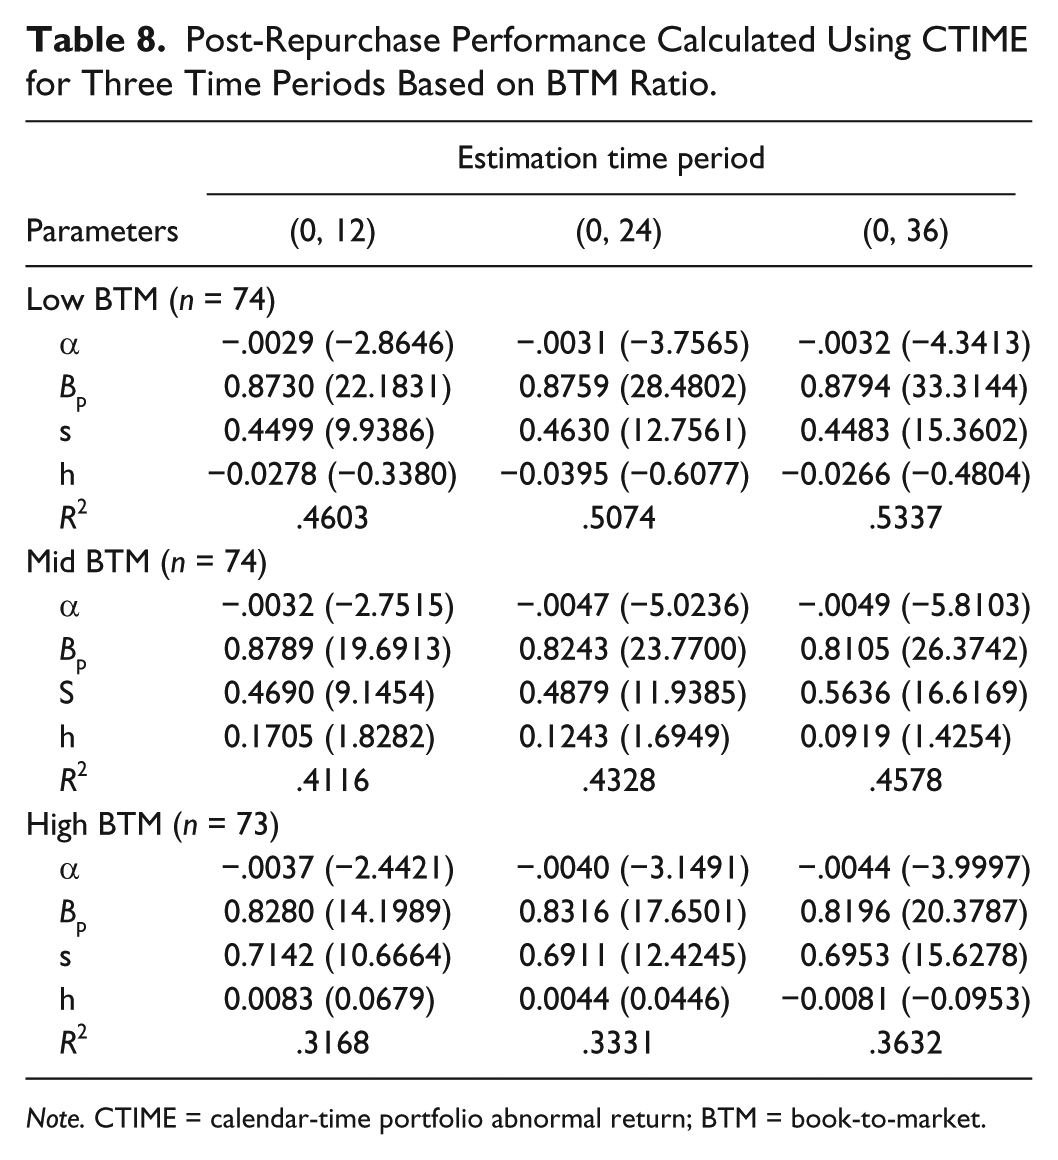
Note. CTIME = calendar-time portfolio abnormal return; BTM = book-to-market.
Post-Repurchase Performance Calculated Using CTIME for Three Time Periods Based on Market Size.

Note. CTIME = calendar-time portfolio abnormal return; MCAP = market capitalization.
The full sample of 221 events is analyzed for 132 firms involved in share buyback for the years 2009 and 2010. The daily BHAR for each event is calculated relative to the specified market index for the whole sample period of 780 trading days (for a 3-year period) by using Equation 2. The daily BHARs for all the events are then averaged to get the daily average buy-and-hold abnormal return (ABHAR) using the formula below:

Table 3 shows the long-term price performance for the full sample event-firms calculated using BHAR method for different time periods. This result is consistent with Zhang (2005), Ikenberry et al. (1995), and Chan et al. (2007). It means returns are not significantly different from 0 at the nominal 5% significance level when looking at the p values and t values. We can conclude that the first year abnormal return is only significant at 21% significance level whereas the second year abnormal return is significant at the 22% level. Overall, this result does not support the under-reaction hypothesis, even though the market is seen as adjusting slowly from the first year to the subsequent years and the long-term performance is positive.
Following Fama and French (1992), many studies reported that BTM ratio and firm size significantly influence cross-sectional stock returns and the subsequent market performance. It is evident that small firms with high BTM ratio are the main contributors to the positive market performance subsequent to buyback events (Chan et al., 2004; Ikenberry et al., 1995; Vermaelen, 1981; Wong et al., 2011; Zhang, 2005).
The sample is then divided into three portfolios, each containing 73 to 74 firms according to the BTM ratio as shown in Table 4. Assuming the managerial timing exists, this study expects to observe higher drifts for the “value stock” who are the frequent repurchasers.
However, the probability that all the abnormal returns obtained in this analysis are due to chance is more than 5% significance level as the p values for all returns are more than .05 (p > .05). Nonetheless, the abnormal returns for the 12 months and 24 months of high BTM firms are significant at 15% significance level with p values equal to .1147 and .1502, respectively. This implies that the empirical results of this analysis are not robust enough to support the hypothesis that high BTM firms outperform the low BTM firms in the long run subsequent to the actual share repurchase, even though the return drifts for high BTM firms is more positive and increasing over time, as expected.
The full sample is also divided into three subgroups based on the market capitalization to examine the return drifts across the firm size as shown in Table 5. Literature review discussed the literature that pointed out that information asymmetry is higher for smaller firms. Hence, any new information should give a higher price adjustment. Consistent with Ramakrishnan et al. (2007), 115 out of 132 firms captured in the sample are the constituents of the FBM Small Cap. Table 5 shows that the abnormal returns for the smallest firm size are 6.12%, 22.38%, and 28.11% for the 12-, 24-, and 36-months holding periods.
However, the probability that all the abnormal returns obtained in this analysis occurred due to chance is more than 5% significance level as the p values for all returns are more than .05 (p > .05). Even though the abnormal return of small firms in the 2-year and 3-year periods are high and positive (22.38% and 21.81%, respectively), they are only significant at the 25% level. Nonetheless, the return of large firms for the first year is the most significant among others (20% level). This implies that the empirical results of this analysis are not robust enough to support the hypothesis that small firms outperform the large firms in the long run subsequent to the actual share repurchase, even though the return drifts for small firms are more positive and increasing over time, as expected.
Table 6 shows the descriptive statistics for abnormal returns using the CTIME approach. The monthly portfolio abnormal returns are calculated using Equation 3. Based on the three time periods, the mean, median, maximum, minimum, standard deviation, and skewness of abnormal returns are then obtained from the monthly portfolio abnormal returns.
Table 7 clearly shows that no evidence of long-term abnormal performance was found in the full sample. This approach produces negative monthly average abnormal returns for all three time periods and is consistent with Su and Lin (2012) who are also using CTIME in their calculations. Meanwhile, other studies using the same method, M. L. Mitchell and Stafford (2000), Lee et al. (2005), and Yook (2010) found very low monthly average abnormal returns with very weak t statistics (0.08%, 0.0063%, and 0.03%, respectively), which is equivalent to less than 3% for 3 years. The data quality for the regression parameters shows that this study has a slightly decent fit with the data, with the raw R2 ranging from .64 to .68, which implies that the three factors explain 64% to 68% of the abnormal returns. The traditional beta of the portfolio, βp, is around .85, which is close to 1 and is significant to the 1% significance level, which is expected as a typical equity-only portfolio. The SMB loading s = 0.54 for the first and second year while s = 0.56 in the third year are also statistically different from 0 at 1% level, which means that the portfolio contains mostly small cap firms (s > 0.5). The HML factor h ranges from 0.04 to 0.03 and 0.01 for the 12, 24, and 36 months, respectively. This means that the portfolio is a growth portfolio in general (h < 0.3), albeit the insignificant value. The insignificant values for all h-loading in all the analyses may be because the portfolio is not significantly affected by the firm’s value premium.
Looking into the 3-year holding period, the alpha value indicates a monthly abnormal performance of −0.41% with a very significant t statistic (t = −7.5662). Compounding this monthly return over 36 months implies a 3-year abnormal performance of −13.74%. The monthly abnormal returns are also becoming more negative over the period with strong significant t values. This result suggests that repurchasing firms have severe underperformance in the long-horizon subsequent to the actual share repurchase. Therefore, the long-run investors cannot benefit from the firms’ buyback programs.
To check whether the long-term abnormal return is concentrated in small firms and in “value firms,” the sample is further partitioned into three subgroups based on the BTM ratio and the firm size. Tables 8 and 9 show the results, respectively. To be consistent with the previous studies, it is expected that only high BTM and small firm groups have high positive and significant intercepts. This study, however, shows negative and significant alpha values instead. Yook (2010) confirmed this finding as there is no clear pattern in the occurrence of positive and significant intercepts (α) in both analyses. In fact, the negative intercepts show a reversal pattern from the expectation. Assuming a 3-year holding period, the alpha value for high BTM firms is more negative (−0.44%) as compared with the low BTM firm (−0.32%), whereas the small firms group earns a more negative monthly abnormal returns (−0.55) in comparison with the large firms group (−0.27%). Therefore, it is concluded that in this sample, small firms do not outperform large firms and “value stocks” do not outperform “growth stocks” based on the calculation using CTIME for all three time periods. These results are also consistent with Yook (2010) and Su and Lin (2012) but inconsistent with the results calculated using BHAR as demonstrated in Tables 3 to 5. Therefore, based on BHAR, there is no evidence of over- or under-reaction, whereas based on CTIME, there is clear evidence of over-reaction that leads to negative performance.
Conclusion
Share repurchase is a relatively new phenomenon in Malaysia, and the effects of the actual implementation are still not widely discussed, especially regarding the long-term performance. The purpose of this article is to examine the long-term price performance subsequent to the actual buyback in the Malaysian market. The patterns of abnormal returns are also examined across BTM ratio and firm size.
This study has implications for interested parties. Even though Isa et al. (2011) stated that in the short-term share, repurchase can benefit firms and investors in Malaysia, with regard to longer horizon, this may not be the case. Lee et al. (2005), Yook (2010), and Rasbrant (2011) also proved that the total amount of share repurchased provides a significant result of long-term outperformance by the repurchasing firms. At this moment, in Malaysian market, Isa et al. (2011) and Wong et al. (2011) found no evidence of abnormal returns with respect to buyback volume. This implies that the restricted amount of shares that can be bought back does not provide strong price support to the stocks. Therefore, the policymakers should look into the restriction and the impact it has on firms.
Even though Ramakrishnan et al. (2007) found an increasing number of small firms participating in buyback activities, there is weak evidence discovered in this study that relates the small and value firms to the superior long-term returns as compared with the larger firms. Thus, although the firms are relatively undervalued, repurchasing shares may not benefit the long-term shareholders.
Overall, the results of this study provided strong support for the efficient market hypothesis and ruled out the theory of market under-reaction subsequent to repurchase announcement by using BHAR methodology. On the contrary, market inefficiency is supported by the results of CTIME.
This study only uses 2 years (2009-2010) out of 5 years (2006-2010) of sampling period as the other 2 years (2007-2008) are in the financial crisis period. The year 2006 cannot be taken into consideration as the estimation period of the consecutive years includes the crisis period. This makes the sample smaller as the estimation period of 3-year ahead is needed to evaluate the long-term performance. We suggest that the sampling period should be extended to a longer time frame to provide a more accurate study.
Assessment for frequent and infrequent repurchasers can be done to identify whether the frequency of repurchase has an effect on the long-term performance. This has been done in the U.S. market by Yook (2010) and Chan et al. (2007) as well as in the Korean market by Lee et al. (2005). They found that infrequent repurchasers earned much better price performance than frequent repurchasers.
With respect to the results presented in “Results and Discussion” section, some returns anomalies detected appear to contradict the expected pattern, for example, the mid-BTM return that is lower than the low BTM return. Bhunia (2011) obtained the same finding, and he investigated the matter further. He found that earnings growth also has high influential power on the abnormal returns of the repurchasing firms apart from the BTM ratio. This could be done in the future research in the Malaysian market.
Separate evaluation can also be done by including the crisis period in the sample, or by separating the crisis and non-crisis period in the results. This is important as during different economic conditions, investors may react differently to information in the market. A firm may experience different nature in activities during this period including share buyback. Therefore, external factors should be considered in the future study to better understand the effect of the economic conditions of the abnormal returns.
Footnotes
Declaration of Conflicting Interests
The author(s) declared no potential conflicts of interest with respect to the research, authorship, and/or publication of this article.
Funding
The author(s) received no financial support for the research and/or authorship of this article.