
Abstract
The Universiti Sains Malaysia Emotional Quotient Inventory (USMEQ-i) is a Malay-language emotional intelligence (EI) inventory that was based on a mixed-model approach of EI. It was specifically developed and validated for use among medical course applicants. However, evidence to support its use among medical students is inadequate. This study aims to provide further construct validity evidence for the USMEQ-i among medical students through confirmatory factor analysis (CFA). A cross-sectional study was carried out on a sample of 479 medical students in Universiti Sains Malaysia (USM). After a preliminary analysis, data from only 317 respondents were found suitable for inclusion in CFA. CFA was performed using the maximum likelihood estimation method with bootstrapping due to the nonnormality of items at the multivariate level. The results of the analysis support the two-factor model of the EI component and the one-factor model of the faking component. However, the USMEQ-i should be administered with caution until further cross-validation studies are conducted among students in other medical schools in Malaysia.
Keywords
Introduction
Emotional intelligence (EI) is defined as the ability to perceive, express, understand, motivate, control, and regulate emotion (Goleman, 1995, 1998; Myers, 2005; Salovey & Mayer, 1996). Previous studies have shown that EI is a determinant of success in various occupational settings (Gazzard, 2002; Habibah et al., 2007). Research has also indicated that EI predicts social relationships, family relationships, work performance, academic performance, physical health, and psychological well-being (Mayer, Roberts, & Barsade, 2008).
In the medical education context, studies have found that high EI is positively associated with doctor–patient relationships, interpersonal skills, communication skills, teamwork, empathy, organizational commitment abilities, stress management, and examination performance on specific areas such as clinical, diagnostic, and prognostic abilities (Arora et al., 2010). In addition, results from a prospective study indicated an association between preadmission EI and the psychological health of medical students during first-year medical training (Yusoff, Esa, MatPa, Mey, & Aziz, 2013). Grewal and Davidson (2008) reported that the doctor’s EI is positively associated with the patient’s trust, which in turn results in a better doctor–patient relationship and treatment compliance, as well as improved patient satisfaction with the doctor and hospital. They also found a significant association between the health care team’s EI and the team’s effectiveness. In short, EI plays important roles that are closely related to medical doctors’ competency.
There are three theoretical approaches to EI: the specific-ability approach, the integrative-model approach, and the mixed-model approach (Mayer et al., 2008). The specific-ability approach focuses on specific skills that are considered fundamental to EI. Examples of inventories based on this approach include the Diagnostic Analysis of Nonverbal Accuracy 2, the Japanese and Caucasian Brief Affect Recognition Test, and the Levels of Emotional Awareness Scale. The integrative-model approach combines a number of relevant abilities to obtain an overall sense of EI. Examples of inventories based on this approach include the Emotion Knowledge Test, the Mayer–Salovey–Caruso Emotional Intelligence Scale, and the Multibranch Emotional Intelligence Scale. The mixed-model approach uses a broad definition of EI, which includes noncognitive capability, competency, or skill; emotionally and socially intelligent conduct; and personality dispositions. The approach encompasses diverse psychological traits, abilities, styles, and other characteristics of EI. The Emotional Quotient Inventory (EQ-i), Self-Report Emotional Intelligence Test (SREIT), and Multidimensional Emotional Intelligence Assessment (MEIA) are examples of inventories based on this approach.
The Universiti Sains Malaysia Emotional Quotient Inventory (USMEQ-i) is a Malay-language EI inventory that was based on the mixed-model approach. It was developed to measure EI among medical course applicants in Malaysia (Yusoff, Rahim, & Esa, 2010). The USMEQ-i also underwent a validation process by means of exploratory factor analysis (EFA; Yusoff et al., 2011) and confirmatory factor analysis (CFA; Arifin, Yusoff, & Naing, 2012). In a preliminary validation study among medical students, Yusoff (2012) reported that the USMEQ-i has good test–retest and internal consistency reliabilities. However, this evidence is still inadequate to support the construct validity of the USMEQ-i among students. Stronger evidence of its validity can be provided by CFA.
CFA is superior to EFA and simple reliability analysis (test–retest and internal consistency reliabilities) in many respects. CFA is a type of structural equation modeling (SEM) that is concerned with measurement models (Brown, 2006). It is advantageous to use CFA to verify the relationships between items and their respective factors because it allows the fixing of these relationships in the measurement model and provides ways to assess the fit of the proposed theoretical model to the collected data (Brown, 2006; Stevens, 2009). Thus, CFA is considered an indispensable tool for validation in social and behavioral sciences (Brown, 2006).
Given the advantage of CFA, this study aims to provide further evidence for the construct validity of the USMEQ-i among medical students through an evaluation of its measurement model validity by CFA.
Method
Study Population
A cross-sectional study was carried out among medical students of the School of Medical Sciences at the Universiti Sains Malaysia (USM) from March to May 2011. In the school, study years are divided into three phases: Phase I (first and second years), Phase II (third and fourth years), and Phase III (fifth year). The first-, third-, and fifth-year medical students in 2011 were taken as a sampling frame because they were considered representative of each phase. Second- and fourth-year medical students were intentionally excluded because those years have been found to be a stressful period for students (Yusoff, Rahim, & Yaacob, 2010). Thus, data from these students might not reflect a stable mental state among the students.
Sample Size and Sampling Method
A total of 460 students were required for a CFA of 46 items in the inventory, following Bentler and Chou’s (1987) suggestion for a minimum subjects-to-item ratio of 10:1. The required sample size was inflated to 512 students to factor in a 10% drop-out rate. Stratified random sampling was applied, with the phases and students’ gender as the stratification variables (Table 1). These strata were chosen because the stratum-specific proportions varied between student intakes over the years.
Strata Size and Required Sample Size.

Measurement Tool
A preliminary version of the USMEQ-i was used in this study. This version was construct validated by EFA (Yusoff et al., 2011), as opposed to the final version of the USMEQ-i that was construct validated by CFA in a study by Arifin et al. (2012). In view of the possibility that the remaining items as validated among medical students might differ from the remaining items as validated among medical course applicants after CFA, the preliminary version with a larger pool of items was deemed preferable in this validation study.
The inventory has two distinct components: the EI component and the faking component. The EI component consists of 39 items that are clustered under seven factors: control, maturity, conscientiousness, awareness, commitment, fortitude, and expression. Alternatively, based on the confirmatory study, the items could be clustered under two factors: personal competence and social competence (Arifin et al., 2012). The faking component is a unidimensional component that is meant to measure the tendency of respondents to overrate themselves (Yusoff, Rahim, & Esa, 2010). It consists of seven items that are clustered under the faking index. Each item in the inventory was rated on a 5-point Likert-type scale (0 = not like me, 1 = a bit like me, 2 = quite like me, 3 = a lot like me, and 4 = totally like me). All the items have factor loadings of more than 0.3, and the Cronbach’s alpha values for the factors range from .603 to .899 (Yusoff et al., 2011).
An overview of the factors and items under the EI and faking components is presented in Table 2. Detailed descriptions of each factor and a list of items are included in the online manual of the inventory (see the link provided in the Authors’ Note). The seven-factor model (EI-VII) and two-factor model (EI-II) of the EI component and the one-factor model (FI) of the faking component were evaluated for measurement model validity.
Model Factors and Items.
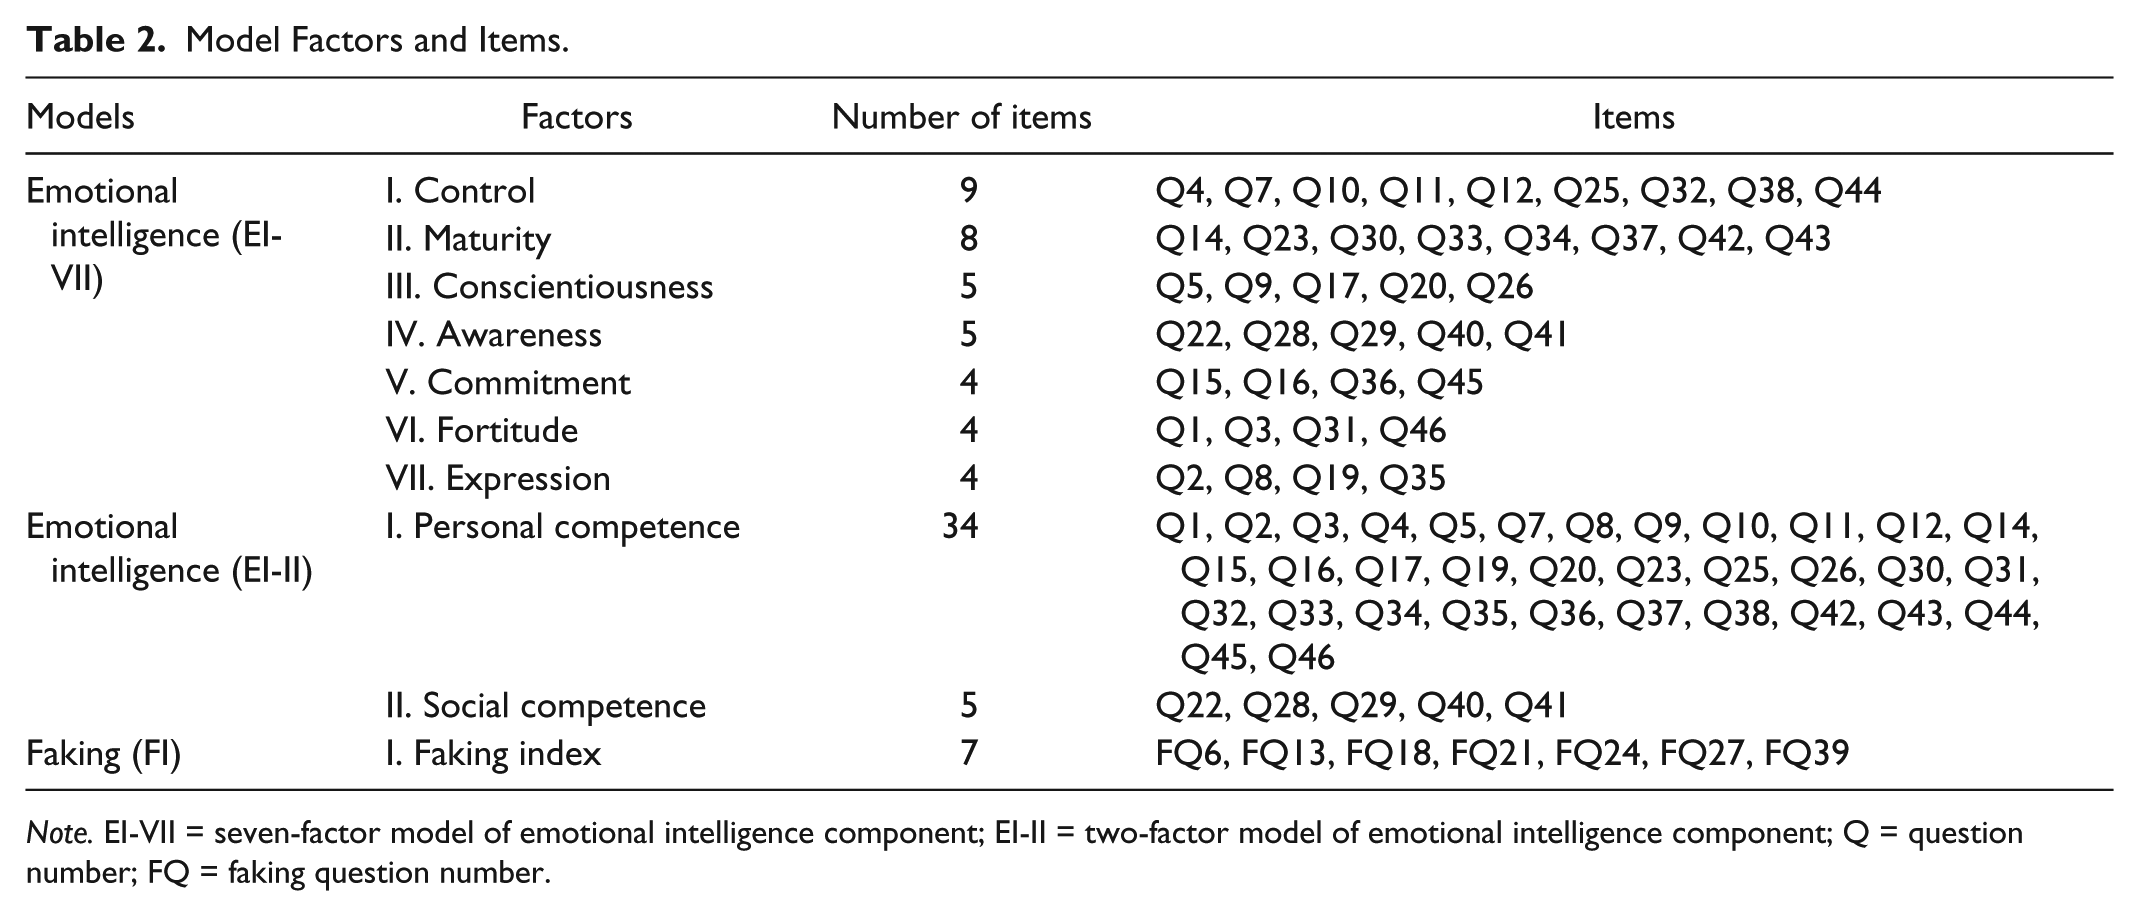
Note. EI-VII = seven-factor model of emotional intelligence component; EI-II = two-factor model of emotional intelligence component; Q = question number; FQ = faking question number.
Data Collection Procedures
USMEQ-i forms were administered to all first-, third-, and fifth-year medical students in examination halls after they completed all end-of-phase examinations. Informed consent was obtained from the students prior to the collection of forms.
Data Management and Preliminary Analysis
Data management and preliminary analysis were done using IBM SPSS Statistics version 20 and SPSS Amos version 19.
For the purpose of statistical analysis, the ordinal responses of the USMEQ-i were treated as continuous data. The use of maximum likelihood (ML) estimation for ordinal data is reasonable if the number of ordinal categories exceeds 3 (Byrne, 2010; Rhemtulla, Brosseau-Liard, & Savalei, 2012).
The multivariate normality of the items was assessed at the univariate, bivariate, and multivariate levels (Kline, 2011). The univariate normality of each item was assessed visually by inspecting a histogram with normality curve, box-and-whisker plot, and Q–Q plot, and statistically by the Kolmogorov–Smirnov and Shapiro–Wilk tests of normality and skewness and kurtosis to their standard error ratios (ratio < 3 for normality). The bivariate normality was assessed through an evaluation of the linearity and homoscedasticity of residuals of bivariate correlations for a number of selected pairs of items (Kline, 2011). The multivariate normality of the items was assessed by component, visually by plotting the chi-square versus the Mahalanobis distance plot (Burdenski, 2000) and statistically by Mardia’s normalized estimate of multivariate kurtosis in the form of critical ratio of kurtosis in Amos. Critical ratio of kurtosis < 5.0 indicates multivariate normality (Bentler, 2006). Multivariate outliers were identified through an evaluation of the Mahalanobis distance and its respective p1 and p2 values in Amos.
A multivariate collinearity assessment allows the identification of redundant items among a group of variables. Tolerance < 0.10 or variance inflation factor (VIF) > 10 indicates the multivariate collinearity of the affected item (Kline, 2011). These values were obtained from a multiple linear regression analysis in SPSS by assigning a dummy variable (ID was used) as the dependent variable and the items as the independent variables.
CFA
CFA was performed in Amos to evaluate the measurement model validity of the proposed EI-VII, EI-II, and FI models. The validity was evaluated through an assessment of model fit indices and other evidence of construct validity of the proposed and revised measurement models. The marker indicator approach was used to scale the factors to their respective items, as the approach is preferred whenever bootstrapping is used (Arbuckle, 2010). Items with the largest unit of discrimination were chosen as marker indicators, and their factor loadings were fixed to 1.0.
Following Brown’s (2006) recommendation, the following categories of fit indices were considered in this study: absolute fit (chi-square goodness-of-fit [χ2], standardized root mean square residual [SRMR]), parsimony-corrected fit (root mean square error of approximation [RMSEA]), and comparative fit (Tucker–Lewis fit index [TLI], comparative fit index [CFI]). The following cutoff values were used to indicate model fit: χ2 p> .05, TLI and CFI ≥ 0.95 (Brown, 2006; Schreiber, Nora, Stage, Barlow, & King, 2006), RMSEA and its upper 90% confidence limit ≤ 0.08, RMSEA’s close fit p > .05, and SRMR ≤ 0.08 (Brown, 2006).
For model-to-model comparison of nonnested models, the Akaike information criterion (AIC) and expected cross-validation index (ECVI) were used. Models with the lowest AIC and ECVI values were judged to fit the data better in comparison with other tested models (Brown, 2006; Schreiber et al., 2006).
Further assessment of construct validity involved an assessment of the main components of construct validity, namely, convergent validity and discriminant validity. Convergent validity was evaluated through an assessment of item factor loadings and their statistical significance, followed by an assessment of the factors’ average variance extracted (AVE) and construct reliabilities (CRs). Convergent validity was indicated by an item factor loading ≥ 0.5 and p < .05 (Hair, Black, Babin, &Anderson, 2009), AVE ≥ 0.5, and CR ≥ 0.7 (Fornell & Larcker, 1981). AVE and CR values were calculated according to the following equations given by Fornell and Larcker (1981):

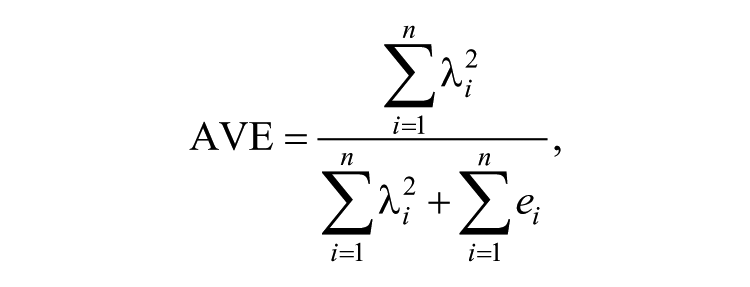
where λ i is the factor loading for item i under a particular construct, and ei is the error variance for the item.
Raykov (1997, 1998) described a procedure to obtain better estimates of the CR values and confidence intervals in the context of SEM, as demonstrated by Fan (2003) in the Amos software environment. The procedure was performed as follows:
A latent reliability variable (RV) was created for each factor.
Directional paths were added from the items to the respective RVs.
The regression weights for these additional paths were all set to 1.
The square of the correlation coefficient between a particular factor and its RV is the composite reliability coefficient for that factor.
Next, discriminant validity was evaluated by comparing factor AVE values with shared variances (SVs) between the factors, which are the squared correlations between any two factors. The factors were considered discriminant when the AVE values were greater than the SV values (Fornell & Larcker, 1981).
Model revisions were done based on assessments of factor loadings, standardized residuals (SRs), and modification indices (MIs), while maintaining the congenericity of the measurement model within the theoretical framework. Items with factor loadings < 0.5 were considered for removal (Hair et al., 2009). The researchers also considered items with loadings that had bootstrapped lower 95% confidence intervals below this cutoff value for removal. Items with SR > 2.58 were considered problematic items, which were further evaluated before removal (Brown, 2006). In this study, MI values were only used to identify potential cross-loading items (Hair et al., 2009) without setting any particular cutoff values, as the decision based on SR values was given more importance.
Ethical Approval
Ethical approval to conduct this study was obtained from the USM Research Ethics Committee (Human). The USM Research Ethics Committee required informed consent forms and approved the collection of data only as required by the analysis, as the USMEQ-i forms also included other personal information.
Results
Preliminary Analysis
A total of 576 medical students from the first, third, and fifth years gave their consent to participate in the study. A sample of 479 students was then obtained from this list of students through stratified random sampling. The sample size was smaller than the target sample size, as the male strata of Phases I and II were underrepresented due to the small participation rate within the strata.
During the initial data screening process, 160 respondents were dropped: one respondent for wrong entry, 38 respondents for not responding to all items, 36 respondents for not responding to more than five items consecutively (e.g., missing responses from Q1 to Q6), and 85 respondents for having a predictable pattern of responses (e.g., repetitive responses “343434 . . .” or “444444 . . .”). The researchers considered the last two conditions as dishonest responses, hence justifying their removal from the sample. After the screening process, 319 respondents remained in the sample.
In this remaining sample (n = 319), there were 11 respondents with one missing response, four respondents with two missing responses, and one respondent with three missing responses, for an overall rate of missing values of 0.15%. The missingness mechanism was determined as missing at random based on a significant Little’s (1988) test, χ2 (df) = 675.1 (534), p < .001.
The missing values were imputed with the prior knowledge imputation method (Tabachnick & Fidell, 2007). The missing responses for these 16 respondents were imputed with a value of 2, which is the middle value on the Likert-type scale, representing the “quite like me” option. The decision was made after a discussion with the inventory developer (M. S. B. Yusoff, personal communication, October 15, 2012). The developer considered the middle value as accurately representing the missing response. Other options of imputation were not considered in this study given the negligible percentage of missing values; most imputation methods will give similar results with a minimum bias in estimates at this percentage of missingness regardless of the mechanisms (Scheffer, 2002; Tabachnick & Fidell, 2007).
All items except Q11 were not normally distributed at the univariate level. At the bivariate level, seven items from the EI component were randomly selected to form 21 bivariate correlations, all of which were not normally distributed. Seven items from the faking component formed 21 bivariate correlations. Similarly, all the correlations were not normally distributed. At the multivariate level, items from both components were not normally distributed (EI component: multivariate kurtosis = 527.4, critical ratio of kurtosis = 83.28; faking component: multivariate kurtosis = 33.39, critical ratio of kurtosis = 26.56). Upon close inspection of 30 multivariate outliers from both components, two more respondents were excluded for having a predictable pattern of responses, as described earlier. However, no improvement in multivariate normality was noted after excluding these two respondents. None of the items had multivariate collinearity based on tolerance and VIF.
After this preliminary analysis, only 317 (66%) respondents out of 479 from the initial sample were included in the CFA. The demographic characteristics of the respondents and dropped cases are presented in Table 3.
Demographic Characteristics of Respondents and Dropped Cases.

Median (interquartile range). Age was not normally distributed.
CFA
In Amos, the main estimation method used is ML, which is dependent on the multivariate normality assumption. As the items were not normally distributed at the multivariate level, available options in Amos for non–multivariate normal data are the unweighted least squares (ULS), asymptotically distribution free (ADF), and bootstrapped ML estimation methods (Blunch, 2008; Brown, 2006; Byrne, 2010). However, ULS is not asymptotically efficient; thus, chi-square test and other fit indices that rely on chi-square cannot be obtained. On the contrary, ADF requires a very large sample size that is quoted in thousands (Blunch, 2008; Brown, 2006; Byrne, 2010). Thus, the ML estimation method with bootstrapping was used to obtain an accurate estimation of standard errors (Byrne, 2010) as reflected in p values and confidence intervals. Bootstrap samples were set at 250, as recommended by Nevitt and Hancock (2001). The bias-corrected confidence interval was set at the 95% confidence level. In addition, the Bollen–Stine bootstrap p was used as an appropriate alternative to the χ2 p whenever the bootstrapping method was used (Bollen & Stine, 1992). A cutoff of p> .05 was considered indicative of model fit.
EI component
EI-VII was specified as a reflective measurement model that consisted of seven first-order latent factors, 39 items (Table 1), and 21 interfactor correlations. The analysis of EI-VII indicated that the solution was not admissible due to a nonpositive definite covariance matrix. The model was not revised in view of the study among applicants (Arifin et al., 2012), in which EI-VII also faced a similar issue.
Next, EI-II was specified as a reflective measurement model that consisted of two first-order latent factors, 39 items (Table 1), and a correlation between social competence and personal competence. EI-II had poor model fit as indicated by all fit indices except SRMR. To obtain a good-fitting model, EI-II was revised iteratively as described below.
Initially, six items (Q2, Q3, Q8, Q9, Q11, and Q31) with factor loadings of less than 0.5 were removed from personal competence. This was followed by the removal of an additional 13 items (Q1, Q4, Q5, Q10, Q16, Q17, Q19, Q25, Q35, Q44, Q43, Q45, and Q46) with factor loadings of less than 0.6, except Q7 (factor loading = 0.596), which was retained because the value was very close to 0.6. The researchers set a higher cutoff value of 0.6 for personal competence, considering the large number of items (34) and the researchers’ aim to reduce the number of items under this factor. In addition, the factor loadings of all the items had a lower 95% confidence interval below 0.5, signifying the need to remove the items. As for social competence, only Q29 was removed from the factor at this stage due to low factor loading (0.398).
After these 20 items were removed, Q28 was noted to cross-load on personal competence based on an MI value of 15.30. Judging from the item content, Q28 appeared to fit the definition of personal competence; thus, it was relocated to that factor, leaving social competence with only three items.
Next, Q14, Q12, and Q32 were removed because their factor loadings had a lower 95% confidence interval of less than 0.5. Q32 was also removed for its high SR (Q32, Q38 = 3.67). At this point, the model still did not have a satisfying fit based on the fit indices (Bollen–Stine bootstrap p = .032, SRMR = 0.048, RMSEA = 0.061, TLI = 0.935, CFI = 0.945, AIC = 288.989, and ECVI = 0.915).
To improve the model further, Q28, Q36, and Q15, which had relatively high SRs with Q22 (2.18, 2.29, and 2.25, respectively), were considered for removal, although the SRs were lower than the 2.58 cutoff point. Q22 itself was not considered for removal as it belonged to social competence, which was left with only three items. The researchers tried to keep three or more items per factor to maintain a reasonable number of representative items. Q36 was removed, which resulted in the best improvement to the model (Bollen–Stine bootstrap p = .060, AIC = 253.173, and ECVI = 0.801) as compared with the removal of the other two items. However, TLI and CFI values were still not satisfactory (TLI = 0.939, CFI = 0.949). Last, Q38 was removed because its factor loading had a lower 95% confidence interval of less than 0.5.
Overall, 25 items were removed from both factors. The resulting model was a two-factor model (revised; EI-IIr) consisting of three items under social competence and 11 items under personal competence (Figure 1). The model fit well, as indicated by the fit indices, and showed model improvement as indicated by the reduction in AIC and ECVI values. Fit indices for EI-VII, EI-II, and EI-IIr are presented in Table 4.
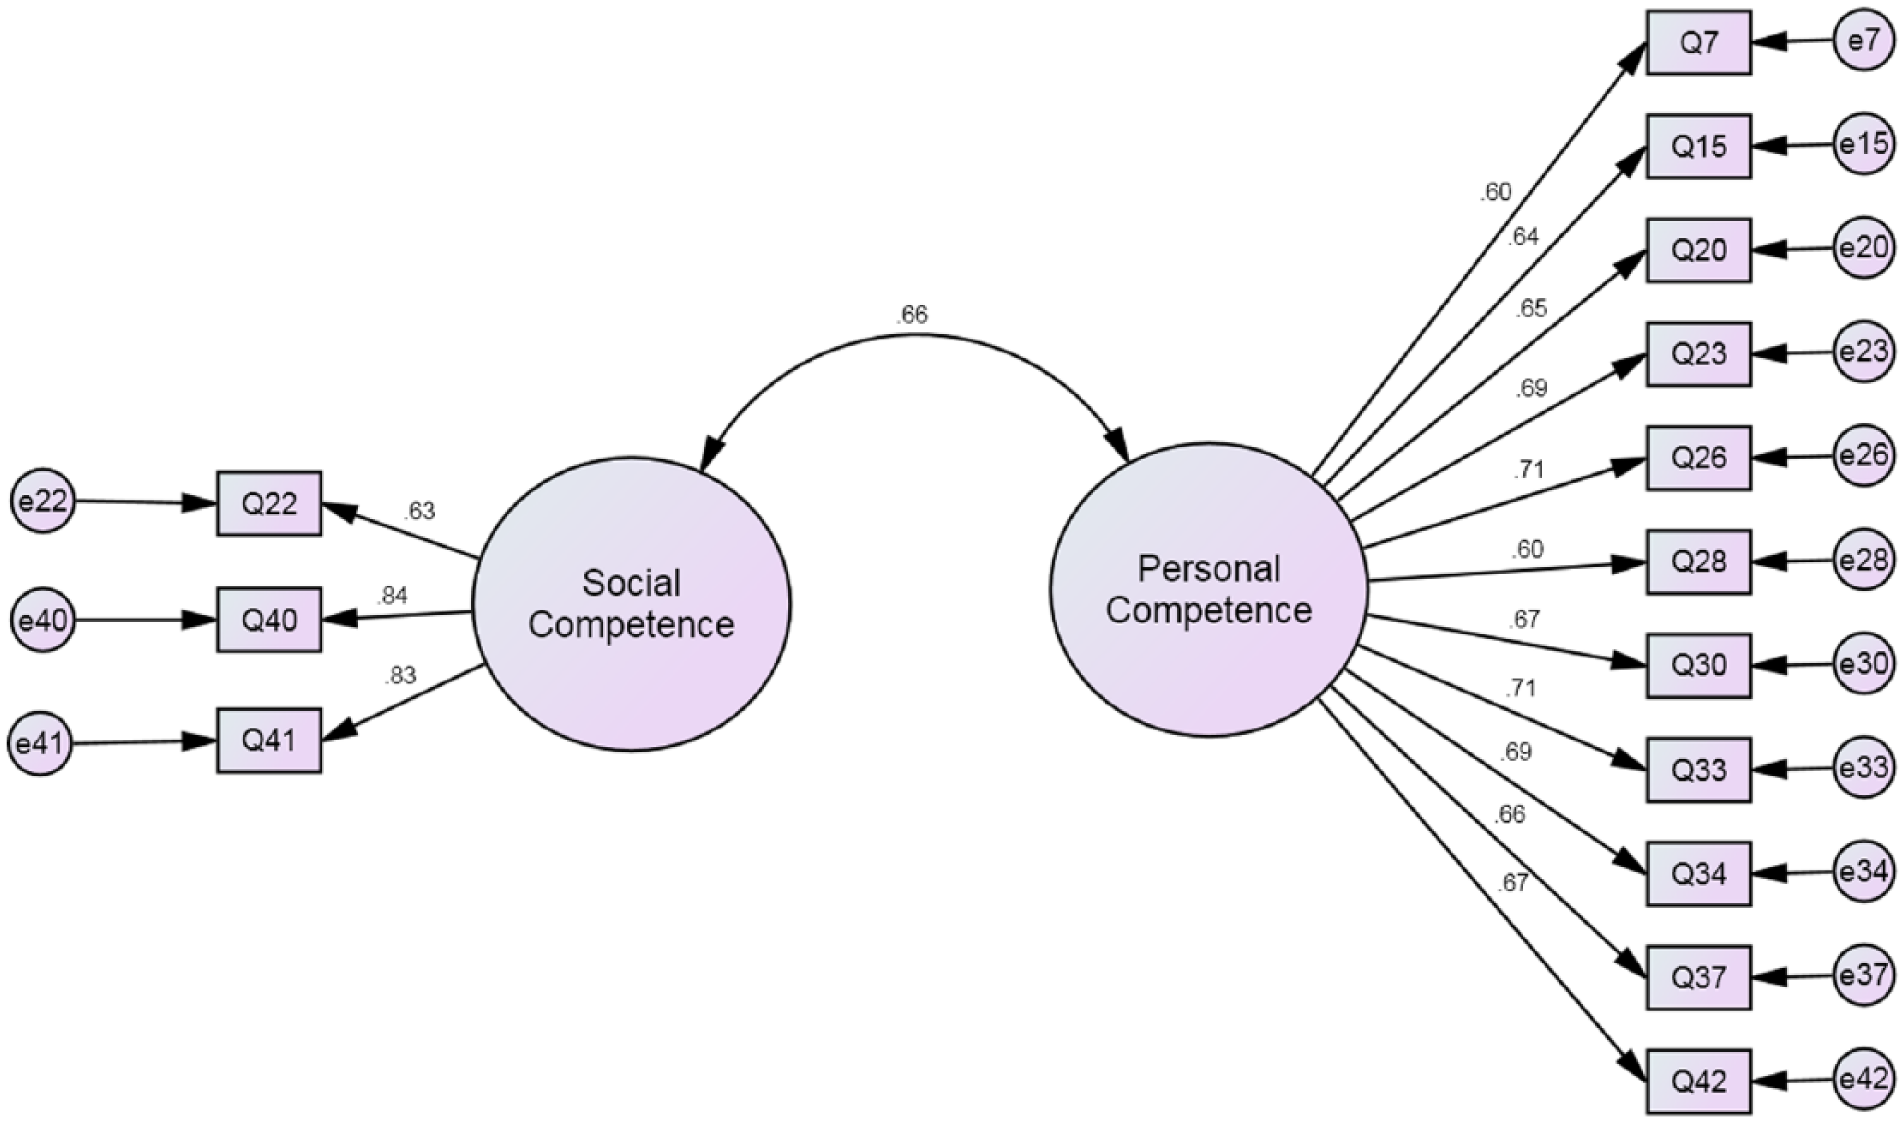
Two-factor model of emotional intelligence component (revised).
Fit Indices of EI and FI Measurement Models.

Note. The revised models are highlighted in bold. EI = emotional intelligence; FI = one-factor model of faking component; SRMR = standardized root mean square residual; RMSEA = root mean square error of approximation; CI = confidence interval; CFit = close fit; TLI = Tucker–Lewis fit index; CFI = comparative fit index; AIC = Akaike information criterion; ECVI = expected cross-validation index; EI-VII = seven-factor model of emotional intelligence component; EI-II = two-factor model of emotional intelligence component; EI-IIr = two-factor model of emotional intelligence component (revised); FIr = one-factor model of faking component (revised).
The convergent validity of EI-IIr was indicated by high factor loadings (Table 5), acceptable AVE values, and high CR values (Table 6). The discriminant validity of the model was also indicated by the AVE values, all of which exceeded the respective SV values (Table 6).
Factor Loadings and Correlation for EI-IIr and FIr.

Note. EI-IIr = two-factor model of emotional intelligence component (revised); FIr = one-factor model of faking component (revised); CI = confidence interval.
Correlation between social competence and personal competence, r = .662 (95% CI = [0.534, 0.794]), p = .004.
CR and AVE of EI-IIr and FIr.

Note. CR = construct reliability; AVE = average variance extracted; EI-IIr = two-factor model of emotional intelligence component (revised); FIr = one-factor model of faking component (revised); CR(R) = construct reliability (Raykov’s); CI = confidence interval.
Shared variance between social competence and personal competence is 0.438.
Faking component
FI was specified as a unidimensional reflective measurement model consisting of seven items (Table 1). FI had poor model fit, as indicated by the RMSEA and Bollen–Stine bootstrap. FI was revised to obtain a good-fitting model, in which three items (FQ27, FQ24, and FQ39) were removed due to relatively low factor loadings. This revision resulted in a unidimensional model (FIr) consisting of four items (Figure 2); the model fit well based on most of the fit indices except RMSEA and showed a remarkable reduction in AIC and ECVI values. Fit indices for both FI and FIr are presented in Table 4. FIr had good convergent validity, as indicated by the high factor loadings (Table 5), acceptable AVE value, and high CR value (Table 6).

One-factor model of faking component.
Discussion
EI Component
The proposed two-factor model of EI fit well after an extensive revision wherein 25 out of 39 items (64%) were removed and one item was relocated to another factor. The extent of the revision is comparable with the revision done in the confirmatory study of a sample of medical course applicants, in which 26 out of 39 items (67%) were removed (Arifin et al., 2012). In the study by Arifin et al. (2012), the extensive removal of items could be attributed to the carrying over of several items with low factor loadings from the EFA stage. The remaining items by factor in the current study are different from those retained in the study among applicants (Arifin et al., 2012). This finding signifies the use of different sets of items in the EI component of the USMEQ-i for medical students and medical course applicants.
The two-factor model is consistent with Goleman’s (1998) emotional competence framework, which was based on the mixed-model approach of EI. In the framework, emotional competence is divided into personal competence and social competence. Essentially, personal competence deals with managing oneself, whereas social competence deals with handling relationships with others (Goleman, 1998). The validity of the model also confirms the results from the confirmatory study of the USMEQ-i among medical course applicants (Arifin et al., 2012). The Emotional and Social Competency Inventory, which was based on a similar approach to EI, also includes personal and social factors (Boyatzis, 2007). In contrast, the model is not consistent with models from other inventories that were based on a similar approach, namely, the one-factor model of the EQ-i (Petrides & Furnham, 2001), the one-factor model of the SREIT (Petrides & Furnham, 2000), and the three-factor model of the MEIA (Tett & Fox, 2006), all of which were validated by CFA.
Faking Component
The proposed unidimensional model of the faking component fit well after the removal of three out of seven items (43%). This could also be attributed to the carrying over of items with relatively low factor loadings from the EFA stage (Arifin et al., 2012).
The unidimensionality of the faking component in the current study is comparable with that in the study among applicants (Arifin et al., 2012). However, the studies differ in the remaining items after CFA; this signifies the use of different sets of items for students and applicants. Confirmatory validation studies of other inventories measuring the faking concept have also shown its unidimensionality. A CFA of the Marlowe–Crowne Social Desirability Scale (MCSDS) indicated the unidimensionality of the short forms of MCSDS (Fischer & Fick, 1993; Leite & Beretvas, 2005). Another inventory, the Paulhus Deception Scales, was also found to be unidimensional (Lanyon & Carle, 2007) after a minor revision.
Limitations and Future Research
In the current study, the USMEQ-i was validated among medical students in the USM Medical School. The inventory may also be valid among medical students from other medical schools in Malaysia, as the settings are almost similar. However, the USMEQ-i should be administered with caution until cross-validation studies are conducted in other medical schools.
Because a large number of items were removed during the model revisions, a revalidation study is needed on a new sample of medical students. Hair et al. (2009) recommended the collection of a new sample upon removal of more than 20% of the items. A low cutoff value of 0.3 for item factor loading was set during the EFA stage of USMEQ-i validation (Yusoff et al., 2011), which resulted in a number of poor quality items in the preliminary version used in this study. In view of the findings of the current study and those of Arifin et al. (2012), setting a higher cutoff value of 0.5 would be more practical (Hair et al., 2009) to ensure that only good items are carried over to the CFA stage of validation.
The evidence of construct validity of the USMEQ-i in this study was only provided by CFA. Matthews, Zeidner, and Roberts (2007) pointed out that evidence of the convergent validity of an EI inventory is commonly established in relation to other available EI inventories. However, there is no other EI inventory in the Malay language, making it impossible to provide evidence of convergent validity.
Footnotes
Acknowledgements
We are especially grateful to the School of Medical Sciences at Universiti Sains Malaysia for the support to conduct this study, the Department of Medical Education staff for their help in distributing the forms to medical students, and the medical students for their participation in this study.
Declaration of Conflicting Interests
The author(s) declared no potential conflicts of interest with respect to the research, authorship, and/or publication of this article.
Funding
The author(s) disclosed receipt of the following financial support for the research and/or authorship of this article: This study was funded by Universiti Sains Malaysia (Short-Term Research Grant 304/PPSP/6139071).