
Abstract
This article looks at the theory and empirical findings of excessive compensation on the recent financial implosion across institutional forms in banking. Compensation levels have gone up dramatically over the last 30 years as deregulation and concentration have grown. Some banks and quite a few credit unions avoided closure by prudent portfolio selection and keeping reserves up by maintaining compensation levels closer to the median level. Empirical findings here are based on a unique panel data set on U.S. commercial banks, thrifts, and credit unions from 1994 through 2010 (more than 300,000 observations) that provide evidence that the firms with the highest net worth typically are smaller institutions, are credit unions, have smaller insider loans as a percentage of assets, and have lower average pay levels. The favorable results here for credit unions, financial cooperatives, should help guide policy when deciding which type of financial institutions should be encouraged.
The global financial crisis at the time of this writing is going on for 4 years. Although there have been positive signs that the “Great Recession” may be coming to an end, high unemployment, the continued slow progress in the mortgage crisis, and sovereign debt exposure point to continued difficulty in keeping banking institutions well capitalized. Capitalization allows banks and credit unions to withstand minor setbacks and helps keep defenses stronger in case of systemic shocks. Given the attempts to redress the financial institutions taken by a number of governments and organizations, threats to bank solvency that were often passed over have recently garnered greater attention (e.g., Congressional Oversight Panel, 2010, 2011; McKillop, Ward, & Wilson, 2010; Walter, 2010). Why is it that credit unions received much less public support than other institutions in the United States? Is this lack of support due to less need, unlike that found by Allen Berger, Bouwman, Kick, and Schaeck (2012) when considering recent developments in Germany, less political power, or being considered small enough to fail? Some have cited declining ethical standards (Volcker, 2011) or internal factors such as excessive compensation for the collapse of so many institutions. The threat of out of control compensation practices to a healthy financial system is severe enough that new guidelines are in the process of being formulated by a number of regulatory bodies including the Federal Reserve in the United States (2011) and the Bank for International Settlements in Basel, Switzerland (2011). Some have pointed to the level of pay, and others have focused on the incentive schemes that are offered. Financial institutions typically have had the highest pay among industries, and at least top-level executives have, in many cases, incentive compensation based on firm performance. These schemes have often been shown to have positive impacts on performance in a number of industries. The problem with some of these compensation schemes is that they have not been adjusted for the risk imposed on the institution. Corporate governance issues have been brought to the fore by these compensation issues as well. Have the board of directors and management given enough attention to the risk that these practices place on the institution, or have they been aware of the probable consequences and their own personal incentives are so short term that future institutional collapse is not a consideration? Shareholders as well as taxpayers in a number of countries believe that compensation has gone too far and have been openly challenging executives at companies like Citigroup, Barclays, and Credit Suisse (Schafer, 2012). This article will answer some of these questions concerning the dangers of mismanaging compensation. Data collected from 1994 to 2010 on U.S. credit unions, banks, and thrifts provide a rich resource to analyze the changes in capitalization.
The next section will discuss the theory of capitalization and compensation as it relates to financial institutions. The third section of the article will address the data used and the empirical strategy. The results of the statistical analysis will be considered in the fourth section followed by the policy implications.
Theory of Capitalization and Compensation
Capital acts not only to provide financial institutions the liquidity necessary to take advantage of opportunities but also as an important buffer in case of distressed asset values. Historically capital levels were much higher when there was no clear lender of last resort. Bank capital in the 1800s typically ranged from 20% to 50% of assets, much higher than the approximately 10% that is seen recently (Dwyer, 2011). The higher leverage ratio seen before this recession makes institutions more susceptible to even moderate fluctuations in assets. The lender of last resort function and the deposit insurance programs of the last 100 years also come with capitalization standards that are often perceived as burdensome, even though well below what existed in the period of “free market” banking in earlier years. The different stakeholders of institutions often have divergent goals in regard to capital. Shareholders interested in maximizing income typically want less than the credit rating agencies due to the opportunity costs of maintaining high liquidity than do depositors and regulators who want to be protected from loss (Allen, 2006; Doyran, 2011). Credit unions, unlike commercial banks, are financial cooperatives and have depositors who are also the claimants on the residual income as well as being able to determine the composition of the board of directors (Jones, Kalmi, & Kauhanen, 2012). All institutions wishing to avoid “prompt corrective action” (PCA) by regulatory authorities will attempt to meet the minimum capital standards for being “well capitalized” set by the relevant regulator (Elizalde & Repullo, 2006).
Compensation practices at financial institutions have been controversial especially lately due to the relatively high levels of pay and the risks that are thought to have been magnified by incentive compensation schemes. The banking industry has one of the highest levels of pay of any industry in the United States especially investment banking and even after accounting for differences in human capital (Cai & Milbourn, 2010; Philippon & Reshef, 2012). Given the recent crisis with substantial taxpayer bailouts since 2007 (Gilbert, Kliesen, Meyer, & Wheelock, 2012), with compensation still quite high, has a number of shareholders and taxpayers feeling that their money has been misspent and that the high pay actually makes default risk higher (Thanassoulis, 2012). In 2010, compensation at publicly traded banks reached a record US$135 billion (Lucchetti & Grocer, 2011). Even in the midst of the recession in 2009, these same companies paid US$128 billion in pay. Many argue that many of these companies would have been bankrupt and closed if not for the infusions from the Fed and the government (Aubuchon & Wheelock, 2010; Taibbi, 2011). One of the more discussed cases is that of the investment bank of Goldman Sachs (2011), which recently paid approximately US$500,000 in average compensation. A high percentage of compensation among banks, especially among senior management, comes from incentive schemes such as bonuses and stock options (Rosen, 2002). Incentive schemes such as these are often thought to bring increased firm productivity in a wide variety of industries (FitzRoy et al., 1998; Klinedinst, 2003; Kruse & Blasi, 1997). Although these variable pay schemes are often associated with greater efficiency in many industries, it is clear in banking that they may also contribute to greater risk (Federal Reserve, Board of Governors, 2011). This greater risk is a problem that derives not only from senior-level executives’ compensation but also from employees in areas where the desire to earn bonuses in the short run is not adequately matched to the long-run implications of their decisions (Financial Stability Board, 2012). This agency problem of improper incentives runs through institutions all the way to the board of directors (Brown, 2009; Group of 30, 2012). Compensation being at odds with the interests of stakeholders was brought to the attention of the mainstream economics profession by Berle and Means (1932) in their book The Modern Corporation and Private Property, we are dealing not only with distinct but often opposing groups, ownership on the one side, control on the other—a control which tends to move further and further away from ownership and ultimately to lie in the hands of management itself, a management capable of perpetuating its own position. (p. 124)
Robert Hoel (2011) recently pointed out a similar problem in credit unions as well, Owner power evolves as the organization grows in size and complexity. Management becomes the most powerful actor in governance. (p. 21)
The degree to which this increased power translates into more firm earnings ending up in executive compensation rather than capital to protect shareholders, customers, and regulators is what this article hopes to empirically investigate.
Data and Empirical Strategy
Data used here come from publicly available series on all credit unions, thrifts, and commercial banks in the United States from 1994 until the end of 2010. These annual data are relatively unique with more than 322,000 observations allowing a comparison of the strengths of various institutional forms through prosperous economic times and into the “Great Recession.” Sources for these online data are the National Credit Union Administration (NCUA; 2012) and Federal Deposit Insurance Corporation (FDIC; 2012). Statistical methods utilizing not only summary statistics but also regression techniques with numerous controls will be used to analyze these data. Given that we analyzed data from different financial institutional forms that often have similar goals and regulatory constraints but are also distinct, we allow flexible forms and compare both within and across institutions. Operationalizing the relations discussed in the previous section gives a general form such as

The performance indicator, Yit, used here is the firm’s net worth as a percentage of assets. The intercept, α
i
, captures firm specific factors which may be otherwise unseen, while the
The policy variables include dummies for institutional type (credit union, thrift, or commercial bank), a dummy for large size (“giant” more than US$50 billion in assets), and an interaction term for giant firms with average salary per employee, national unemployment figures, and the Case–Shiller housing index.
Results
All institutional forms have seen a dramatic decline over the period from 1994 to 2010. Table 1 shows that credit unions, savings banks, and commercial banks dropped from a total of almost 25,000 in 1994 to just over 15,000 by 2010, with savings bank numbers cut almost in half. This decline in numbers, in many cases caused by mergers, is reflected in the fact that large institutions (“giants” in the tables), those with more than US$50 billion in assets, grew 164% (e.g., Goddard, McKillop, & Wilson, 2008; U.S. Senate, 2011; Wilcox & Dopico, 2011). This pace quickened from the end of 2007 until the end of 2010, especially for commercial banks. 1 Capital grew substantially for all institutions over the time period, 344% for all institutions as indicated in Table 2. The largest growth occurred in commercial banks, second in credit unions, and savings banks the least. Large institutions also reported strong growth of 270%. As a percentage of assets, the growth of capital was less remarkable, but still positive over the whole period. Credit union’s net worth ratio was relatively stable at around 10%, whereas all other institutions showed stronger growth at the end of the period to get to roughly the level the credit unions had over the entire sample. This higher capital ratio 2 for credit unions is in part a purposeful strategy after the difficult times experienced in the 1980s (Dywer, Gould, & Lopez, 1999). The largest institutions, starting with 6.55% (a result at odds with Daniel Bergstresser’s, 2004, work on earlier data), had the farthest to go and hence recorded the greatest growth at almost 70%. Figure 1 shows that credit unions had a higher median net worth over the whole period except for the last year when the large banks received substantial government assistance. The growth at the giant institutions is not too surprising given the largesse of the Federal Reserve to institutions that were “too big to fail” (Barofsky, 2012; Blinder & Zandi, 2010; Special Inspector General for the Troubled Asset Relief Program, 2012; Taibbi, 2013). Insider loans dropped over the period for credit unions and commercial banks, but went up by more than 200% for savings banks. Credit unions started the period with salaries about half those of the largest firms, closing the gap partly to about 67% by 2010. Average real salaries grew by similar amounts for all institutions over the period, except for the giants, which had much higher salaries than the others initially. Figure 2 shows that the ranking of median salaries over the whole period remains steady with the giants having the highest median salaries followed by savings banks, commercial banks, and finally the credit unions. It is interesting to note that the firms with more than a billion dollars of assets not only had typically higher salaries in 1994 than the firms with less than US$50 million in assets, but these large firms had a larger growth rates in salaries from 1994 to 2010. If the commercial and savings bank employees in 2010 (2,083,246 employees) had been paid at the average rate of credit union employees, the annual savings from even this limited measure of compensation would be more than US$40 billion. Alternatively, if the compensation in commercial and savings banks had been used to hire people at the mean salary of credit unions, there could have been more than 740,000 jobs in the industry.
Institutional Form Over Time.

Firms with more than US$50 billion in assets. There were 494 observations in this group, 56 for savings banks and the rest were for commercial banks.
Means and Changes Over Time.
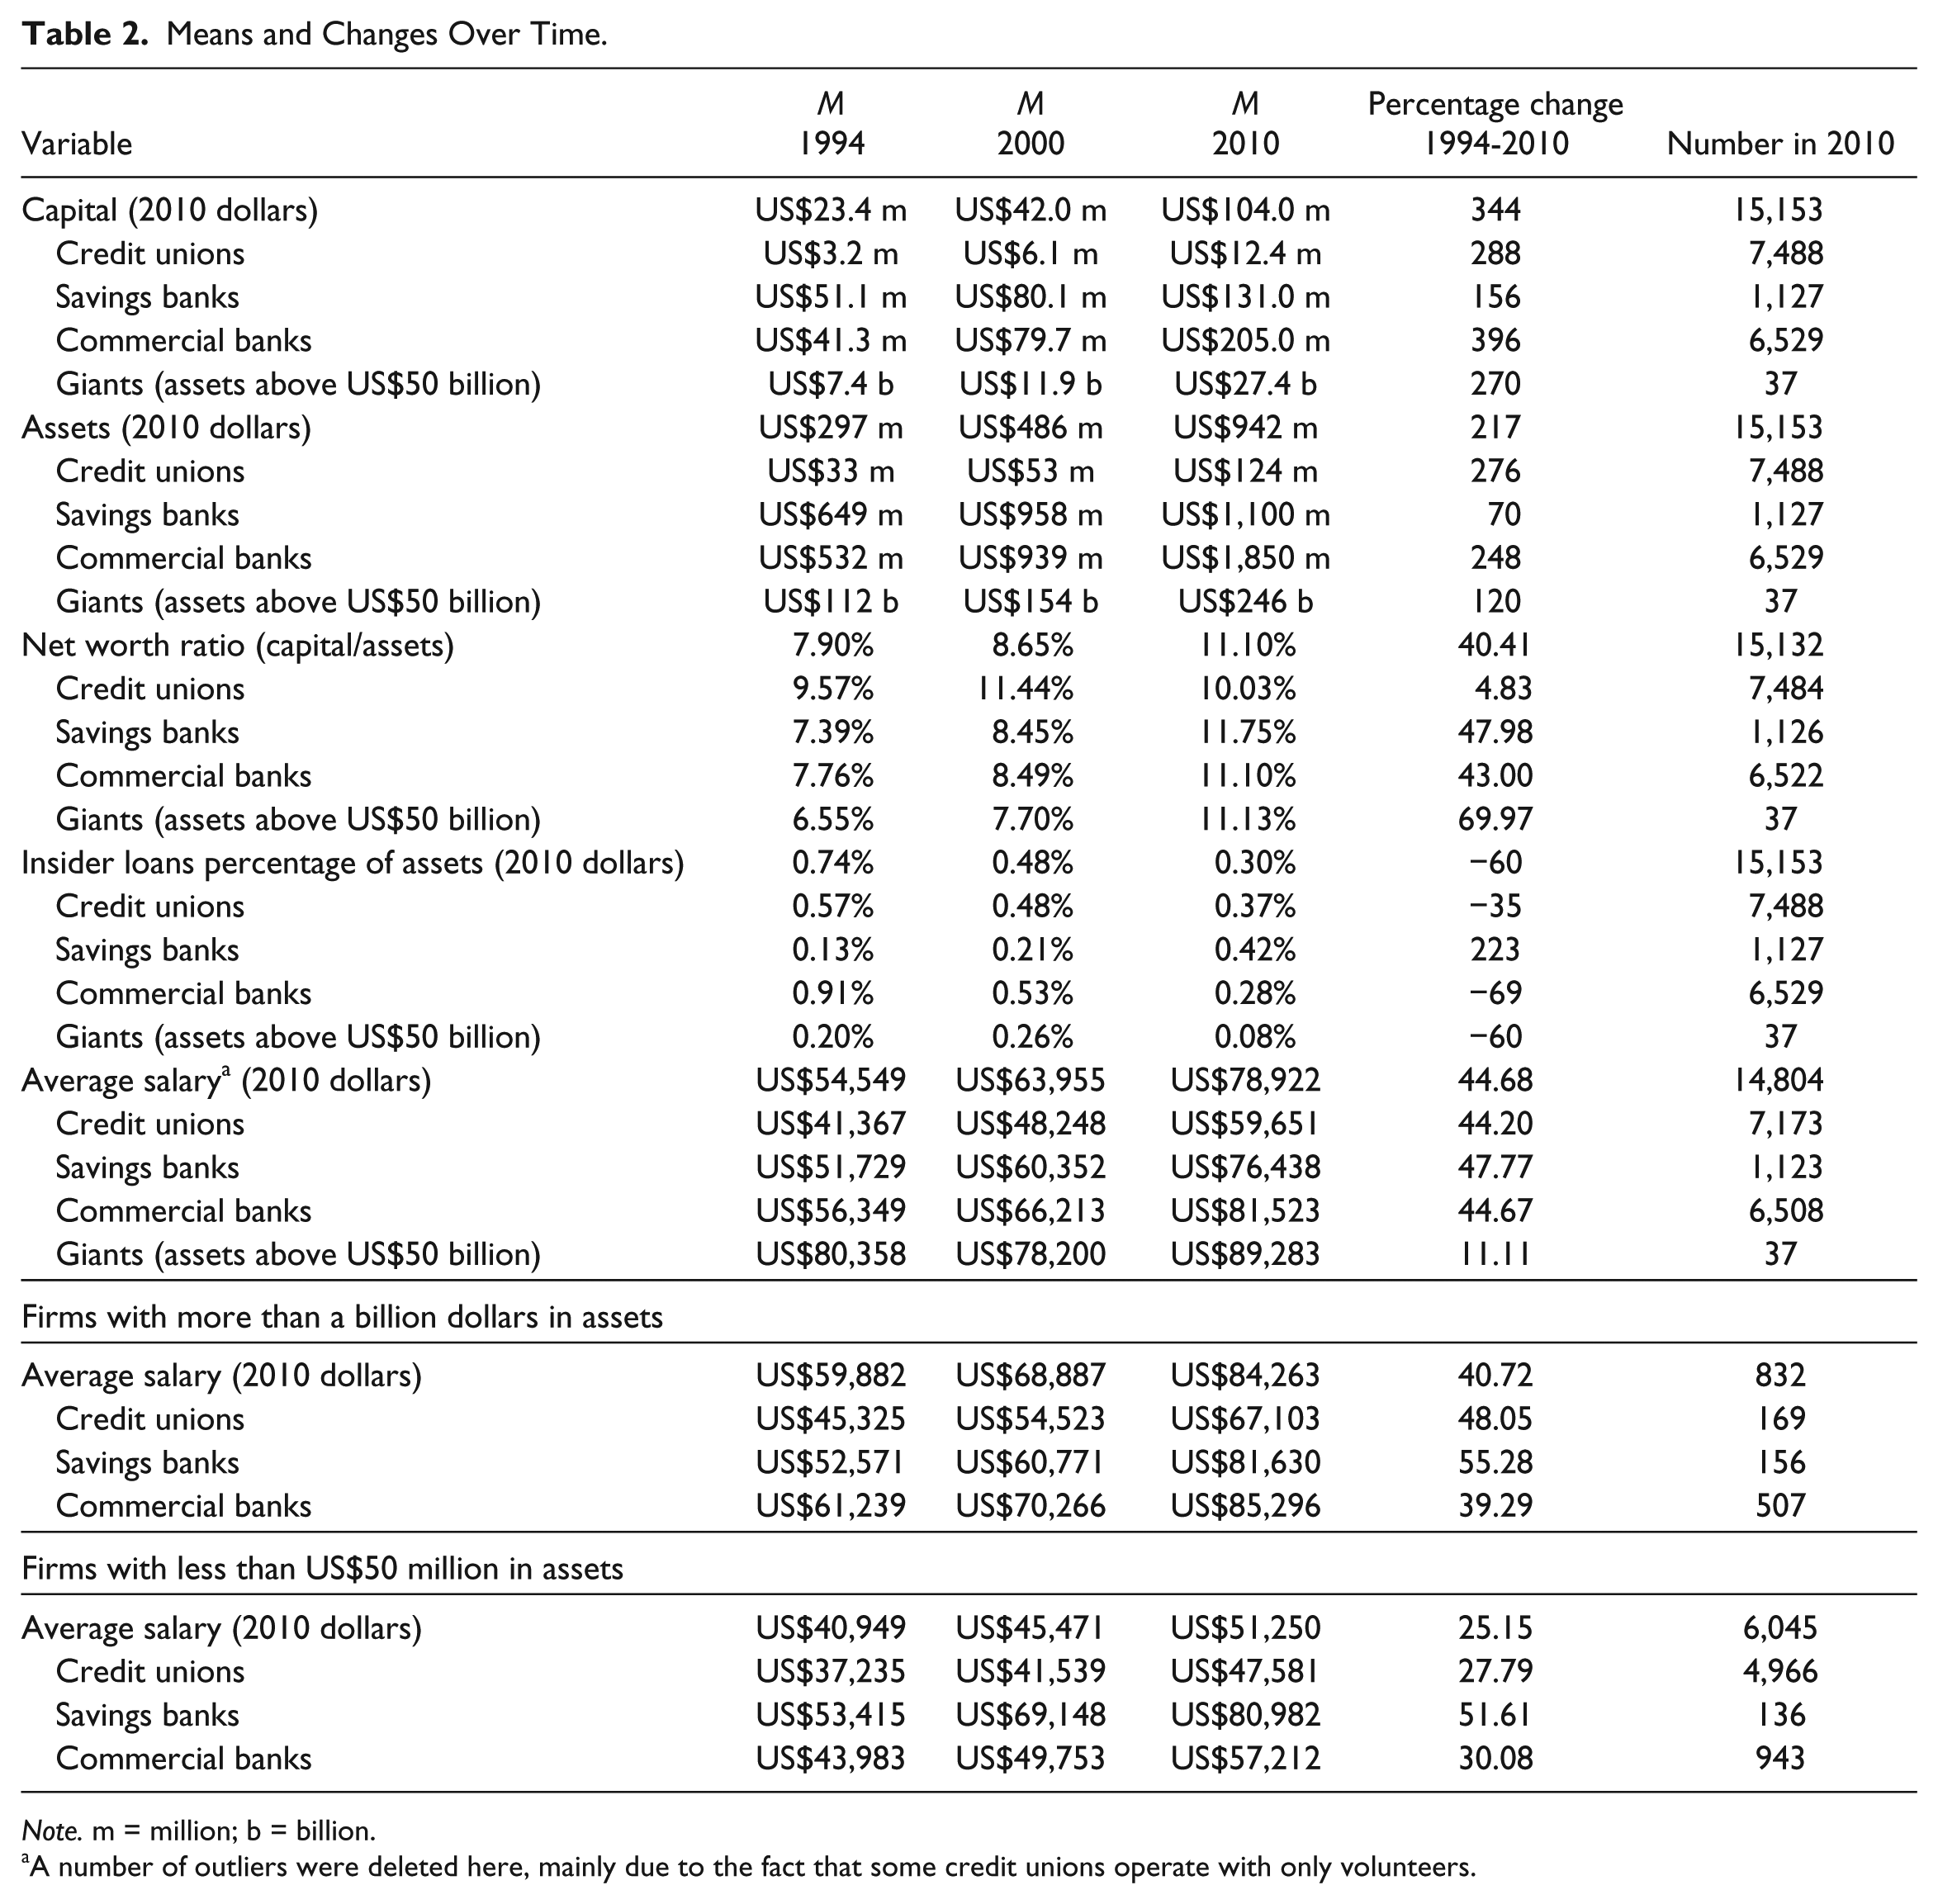
Note. m = million; b = billion.
A number of outliers were deleted here, mainly due to the fact that some credit unions operate with only volunteers.
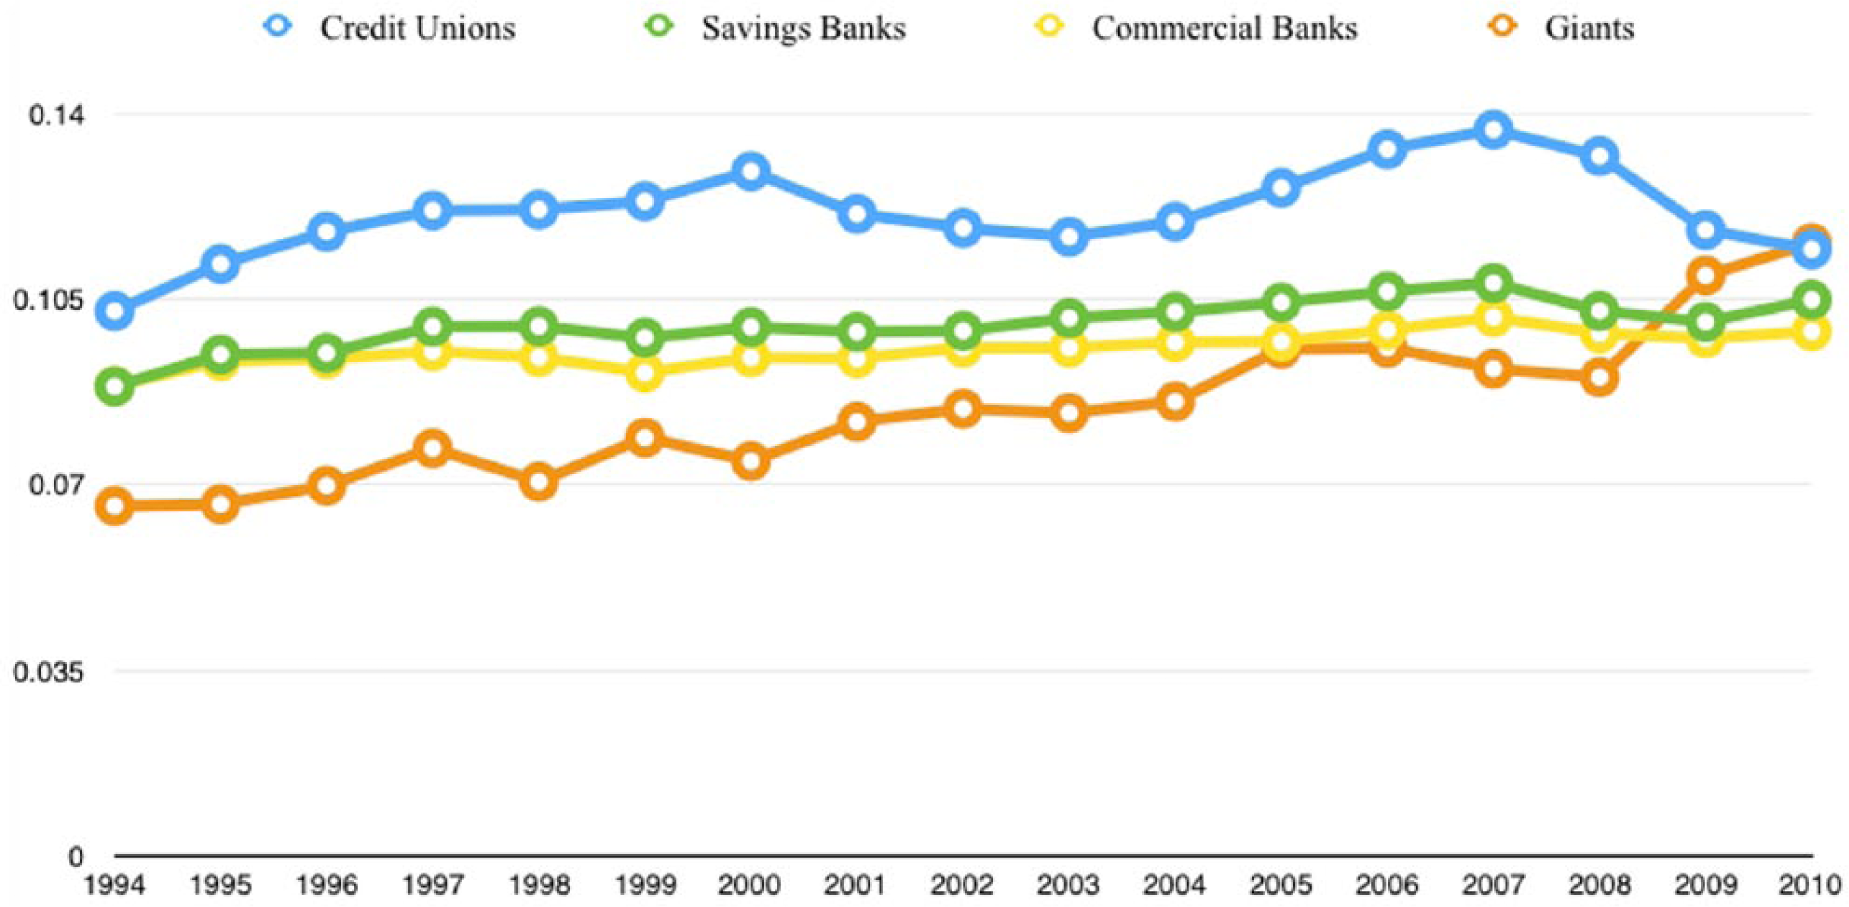
Net worth, 1994-2010 (median).
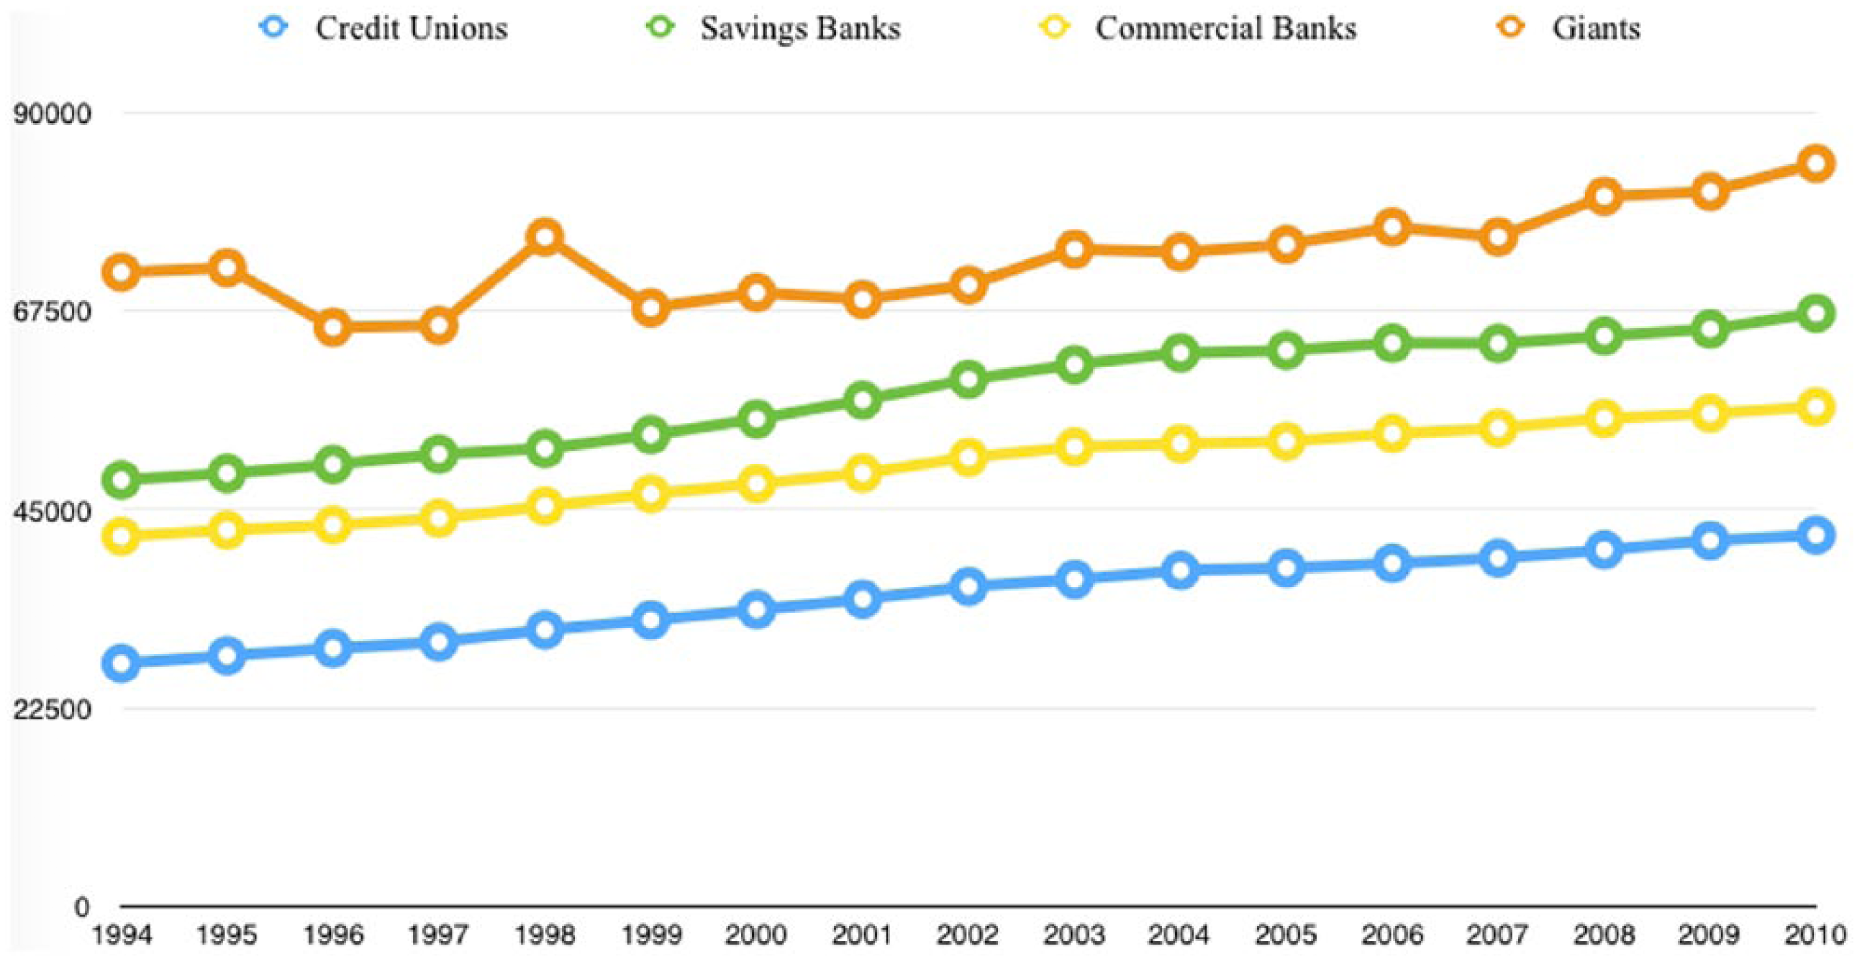
Salary per employee (median, 2010 dollars).
The top and bottom quintiles of all observations ranked according to net worth as a percentage of assets are reported in Table 3. This table shows that credit unions overall and throughout the period are more than 70% of the top quintile observations. The top firms are also typically smaller, averaging 182 million in assets and only 36 employees versus 1,230 million and 225 employees for the bottom quintile. There are about 3 times as many giant institutions in the bottom than in the top. Insider loans are also smaller in the top quintile, and average salaries are also lower. It is interesting to note that after trillions of dollars were injected into the system after 2007 (Blinder & Zandi, 2010), the percentage of commercial banks, savings banks, and giants dropped quickly as a percentage of the bottom quintile and the average salary in this quintile continued to increase. This finding of those institutions with the highest salaries levels continuing to pay well matches the Federal Reserve’s finding that “Over the recent three-year period, median net worth decreased for all income groups except the top decile, for which it was basically unchanged . . .” (Bricker et al., 2012, p. 6).
Means in Top and Bottom Quintiles According to Net Worth.
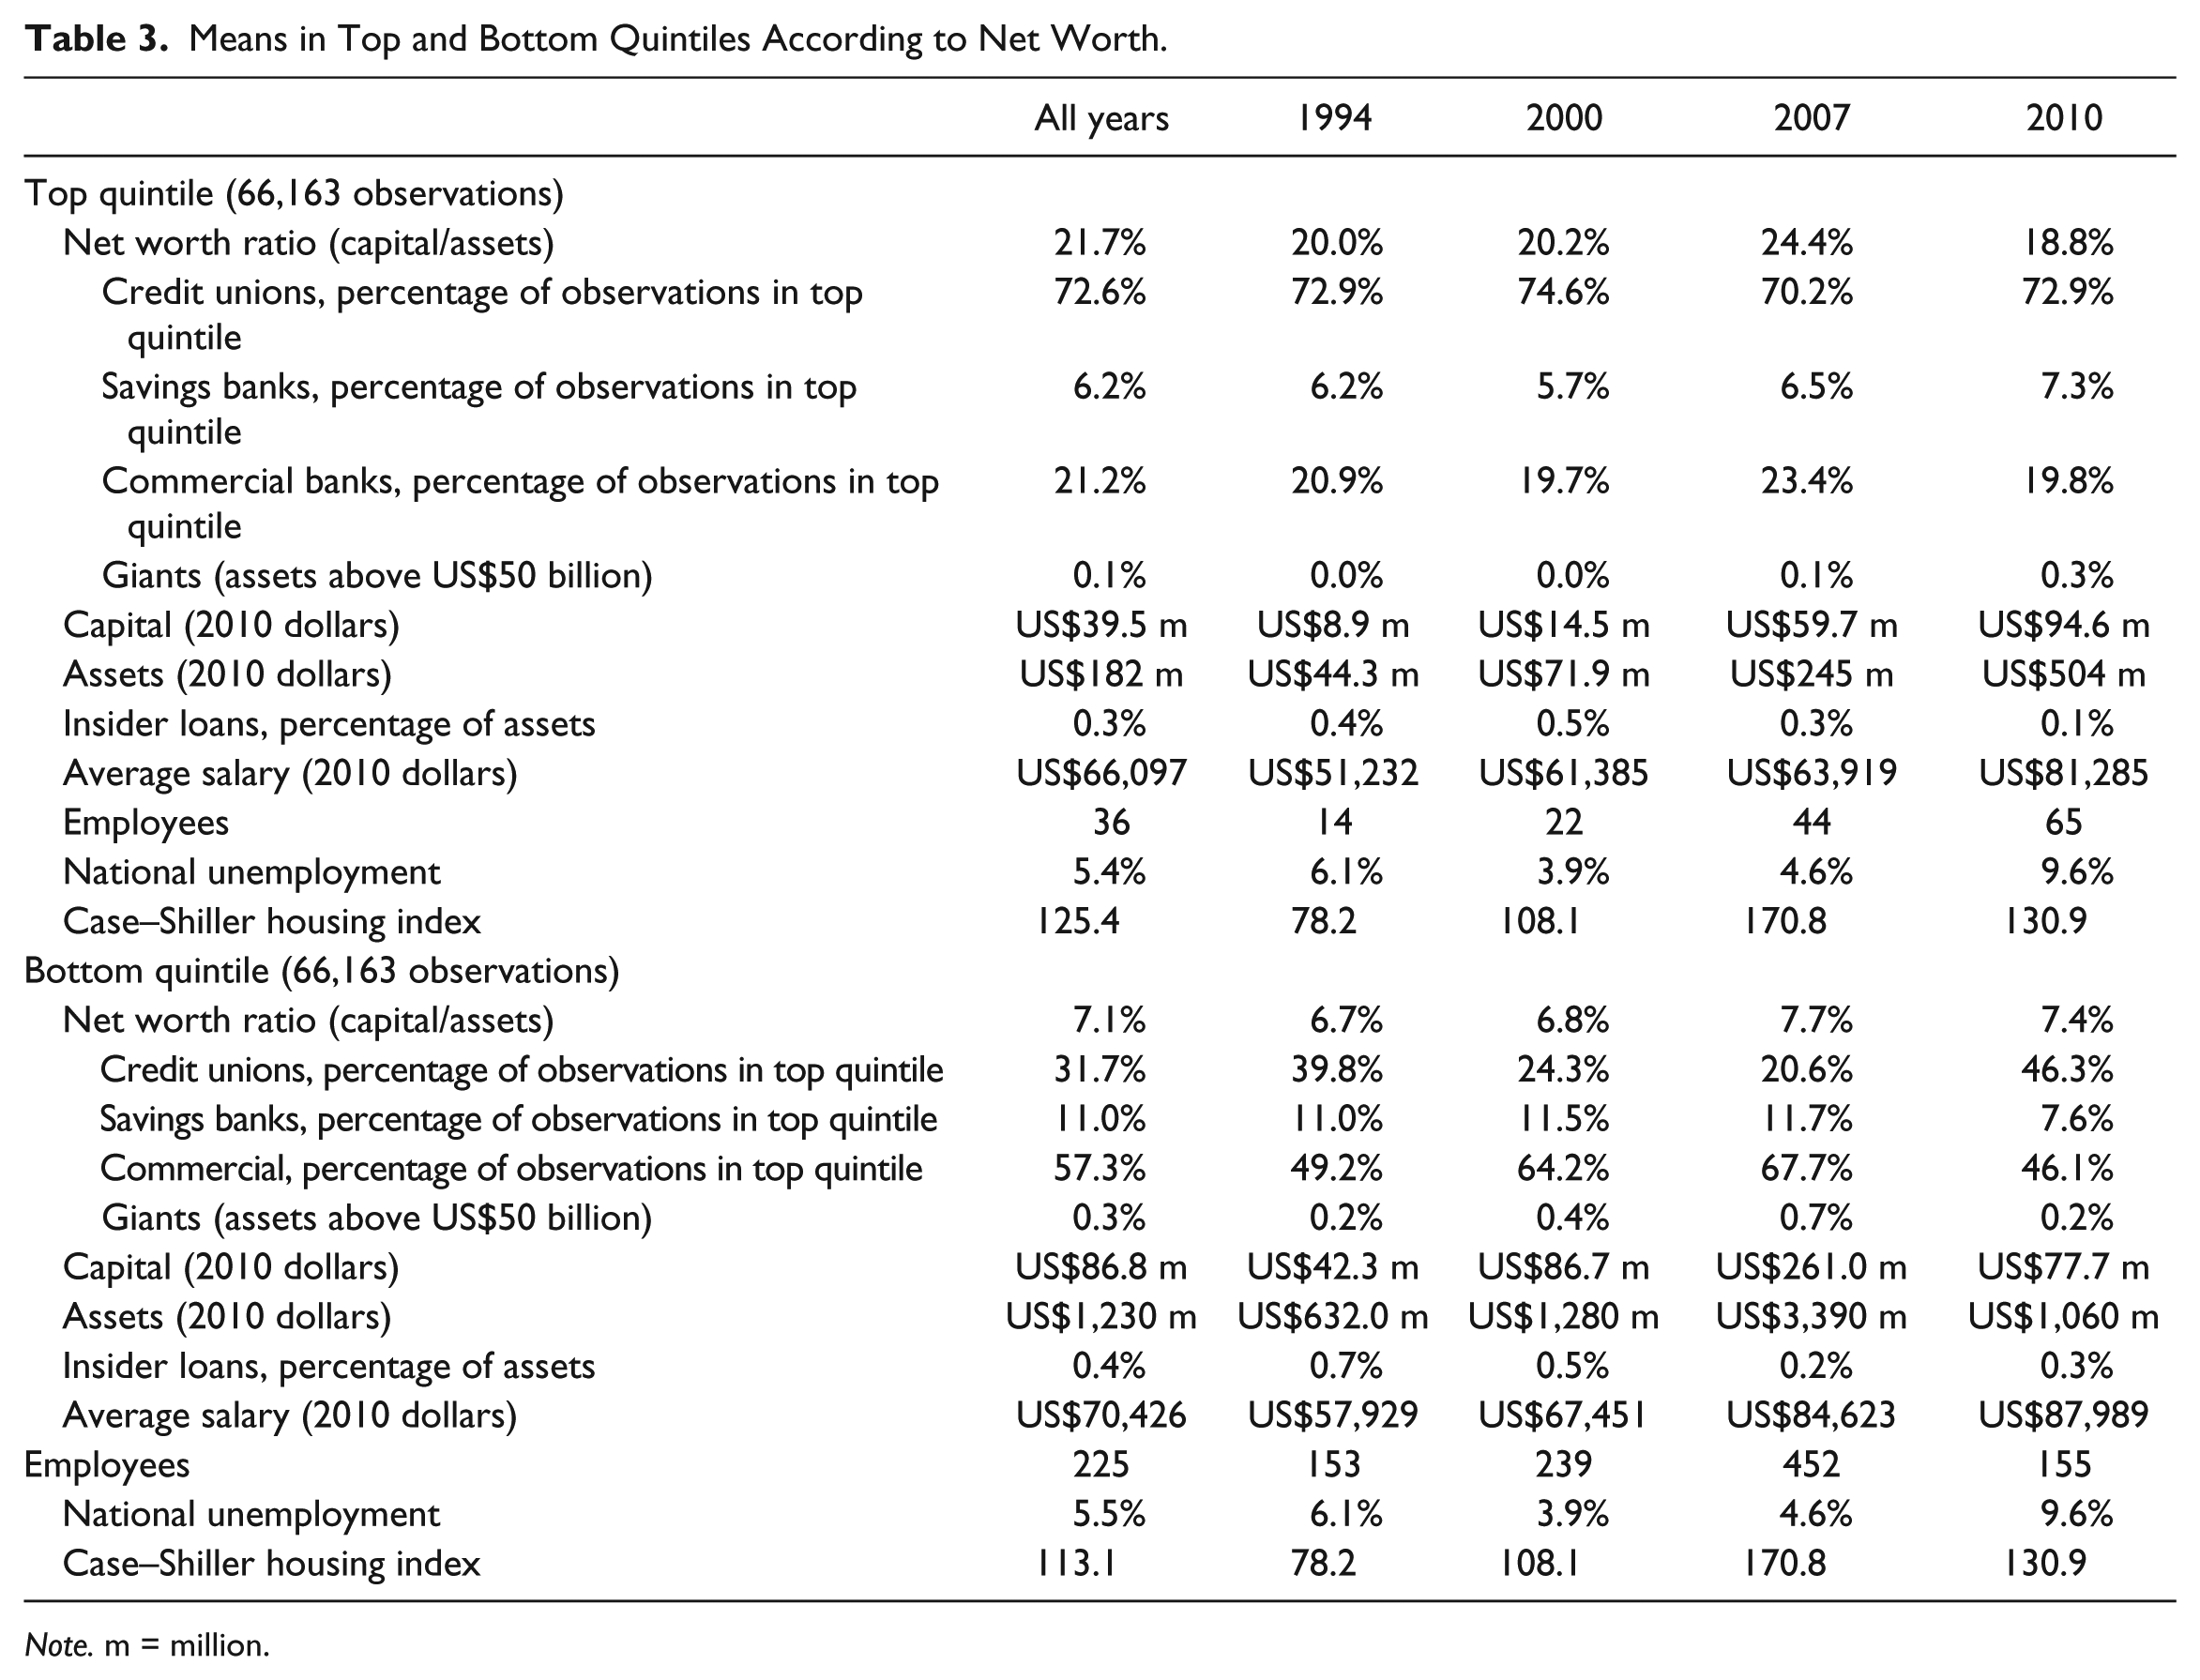
Note. m = million.
Tables 4 and 5 give results based on either the savings banks as the control dummy or the commercial bank dummy and with increasing numbers of control variables included. Regressions with the most controls in these two tables, column 4, were found to be the best fit. 3 In both tables, credit unions are estimated to have a positive and significant impact on net worth. The difference between savings banks and commercial banks is often insignificant with savings banks in the ordinary least squares (OLS) estimates showing a positive and significant impact. Given the power and size of large institutions, a “giant” dummy, which includes a number of institutions that are typically considered too big to fail and often hard to measure precise effects (Berger et al., 2012), shows a positive and significant effect on net worth. It is interesting to note that if the giant dummy is included without the interaction term for salaries, it becomes negative and significant (see column 2 of Table 5). This interaction term is significant and negative indicating high salaries at these giant institutions detract from the positive scale effect and may be above efficiency wage norms. 4
Net Worth as Percentage of Assets, U.S. Data 1994-2010.

Note. Savings bank is the excluded dummy. Robust standard errors are in parentheses. OLS = ordinary least squares.
Significance at the 10% level. ***Significance at the 5% level. ***Significance at the 1% level.
Net Worth as Percentage of Assets, U.S. Data 1994-2010.

Note. Commercial bank is the excluded dummy. Robust standard errors are in parentheses. OLS = ordinary least squares.
Significance at the 10% level. ***Significance at the 5% level. ***Significance at the 1% level.
The negative and significant coefficient on salaries gives some credence to the hypothesis that insiders, executives, may be paid at such a rate that shareholders suffer. Loans to insiders are also measured to have an important negative impact on net worth in both Tables 4 and 5. It might be argued that average pay may vary over the business cycle; hence, regressions with employment held constant were performed, not reported here, and show similar results. The national unemployment rate is also measured, as might be expected, as having a negative and significant impact on net worth. The Case–Shiller housing index throughout these two tables is seen as being positively correlated with net worth. The unemployment and housing index capture in part the impact on bank balance sheets of the recently reported drop of almost 40% in the median net worth of American households of the last few years of this sample (Bricker et al., 2012).
Tables 6 to 8 allow the effects to be institutional specific and broken down into different asset sizes. Estimating the impact on credit unions alone in Table 6 shows that the impact of salaries and insider loans to typically be not significant. Commercial banks estimated in Table 7 again shows the positive scale effects of the “giants” but their high salaries have a negative influence on net worth. Even among the large firms, there are differences across institutional forms, for example, Navy Federal Credit Union, the largest credit union with assets of more than US$44 billion in 2010, had 16% higher net worth ratio than the large commercial bank Goldman Sachs ([.09744 − .08357] / .08357 = .16596), and Goldman paid on average about 26% more in average salaries ([97,158.97 − 76,787.951] / 76,787.951 = .2653). Note that this calculation is for 2010 after Goldman received substantial funds from the government and this does not include incentive payments that were not reported as salaries by Goldman to the FDIC. 5 Although salaries are more often carrying the expected negative sign, they are only significant in two asset groups. Loans to insiders in all asset groups for commercial banks are estimated to be negative and significant. The savings bank results in Table 8 mirror more closely the commercial banks than the credit unions, for example, the “giants” impact is similar and the loans to insiders all have the expected negative sign.
Net Worth as Percentage of Assets, U.S. Data, 1994-2010.

Note. Credit unions only in different asset groups. Robust standard errors are in parentheses.
When time dummies are excluded, unemployment and housing have the expected signs and are significant, whereas coefficients on salaries and insider loans stay basically the same.
Significance at the 10% level. ***Significance at the 5% level. ***Significance at the 1% level.
Net Worth as Percentage of Assets, U.S. Data, 1994-2010.
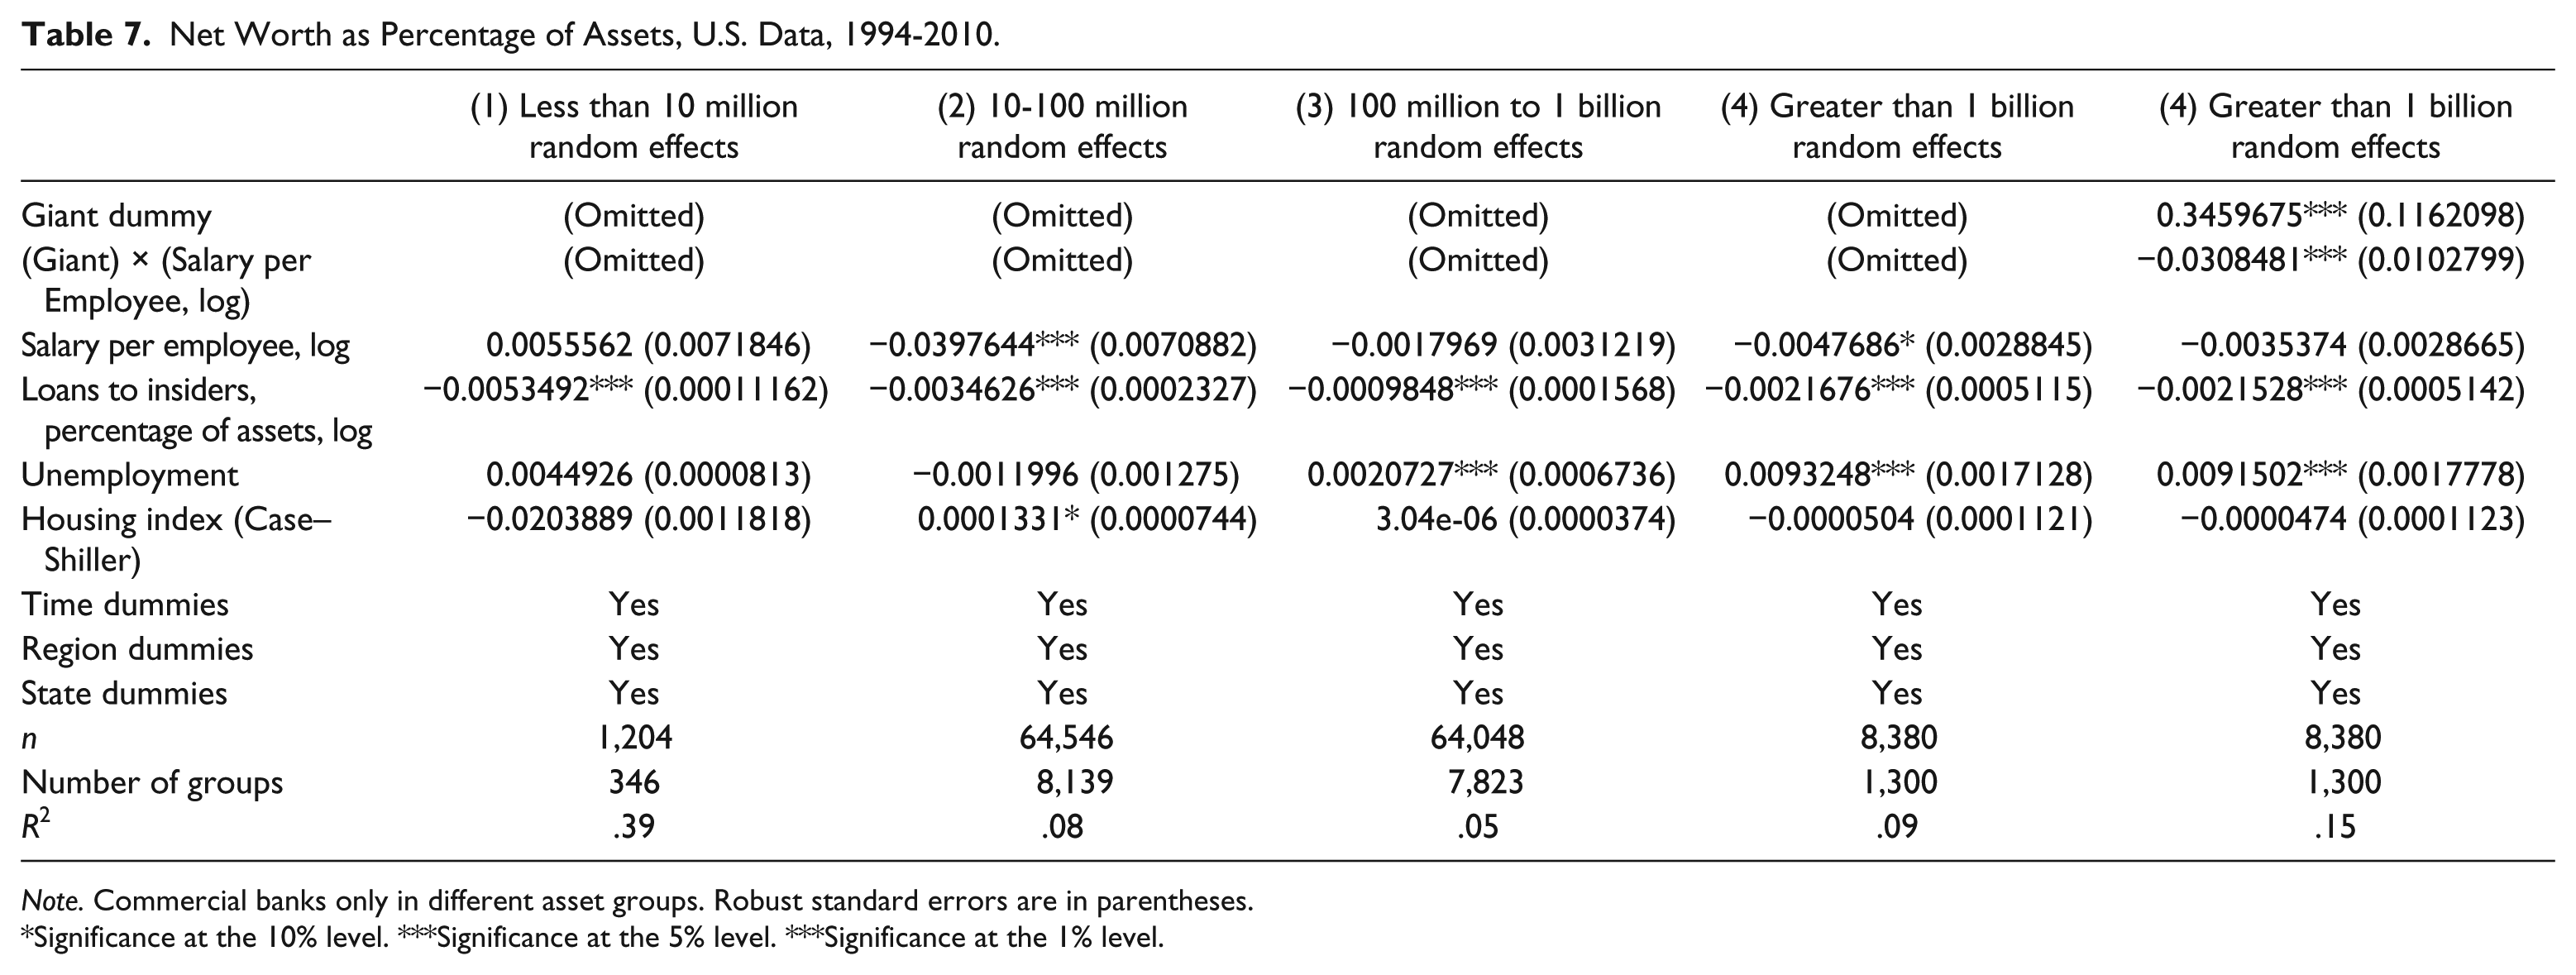
Note. Commercial banks only in different asset groups. Robust standard errors are in parentheses.
Significance at the 10% level. ***Significance at the 5% level. ***Significance at the 1% level.
Net Worth as Percentage of Assets, U.S. Data, 1994-2010.

Note. Savings banks only in different asset groups. Robust standard errors are in parentheses.
Significance at the 10% level. ***Significance at the 5% level. ***Significance at the 1% level.
The decision of what to pay and whether to make a loan to an insider could be considered contemporaneous choice variables of the firm, hence simultaneously determined with the dependent variable. Table 9 shows the Hausman–Taylor model in column 1 which accounts for this potential endogeniety, which is indicated by the Durbin–Wu–Hausman test, and allows for time-invariant variables. 6 Columns 2 to 4 in Table 9 are estimated in first differences to show robustness of the results in the presence of possible unit roots, which was found not to be the case with augmented Dickey–Fuller tests. 7 The results in Table 9 show similar levels and significance to those found in Tables 4 and 5.
Net Worth as Percentage of Assets, U.S. Data 1994-2010.

Note. Columns 2 through 4 use first differences of the dependent and right-hand side variables. Commercial bank is the excluded dummy. Robust standard errors are in parentheses. OLS = ordinary least squares.
Significance at the 10% level. ***Significance at the 5% level. ***Significance at the 1% level.
Policy Implications
The results here point to pay levels at large institutions being high enough to have a negative impact on firm capital levels. These calculations are made even though the data here probably capture a fraction of the real expenditures that might be considered part of internal compensation, especially for executives at larger firms. 8 It is interesting to note that the institutions that received the smallest amount of assistance from the government, credit unions, also have had consistently high levels of net worth and also pay employees the least. The high levels of pay seen in the largest institutions not only are correlated over the whole period with lower net worth but continued once the “Great Recession” forced taxpayers to help recapitalize what otherwise probably would have been bankrupt firms. Section 956 of the Dodd–Frank Act that addresses excessive and misaligned compensation has been codified by the Federal Reserve and the FDIC, but their oversight may not always be sufficient without public and congressional pressure. A number of studies have shown high wages in many industries are related to firm size, education, and union militancy among other factors. Although we were not able to control for all of these factors within this industry, we did control for a number of elements, including, for example, size, region, insider loans, year, and institutional form, and find that credit unions with all else held constant kept higher reserves to handle a possible downturn rather than distributing earnings to highly paid executives. The results reported here also are a reflection of the sentiment of large numbers of U.S. consumers who are transferring their savings to credit unions (Cole, 2012; Gelles, 2011; Worth, Hampel, & Schenk, 2012). Nevertheless, even these limited data show a negative correlation with pay, net worth, and insider loans. Large firms not only pay more, in line with the hypothesis from Berle and Means (1932), but their pay has risen at a faster pace than the smaller institutions. Over the time period of this study, this excess pay relative to the institutions that did not get bailed out at taxpayer expense adds up to hundreds of billions of dollars. These billions could have been given to shareholders or helped prevent possibly the bailouts given by the general public. Recapitalization of financial institutions is a major concern across the globe, and the attempt to maintain solvency by requiring sensible compensation seems to be one of the tools that may help.
Footnotes
Acknowledgements
The author thanks the participants of the conferences of the Western Economic Association International, San Francisco, June 2012, and the International Association for the Economics of Participation, Rutgers University, July 2012, for insightful comments, and also to the staff at the Federal Reserve, FDIC, and the National Credit Union Administration.
Declaration of Conflicting Interests
The author(s) declared no potential conflicts of interest with respect to the research, authorship, and/or publication of this article.
Funding
The author(s) received no financial support for the research and/or authorship of this article.