
Abstract
The study examined the significance of five sets of variables classified under personal characteristics, adaptive actions, climatic factors, building spatial characteristics, and neighborhood location characteristics in the determination of indoor thermal comfort and the impact of spatial comfort on residents’ preferences in space use. A thermal comfort survey was conducted among residents of 528 buildings in 12 selected residential neighborhoods of Ibadan metropolis in Nigeria. The impact of the urban microclimate on the building spaces was found significant. Indoor comfort assessment varied according to the different building design typology. The location and building characteristics were found to influence the indoor comfort of respondents. It was found that there were differences in air temperature measured within the spaces in the buildings. The thermal assessment of respondents for different spaces in their respective buildings also varied. There was very strong correlation between the most comfortable spaces, the most used spaces, and the first choice spaces voted by respondents at different periods of the day. Residents utilized adaptive actions and exhibited thermal consideration in the use of spaces. Adaptive movement from space to space due to variation in spatial comfort was confirmed in the study.
Keywords
Introduction
The level of functionality of residential buildings can be reflected by the types of spaces provided and their configuration. The utility of residential building spaces and the building design and configuration are interrelated components in the evaluation of the performance of the building. There are a number of factors to consider in examining the use of residential building spaces out of which are the user characteristics, the building design typology, and the indoor thermal environment. The indoor thermal comfort is a significant factor in the functionality of any building. The indoor thermal environment is constituted by the interaction of different factors of the climatic conditions and the building physical and spatial characteristics. The residents can provide an assessment of the indoor comfort based on their thermal experience within the spaces.
Indoor thermal comfort is of utmost concern with respect to the use of residential accommodation spaces. The thermal balance of the human body is influenced by both environmental and personal parameters. Variations would certainly occur in the distribution and intensity of the thermal comfort parameters from space to space and even within the spaces in a building. The variations are due to differing spatial characteristics due to factors relating to the building design, house type or typology, and orientation as well as location and neighborhood characteristics. The building type and typology are indicative of the design peculiarities.
There have not been many findings concerning the thermal response of people to the indoor environment in Nigeria. According to Ogunsote and Prucnal-Ogunsote (2002), there is paucity of research findings that are based on African people and their indoor thermal experience. This study will examine the significance of factors that are considered as potential determinants of indoor thermal comfort and also evaluate the impact of spatial comfort on residential space use and choice. The relevance of the article is that it contextually examines the levels of contributions of different variables to the determination of the thermal comfort of the residents of Ibadan metropolis, a warm-humid city in the southwestern part of Nigeria.
The conceptual basis of the study is to evaluate the input of sets of variables categorized into five groups on indoor thermal comfort as follows: Personal characteristics, Adaptive actions, Climatic factors, building Spatial characteristics, and neighborhood Location characteristics. The study aims at determining the ranges and levels of the thermal comfort votes of residents in the different spatial configurations that are available in the building types located in the various residential areas within Ibadan metropolis. This will give an insight into the impact that the diversity of characteristics exhibited by the residential buildings has on the thermal comfort votes of the residents. The multidimensional factors to be considered in relation to spatial variability and environmental diversity are conceived as essential to what generates the thermal environment within spaces as a result of the overall climate. The indoor comfort levels in residential buildings in Ibadan will be assessed by residents and their movements within the spaces and preferences in use will be evaluated in the field survey with a view to determining the impact of spatial thermal comfort on the functionality of building spaces in the residential design typologies.
Literature Review
Thermal comfort within residential living spaces cannot be discountenanced when considering building performance. According to Peeters (2008), residential buildings can vary much more in thermal comfort than public and commercial buildings. Markus and Morris (1980) pointed out that buildings act as barriers and as responsive filters concerning the environmental conditions. The occupants can only be satisfied if they are thermally comfortable. Thus, the thermal comfort of occupants of residential buildings is of utmost importance. The residential building must provide a functionally acceptable thermal environment. The home environment, being a place of rest, should present an atmosphere suitable for its purpose.
Any adverse effect of high levels of tropical urban air temperature on the residents’ comfort and use of spaces will affect the level of user satisfaction for the buildings. Although comfortable indoor environment is desirable for human activities, buildings in Nigeria are, however, thermally uncomfortable for considerable periods. This may be due to poor design standards. According to Givoni (1998), the urban climate and the building indoor climate are both parts of a climatological continuum. There is an operational regional natural climate that is modified at the urban scale by the structure of the town or city. This is further modified at the site scale by the individual building. Similarly, in each building endoclimate, there occurs a definition of different levels of spatial comfort. There is a variety of climatic effects on individuals, buildings, and communities, and thus, architecture and climate have mutual influence. According to Steane and Steemers (2004), a diverse environment giving the greatest degree of choice and widest range of conditions is desirable. Environmental diversity is closely related to people’s experience of architecture. There is a dynamic pattern of environmental variation. Variables such as heat, light, or sound may fluctuate over time and space. The fluctuation depends on such issues as the nature of the space, its occupancy pattern, the form of construction, and the climate. Diversity is a fundamental design criterion alongside comfort. The spatial diversity of buildings in the city imposes a multifarious variety of thermal environmental conditions due to several factors in the urban physical context.
The environmental aspects of architecture and the way in which people interact with buildings are of interest. According to Carl (2004), the concept of environmental diversity is intended not only to make environmental design responsive to a richer, and therefore more realistic spectrum of criteria, it also seeks to contribute to a more profound cultural issue. The environmental diversity relates to design in manifesting spatial contrast and distinctions in the thermal environment. Thermal conditions and fluctuations are influenced by architectural space and materiality in relation to solar orientation, wind direction, and response to diurnal temperature fluctuation. Thus, according to Steane and Steemers (2004), spatial and environmental design can never be separated. Thermal comfort is in part a psychological phenomenon open to influence by variables other than thermal. Field-based thermal comfort research recognizes the significance of behavior, context, and culture.
The study of thermal comfort has taken a psychological dimension along with the initial physiological approach. Whereas the physiological concept laid the foundation for relating the physical parameters of an environment to the thermal state of the body physiology and health, the human subjective psychology gave insight into the human experience of thermal comfort (Fisk, 1982; Frank, Raja, Bulcao, & Goldstein, 1999; Szokolay, 2008). Fisk (1982) asserted that the psychological approach to the study of thermal comfort is more relevant because of the need to decipher the different levels of comfort within different environmental conditions. To buttress this, Frank et al. (1999) and Lin, DeDear, and Hwang (2010) also emphasized the role of subjective thermal comfort. The subject of thermal comfort has become more context specific in terms of the human respondent, the climate of the area, and the spatial configuration of buildings. The fact that urban building spaces may present diversified thermal conditions due to the different spatiostructural elements means that the thermal comfort experienced by residents within most urban buildings is actually of an adaptive nature. People are certain to make use of the available spaces around them in response to the varying thermal environmental conditions within those diversities of spaces.
The characteristics of building users may actually take a role in the determination of their pattern of use of the room spaces. These characteristics include socioeconomic, educational level, enlightenment and intellectual exposure, cultural and traditional values, and background. All these affect the personality of building users, which ultimately has a notable input in their behavioral tendencies. The behavioral tendencies have an expression in the adaptive actions taken within thermal environments. The adaptive nature of human thermal comfort has been expressed as being a means of extending the comfort conditions within spaces as occupants utilize the adaptive opportunities available to them. The adaptive principle states that if a change occurs such as to produce discomfort, people react in ways that tend to restore their comfort (Nicol & Humphreys, 2002). The behavioral tendencies of building users as regards relocation within a space or from space to space as well as adjustments in clothing, posture, and activity level all contribute to the attainment of adaptive thermal comfort. Movements within the building as necessary adaptive actions as well as user preferences for more comfortable conditions will contribute to the space use pattern for the residents.
In this article, the conceptual consideration of possible factors influencing indoor thermal comfort under five categories of variables is being explored. The factors considered relevant to thermal comfort assessment are hereby categorized as personal, adaptive, building spatial characteristics, locational (neighborhood) characteristics, and climatic (environmental). The additional study of neighborhood location characteristics and the broadening of the possible variables for the personal and building spatial characteristics point to the need for of further research along these areas to evaluate their significance to indoor thermal comfort. The building spatial characteristics and neighborhood characteristics create environmental diversity and are thus listed as possible factors of thermal comfort in the study. The article also relates the movement adaptive actions to the level of comfort in spaces and the choice and preference of spaces used in residential buildings in a warm-humid urban environment.
Study Area
Ibadan metropolis, the study area, is located on latitude 7°23′N and longitude 3°55′E in the southwestern part of Nigeria. The location, site features, and the sampling sites are as shown in Figure 1. The city ranges in elevation from 150 m above sea level in the valley area to 275 m on the major north-south ridge that crosses the central part of the city (http://www.absoluteastronomy.com/topics/Ibadan). The climate type is described as tropical wet and dry with a lengthy wet season. There are two broad seasonal patterns in Ibadan, namely, the dry season (November to April) and the rainy season (May to October) according to Ideriah and Suleman (1989). The selected 12 neighborhoods for the thermal comfort field survey were the following: Agbowo, Challenge, Aliwo, Mokola, Oke-Ado, Ile-titun, and Apata (seven high-density neighborhoods); Abayomi, Ijokodo, and Odo-Ona-Elewe (three medium-density neighborhoods); and New Bodija and Idi-Ishin (two low-density neighborhoods).

The site of Ibadan.
Method
The conceptual basis of the study is to evaluate the input of sets of variables (categorized into five groups) on the indoor thermal comfort. The groups of factors are as follows: Personal characteristics of respondents, Adaptive actions of respondents, Climatic factors (Environmental parameters), Spatial characteristics of the buildings, and Location characteristics of the neighborhoods. The generation of the indoor condition is primarily as a result of the outdoor climatic conditions while the building acts as the modifier of the generated condition to produce the indoor environment. The location factors serve as accentuations for the effect of the climatic factors on the indoor conditions. The perception of the thermal environment is further personally realized by the subjects within the indoor space as the indoor condition permeates through the personal factors. The thermal feeling experienced by the subject will also take account of the adaptive actions taken by the subject.
A thermal comfort survey was conducted in Ibadan metropolis. Ten percent (12) of the 119 neighborhoods identified from the metropolitan map were selected by stratified random sampling comprising two low-, three medium-, and seven high densities. The number of houses in each of the neighborhoods was estimated to be an average value of 885 based on data from National Bureau of Statistics (2008). A sample size of 5% of this gave 44 houses in each neighborhood, which were selected using systematic random sampling to give a total of 528 houses. For the statistical level of accuracy of the sample used, taking a confidence level of 95%, the confidence interval or margin of error was 4.26%. For each selected building, observation and measurements were used to assess the physical, spatial, and location characteristics in relation to thermal comfort. The selected buildings were categorized according to spatial diversity factors considered relevant to the study of thermal comfort as discussed by Givoni (1998). The factors used were the following: type of accommodation, design typology, form, fenestration type and size, wall and roof materials, special design features, orientation, and color of wall. The environmental factors considered in categorizing the selected neighborhoods into different environmental situational types were in relation to the microclimate and thermal comfort within the city environment as discussed by Givoni (1998), Santamouris et al. (2001), and Santamouris (2010). They were the following: building density, level of traffic, proximity to water body, proximity of industries, and pollutants and level of pollution. Others were the terrain and the presence of green areas. The selected neighborhoods were categorized using previous findings on the study area and the preliminary survey of the study area. The city of Ibadan was divided into residential density areas as presented in Abumere (1994). Filani (1994) discussed transportation in Ibadan and indicated the traffic levels on the city roads based on number of vehicles per day. The environmental pollution situation in Ibadan was assessed by Ayoade (1994) and Ayeni (1994) also presented highlights of the topography of the study area. The study drew from the results of previous studies done with respect to environmental and spatial diversity factors of the study area. The previous results were verified with the situation in the study area during the present study and applied in the analysis of the present study.
An adult member of a household in each selected house was sampled for questionnaire administration. Indoor thermal comfort assessment was done by the respondents using the American Society of Heating, Refrigerating, and Air-Conditioning Engineers (ASHRAE) thermal sensation scale. Respondents also rated their respective building spaces according to use pattern by relative amount of time spent and level of comfort for different periods of the day and their choice of spaces. They indicated their adaptive actions in their respective houses. The respondents that were literate filled the questionnaire independently as they monitored their thermal feelings during the day but about 15% of respondents with lower literacy level were interviewed to complete the questionnaire from memory.
The measurements of relevant climatic parameters were done in representative buildings in the neighborhoods. The weather-measuring instruments used comprised the following: La Crosse Technology Instant Transmission Plus Weather Stations, which offered immediate update of all outdoor and indoor climatic data measured from transmitters (with the indoor temperature range of −9.9 to +59.9 °C with 0.1 °C resolution and ±1 °C accuracy, outdoor temperature range of −39.9 to 59.9 °C with 0.1 °C resolution and ±1 °C accuracy and humidity range of 1% to 99% with 1% resolution and ±5% accuracy); Smart Sensor Intell Plus Electronic Anemometers (with wind speed range of 0-30 m/s, 0.1 m/s resolution, and ±5% accuracy); and Multi-Thermo Digital Instruments (with resolution of 0.1 °C and accuracy of ±1 °C). In the respective representative sampled houses within the 12 neighborhoods where measurements were taken, the weather stations sensors were positioned at a mounting height of 1.25 m above ground level and fitted to a sheltered wall to avoid direct sunshine and precipitation. The survey was done in April, which was analyzed to be one of the hottest months in the study area. The rating of thermal response range from −3 through 0 to +3 as indicated in Table 1. It was the mean comfort vote that was utilized in the analysis. The mean comfort vote was calculated using the following computation:

The ASHRAE Scale of Warmth.

Note. ASHRAE = American Society of Heating, Refrigerating, and Air-Conditioning Engineers.
Research Findings
Relevant data were collected from the study and analyzed, and the findings are hereby discussed in this section under the following headings.
Characteristics of the Respondents
A total number of 528 respondents were surveyed in Ibadan metropolis. Out of this number, 271 were male (51.3%) and 257 were female (48.7%). About 42.8% of the respondents’ were of age 18 to 30 years, 45.6% were 31 to 54 years, and 11.6% were 55 years and above. There were 171 owner occupiers (32.4%) and 357 tenants (67.6%) identified. With respect to highest educational level attained, there were 30 respondents who had primary school education (5.7%), 185 had secondary school education (35%), 271 had tertiary education (51.3%), and 42 had postgraduate education (8%). Concerning their length of stay in their respective houses, 18% had stayed for 1 to 2 years, 54.7% had stayed for 3 to 10 years, and 27.3% had stayed for more than 10 years. The respondents’ value judgments were therefore reliable.
The chi-square test was employed to examine the possibility of relationship between the adaptive thermal response of the respondents taken within their respective living room space in the afternoon period and their personal characteristics. The relevant variables among the personal characteristics were the following: Sex, Physical stature, Weight, Educational level, Length of stay in house, Physical activity, Time of last meal, and Level of sweating (Table 2).
Chi-Square Result Testing Relationship of Personal Variables to Adaptive Thermal Response.

Note. Asymp. sig. = asymptotic significance.
Characteristics of the Buildings and Thermal Comfort Assessment of the House Types
The residential buildings considered were of diversified characteristics. However, majority of the buildings in Ibadan metropolis were naturally ventilated. The total number of residential buildings sampled was 528 with 88 located in two low-density neighborhoods, 132 located in three medium-density neighborhoods, and 308 located in seven high-density neighborhoods. The residential building types consisted of 63 face-to-face bungalows (11.9%), 202 face-to-face story buildings (38.3%), 107 bungalow flats (20.3%), 107 story flats (20.3%), and 49 duplex buildings (9.3%). Appendix A shows the floor plans of typical surveyed buildings in the metropolis. The face-to-face types are built such that rooms are lined up facing one another in two rows with a central corridor space in-between. The story classifications are residential buildings with two or three floors. According to typology, there were 60 traditional buildings (11.4%), 237 vernacular buildings (44.9%), and 231 contemporary buildings (43.8%). Photographs of the typical house types are shown in the Appendix B.
The mean comfort votes of respondent’ thermal comfort assessments were categorized into building types. The analysis indicated that the duplex buildings were assessed as the most comfortable building type, whereas the face-to-face story buildings were assessed as the most uncomfortable building type during the afternoon period (Table 3). Results also implied that contemporary buildings were assessed as the most comfortable typology while vernacular buildings were assessed as the least comfortable typology (Table 4). The variations in the mean votes of thermal responses for the different building types implied that the different building types presented different indoor thermal conditions. The level of indoor comfort was reflected in the mean comfort vote values. From this it can be deduced that the diversity of building characteristics and location was influential on the thermal responses of the respondents.
Assessment of the Mean Comfort Votes of Respondents by Building Type.

Source. Adunola (2011).
Assessment of the Mean Comfort Votes of Respondents by Typology.

Source. Adunola (2011).
Impact of Building and Location Characteristics
The tabulation of mean thermal response votes according to building types within the 12 different neighborhoods considered in the study, as presented in Table 5, indicated different levels of intricacies in the variations of mean comfort votes. The insinuation from this result was that mean comfort votes calculated for each case was indicative of the level of adaptive thermal comfort of the respective buildings relative to their peculiar spatial and neighborhood characteristics among other factors. The result showed the diversity of building characteristics and location in terms of thermal responses of the respondents.
Assessment of the Mean Comfort Votes of Respondents.

The building spatial and location characteristics were found to be significantly related to the adaptive thermal response in the afternoon critical period according to the results of the chi-square test as presented in Tables 6 and 7. The confirmation of the relationship between adaptive thermal response and spatial variables like Type of accommodation, Typology, Plan and Form, Wall material, Color of walls, Roof material, Orientation, Fenestration type, and Number of semi-outdoor spaces established the significance of the variations found in the results of calculated mean votes of thermal responses across different buildings and neighborhoods.
Chi-Square Result Testing Relationship of Spatial Variables to Adaptive Thermal Response.

Note. Asymp. sig. = asymptotic significance.
Chi-Square Result Testing Relationship of Location Variables to Adaptive Thermal Response.
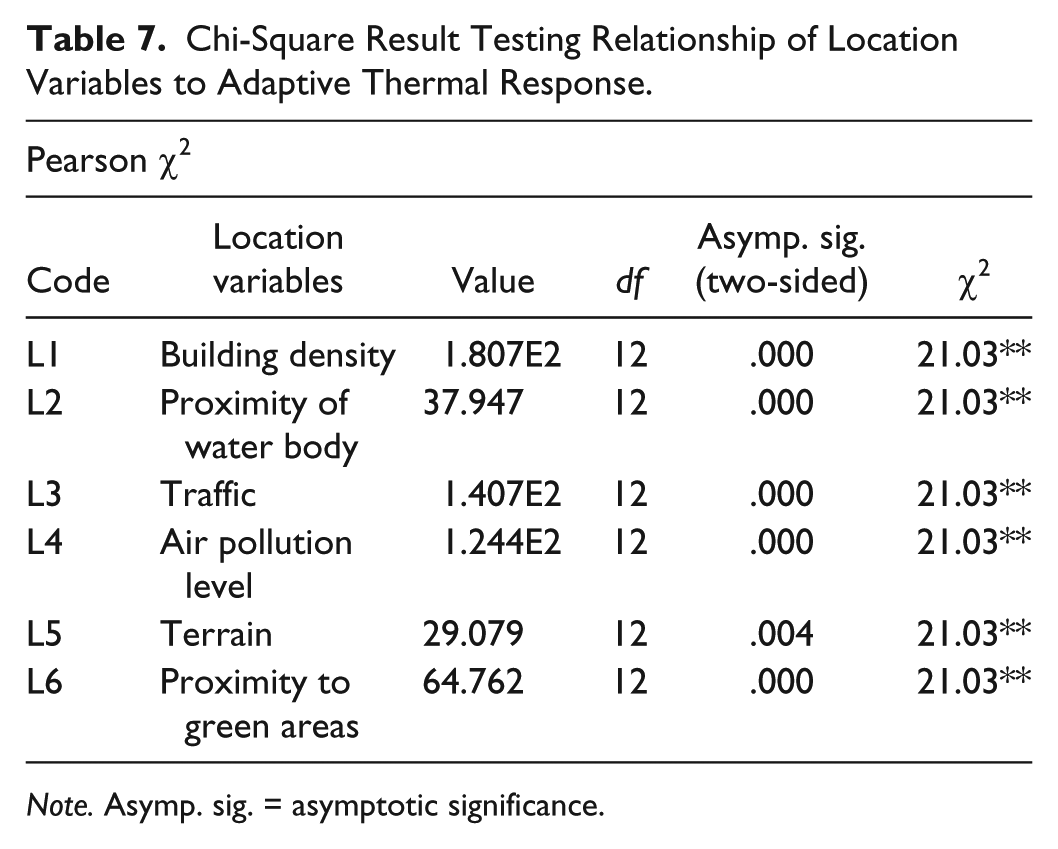
Note. Asymp. sig. = asymptotic significance.
Likewise, the confirmation of relationship between adaptive thermal response and location characteristics like Building density, Traffic, Air pollution level, Proximity of water body, Proximity of green areas, and Terrain also established the significance of the variations found in the results of calculated mean comfort votes of thermal responses across different locations as presented earlier. The noted differences in indoor comfort assessment across the residential densities were therefore significant and were related to the different location characteristics of the buildings in the study area.
Influence of Indoor Climatic Factors on Indoor Comfort
The influence of the indoor climatic factors as predictor variables on indoor comfort was examined using regression analysis taking adaptive thermal responses at different periods of the day as the respective dependent variables. A sample of data collected from the measurements of climatic parameters in some locations is presented in Appendix C. The set of predictor variables explained 14.5% of the variance of adaptive thermal response in the morning and 11.8% of the variance of the adaptive thermal response in the afternoon. They also explained 21.7% and 23.1% of the variances of adaptive thermal response in the evening and night, respectively (Appendix D).
The equations found relating them were the following:


where y = thermal response, C1 = air temperature, C2 = relative humidity, C3 = mean radiant temperature, and C4 = air velocity.
The results indicated the varying and relative significances of the indoor factors at different periods of the day. It should therefore not be assumed that the combined and relative impacts of climatic variables were constant but that there were differences as shown in the four equations obtained and the fluctuations in the R-squared values. The results support the fundamental concept of the four environmental parameters of thermal comfort being air temperature, relative humidity, mean radiant temperature, and air velocity as stated by Fanger (1973), Givoni (1976), and Markus and Morris (1980). It also gave an additional information on the fluctuating impact of each climatic factor and the variation in the combined influence on indoor comfort through the periods of the day.
The results indicated that the outdoor climatic factors were also strongly related to the indoor thermal conditions just like the indoor climatic factors. The respective R-squared values were quite comparable with those for indoor factors signifying almost similar levels of influence on the indoor comfort of respondents. The influence of outdoor climatic factors was also not static individually or collectively through the periods of the day as indicated in the different R-squared values and varying significances of the variables for the different periods. The results confirmed that the indoor climatic factors were actually functions of the outdoor climatic factors. The values of the outdoor climatic factors could therefore be valuable in determining indoor comfort using the derived equations. This finding supported the conclusions of Humphreys (1978) and Auliciems (1981) that thermal neutrality is a function of the prevailing climate. In their separate studies, Humphreys and Auliciems had related the neutrality temperature to the average outdoor mean temperature.
Adaptive Actions of Respondents and Influence on Space Use
The adaptive actions taken by respondents during the afternoon period were analyzed, and the summary of results is shown in Table 8. The findings indicated that larger proportion of respondents utilized the adaptive opportunities available to them. From this analysis, it can be deduced that the respondents took adaptive actions in the discomfort of the afternoon period considered according to the adaptive principle. Also, it was found that significant percentages of respondents utilized the movement adaptive actions. In terms of movement actions of respondents, movement to the verandah, porch, or courtyard was utilized most by respondents. This inferred that the verandah, porch, and courtyard offered better alternative of comfort to the respondents compared with other spaces and the outside in the afternoon period.
Analysis of the Adaptive Actions Taken by Respondents.

More than the number of respondents surveyed as a result of respondents’ utilization of more than one adaptive action.
The adaptive behavior of building occupants takes two basic forms. These are adjustment by changes in clothing, activity, posture, and so on, to make the occupant comfortable in prevailing conditions and an adjustment of indoor conditions by the use of controls such as windows, blinds, fans, and the occupant may also migrate to find improved conditions. It can be seen in the results that the respondents utilized both forms of adaptive behavior. The second option of use of controls and migration was, however, more utilized than the personal adjustment option. This is a pointer to the need for adaptive opportunity in buildings to enhance this second option. It was inferred that respondents would consider changing something in relation to the building space first before trying an adaptive action with a personal application to reduce discomfort. Respondents may also find it easier to direct their children to effect the desired changes. It was inferred from the results that residents moved from space to space and within spaces in relation to the thermal condition of the indoor spaces. This is a pointer to the impact movement adaptive actions made on space use. The observed and recorded adaptive movements of respondents suggested that thermal comfort considerations were utilized by respondents in the use of the building spaces.
Measured Indoor Air Temperature Variation in the Building Spaces
The values of air temperatures were measured in the living and bedroom spaces of representative buildings in the neighborhoods to provide information about temperature variations within the respective buildings. The variation of one of the four indoor climatic parameters across the spaces was examined because the variation of any one of the parameters can lead to a variation in the thermal comfort. The regression analysis result earlier showed the relationship between thermal response and the indoor climatic parameters. The measurement data for one of the buildings is presented in Table 9 to display typical variations. It was found that the differences in temperature considered from space to space in each of the buildings were within the range of 0.1 to 0.7 °C. It was also noted that values were sometimes similar for some adjacent spaces. The variations in air temperature, however slight, inferred that levels of comfort would be different from space to space in each of the buildings. Similar buildings would also have about the same variation in the temperatures of spaces. It was also inferred that the difference in room temperatures from building to building would be in the same order or less within particular neighborhoods.
Measured Values of Air Temperature for All Spaces in a Flat at Mokola.
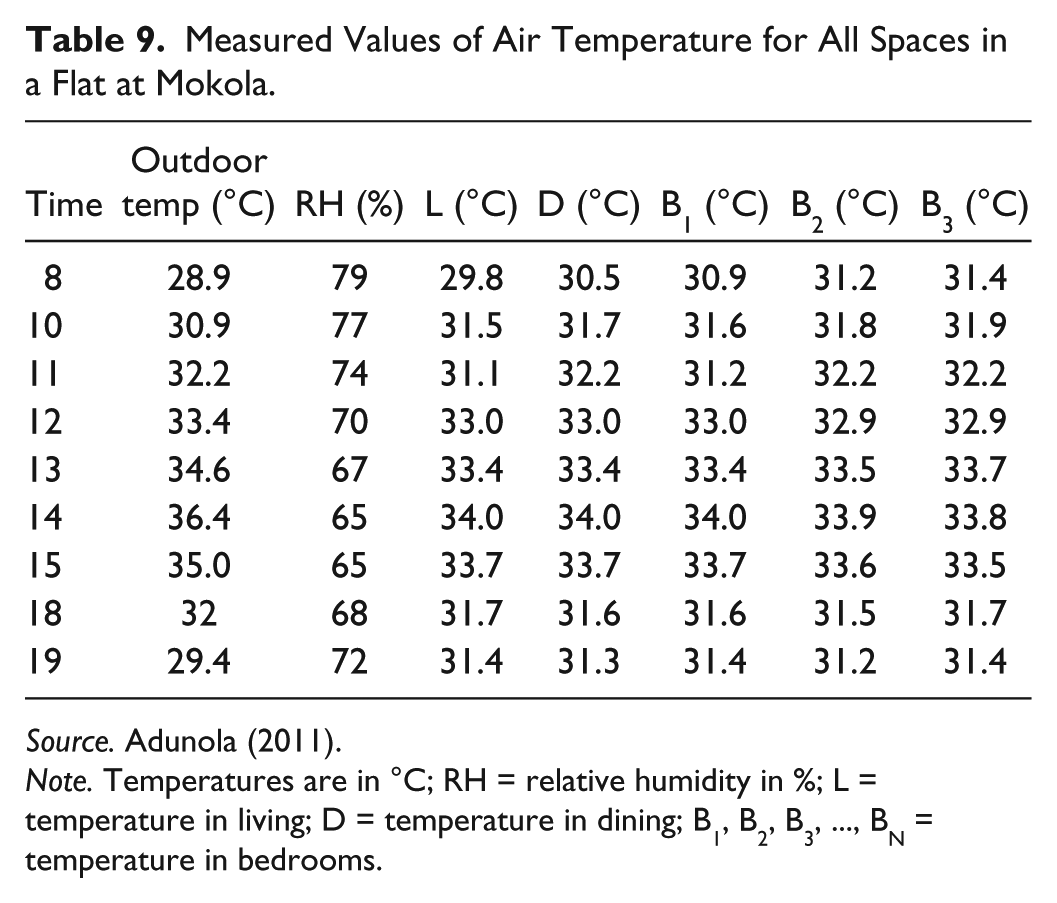
Source. Adunola (2011).
Note. Temperatures are in °C; RH = relative humidity in %; L = temperature in living; D = temperature in dining; B1, B2, B3, …, BN = temperature in bedrooms.
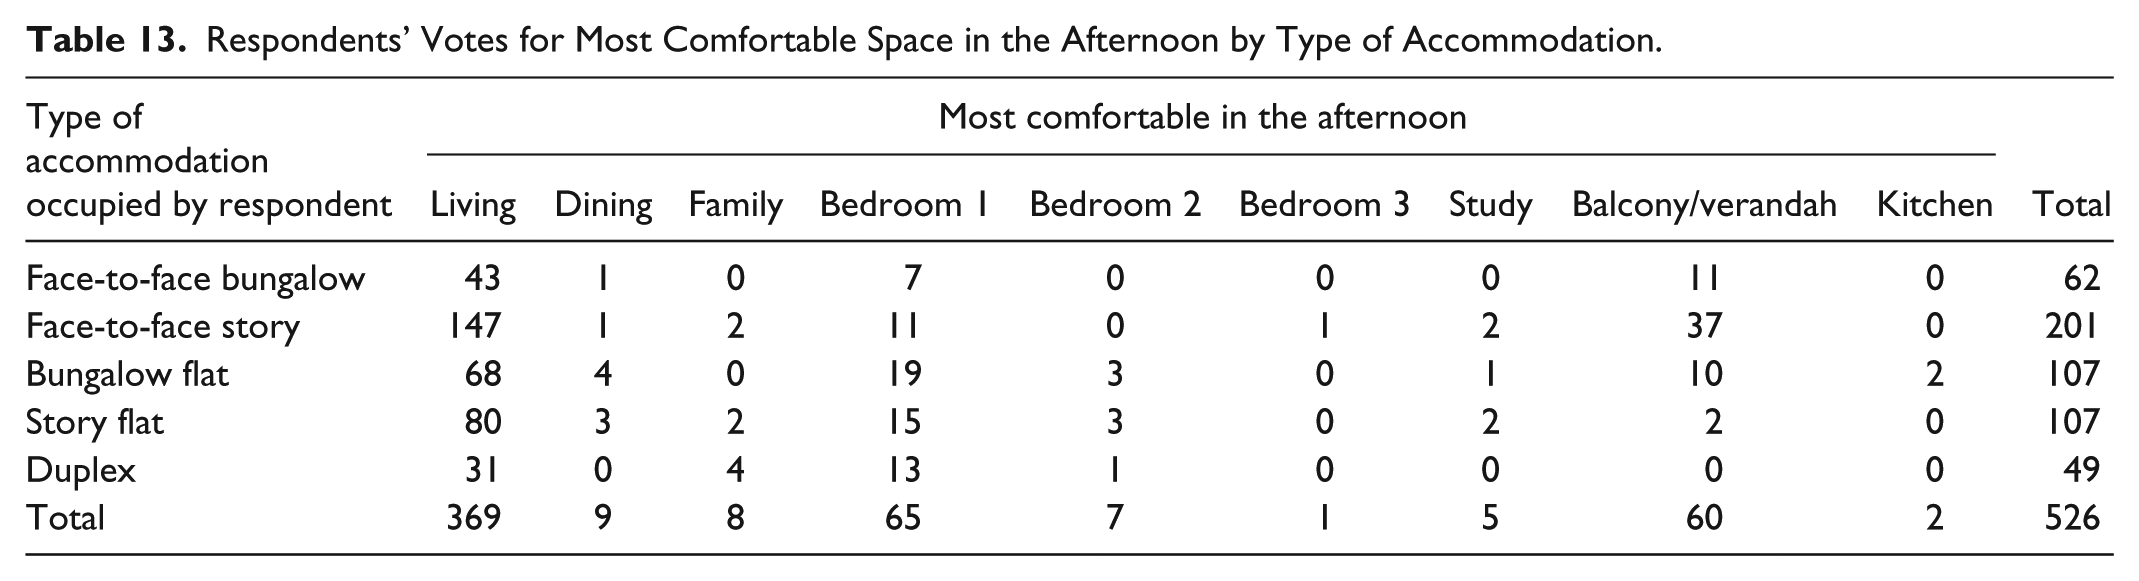
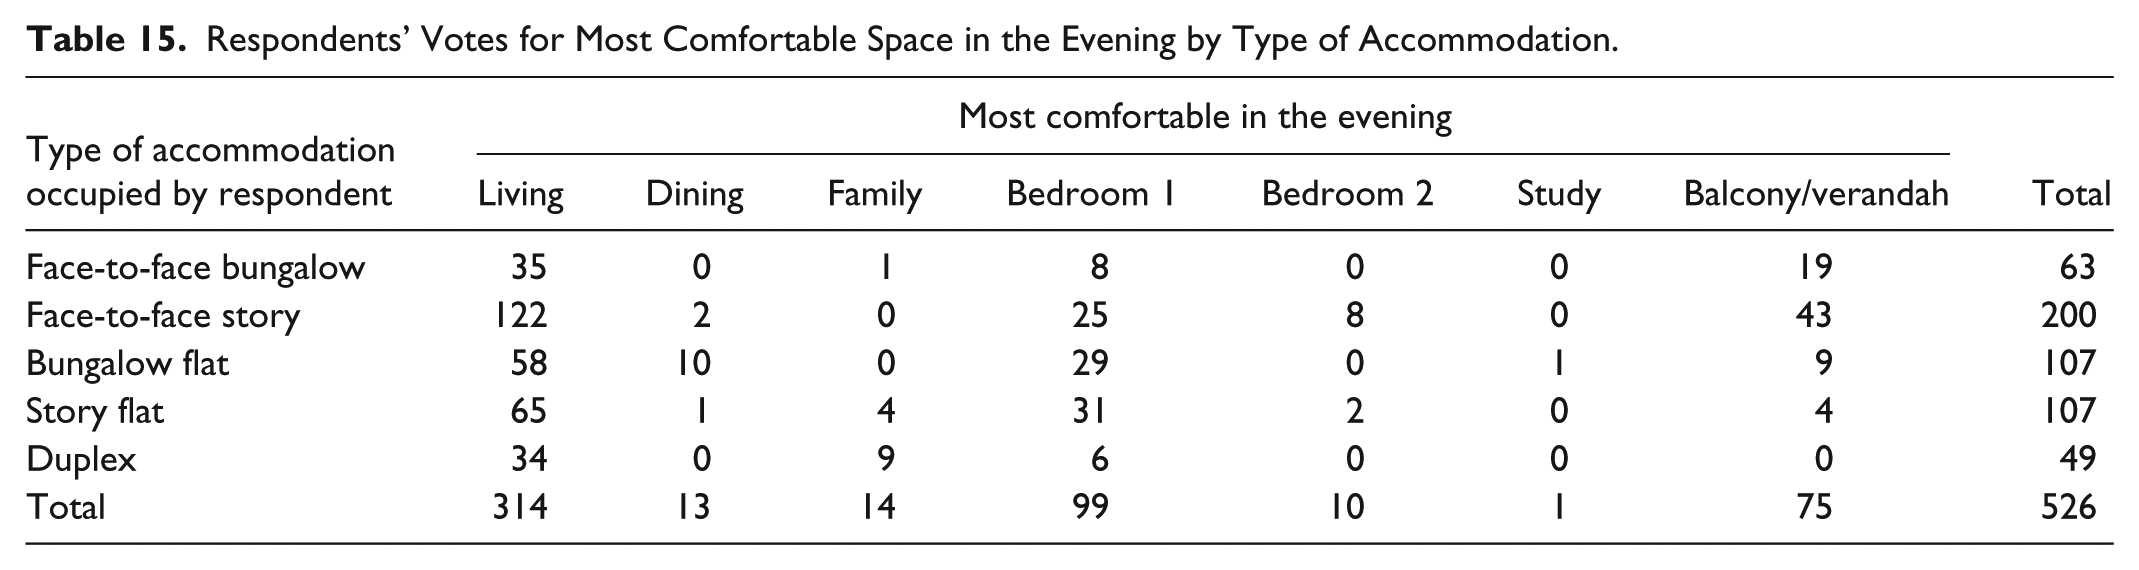
Respondents’ Use and Choice of Spaces and the Most Comfortable Spaces
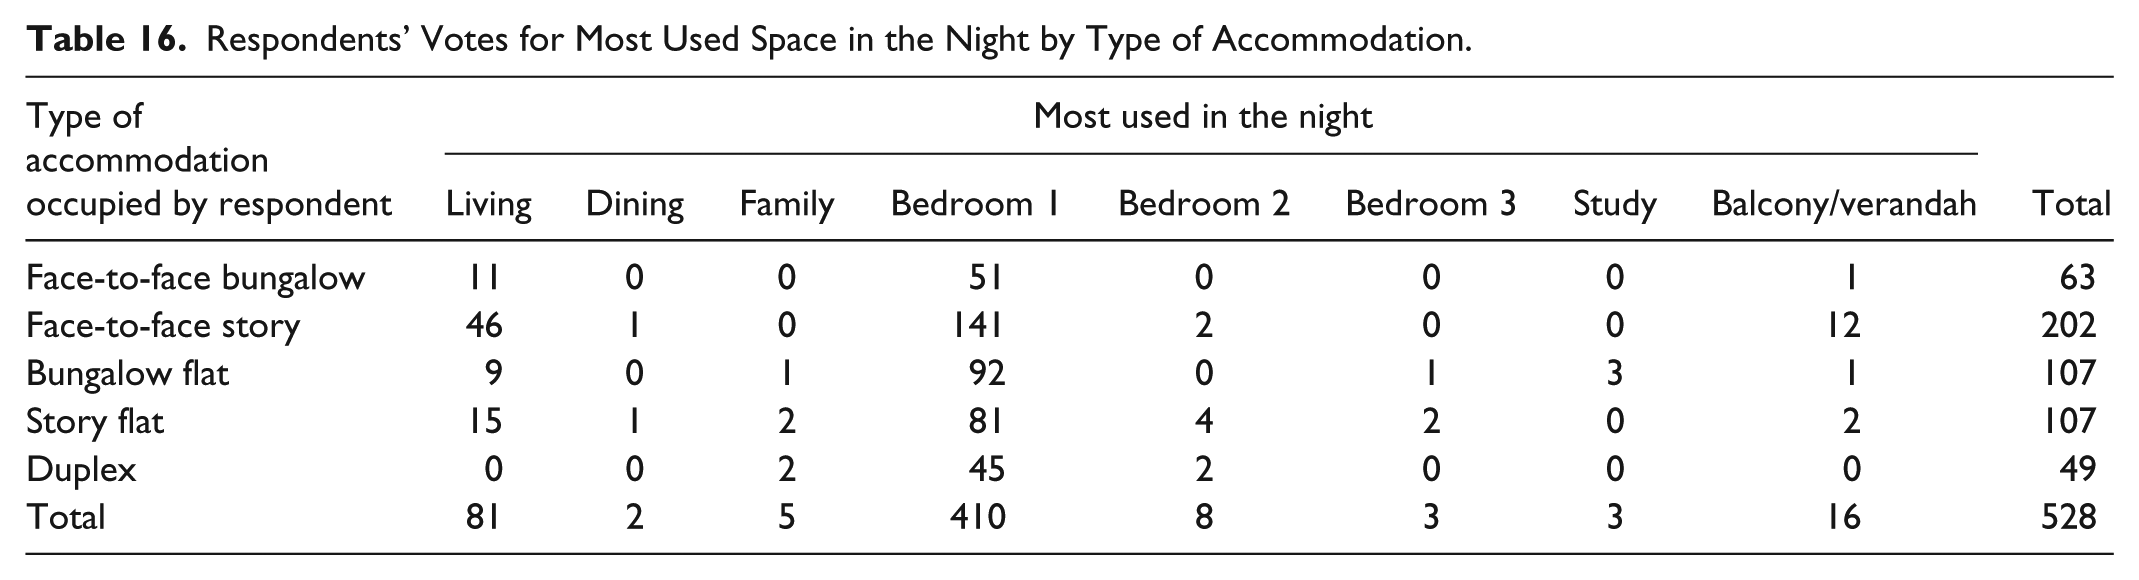
The respondents rated one of the spaces in their building as the most comfortable for each of the different periods of the day. They also indicated the space where they usually stayed at those periods. The analysis indicated similar results for the most comfortable spaces and the space where respondents stayed at the different periods of the day (Tables 10-17). From the results, it was implied that the living room space was the most comfortable and most used space in majority of the buildings surveyed in the study. The bedroom and the verandah and balcony spaces were also indicated as most comfortable and most used spaces in significant percentages of the surveyed buildings. It could be implied from the results that there was remarkable agreement between the most comfortable space, the most used space, and the first choice or preferred space as indicated by the respondents. The result agreed with the findings of Merghani (2004) that use patterns are related to comfort level of room spaces. Respondents voted in similar patterns through the four periods of the day with respect to space comfort, space use, space choice, and preference. The substantial respondents’ votes for the verandah or balcony space as most comfortable, most used, and also most preferred or first choice space especially in the afternoon and evening periods implied the importance of these semi-outdoor spaces in buildings with respect to indoor thermal comfort. The positive influence of semi-outdoor spaces on adaptive thermal comfort was clearly implied by this analysis, which showed that many respondents used the verandah or balcony more than other spaces and considered it more comfortable than other spaces in the afternoon and evening periods.
Respondents’ Votes for Most Used Space in the Morning by Type of Accommodation.

Respondents’ Votes for Most Comfortable Space in the Morning by Type of Accommodation.

Respondents’ Votes for Most Used Space in the Afternoon by Type of Accommodation.

Respondents’ Votes for Most Comfortable Space in the Afternoon by Type of Accommodation.
Respondents’ Votes for Most Used Space in the Evening by Type of Accommodation.

Respondents’ Votes for Most Comfortable Space in the Evening by Type of Accommodation.
Respondents’ Votes for Most Used Space in the Night by Type of Accommodation.
Respondents’ Votes for Most Comfortable Space in the Night by Type of Accommodation.

Correlation of Space Comfort, Space Use, and Respondents’ Choice
The statistical tool of correlation was used to examine if there was any association between residents’ choice of room spaces and the thermal comfort level within the spaces with respect to the assessment of the most comfortable spaces at different times of the day. It was found that the space rated as the most comfortable in the morning by respondents had very strong correlation with the following: where respondents usually stayed in the morning (r = .484 at p < .001 level of significance [l.o.s.]), first choice of space in morning (r = .508 at p < .001 l.o.s.), and second choice of space in morning (r = −.275 at p < .001 l.o.s.). Also the space where respondents usually stayed in the morning had very strong correlations with the respondents’ first choice of space in the morning (r = 0.662 at p < .001 l.o.s.) and the respondents’ second choice of space (r = −.317 at p < .001 l.o.s.).
It was found that the space rated as the most comfortable in the afternoon by the respondents had very strong correlation with the following: where respondents usually stayed in the afternoon (r = .504 at p < .001 l.o.s.), first choice of space in afternoon (r = .519 at p < .001 l.o.s.), second choice of space in afternoon (r = −.301 at p < .001 l.o.s.), and third choice of space in the afternoon (r = −.103 at .018 l.o.s.). Also, the space where respondents usually stayed in the afternoon had very strong correlation with the respondents’ first choice of space in the afternoon (r = .842 at p < .001 l.o.s.), respondents’ second choice of space in the afternoon (r = −.443 at p < .001 l.o.s.), and respondents’ third choice of space (r = −.143 at p < .001 l.o.s.). Similar to afternoon results, it was found that the space rated as the most comfortable in the evening by the respondents had very strong correlation with the following: where respondents usually stayed in the evening (r = .580 at p < .001 l.o.s.), first choice of space in evening (r = .601 at p < .001 l.o.s.), second choice of space in evening (r = −.330 at p < .001 l.o.s.), and third choice of space in evening (r = −.097 at .026 l.o.s.). Also, the space where respondents usually stayed in the evening had very strong correlation with the respondents’ first choice of space in the evening (r = .868 at p < .001 l.o.s.), the respondents’ second choice of space in the evening (r = −.472 at p < .001 l.o.s.), and the respondents’ third choice of space (r = −.174 at p < .001 l.o.s.). It was also found that the space rated as the most comfortable in the night by the respondents had very strong correlation with where respondents usually stayed in the night (r = .427 at p < .001 l.o.s.) and the first choice of space in the night (r = .410 at p < .001 l.o.s.). Also the space where respondents usually stayed in the night had very strong correlation with the first choice of space in the night (r = .404 at p < .001 l.o.s.).
The above correlation confirmed the earlier results of frequency analysis of the respondents’ rating of most comfortable space, most usually used space, and first choice space at different periods of the day. The strong correlation found between the considered spaces as voted by respondents were at very high levels of significance as indicated confirming the relationships. Room choice correlating with room comfort levels was also reported by studies in Heerwagen, Loveland, and Diamond (1991) and Al-Azzawi (1996). The result of strong and significant correlation inferred that patterns of use of spaces related to comfort levels of room spaces as indicated by Merghani (2004). The lower correlation values for the second choice and third choice spaces as compared with the first choice space for respective periods distinctly indicated that reduced levels of preference for spaces was related to comfort levels. As indicated in the earlier analysis, the first choice space was generally the same space voted as the most comfortable space by the respondents.
Conclusion and Debate
The factors considered under the five categories of residents’ personal characteristics, residents’ adaptive actions, climatic factors, building spatial characteristics, and neighborhood location characteristics were found to be significant in their influence on the thermal response of the residents in this study. The results, though limited in context to the Ibadan metropolis, provide a justification for the need for further examination of the considered additional categories of factors for indoor thermal comfort assessment both within the study context and other contexts. The levels of indoor thermal comfort experienced by residents were found to vary according to the spatial diversity of the buildings as well as the urban physical contextual diversity of the neighborhoods in the study area. The level of comfort was confirmed to vary from space to space within the buildings and there was correlation between the space comfort, the level of use of space, and the respondent’s choice of space at the different periods of the day. It can be inferred from the study that the functional utility of the residential building spaces was dependent on their thermal conditions based on residents’ assessment. The movement adaptive actions of respondents from space to space within the residential buildings in this study gave inference to the significance of indoor thermal comfort with respect to the preferences exhibited by the adult residents assessed in their use of building spaces. The adaptive nature of indoor thermal comfort was found to be significant to the use of the residential spaces. It must be noted, however, that there are limitations in terms of context on the study and the findings in the study are not being presented as generalizations. The article submits that there is need for further exploration of the consideration of additional factors significant to indoor thermal comfort assessment beyond the personal, environmental, and adaptive factors and on the relationship between thermal comfort and the preferences for use of residential space.
Footnotes
Appendix A
Appendix B
Appendix C
Measurements in a Face to face Building at Abayomi (Medium Density Neighborhood) in April 2010.

| Temperature morning 10:00 a.m. (°C) | Temperature afternoon 3:00 p.m. (°C) | Temperature evening 6:00 p.m. (°C) | Temperature night 9:00 p.m. (°C) | |
|---|---|---|---|---|
| Outdoor | 30.5 | 35.8 | 32.7 | 28.2 |
| Living | 31.5 | 34.0 | 33.3 | 31.1 |
| Dining | 31.6 | 34.0 | 33.3 | 31.1 |
| B1 | 31.6 | 34.0 | 33.3 | 31.1 |
| B2 | 31.6 | 34.0 | 33.3 | 31.1 |
| B3 | 31.6 | 34.0 | 33.3 | 31.1 |
| Living | 31.4 | 34.2 | 33.2 | 30.9 |
| Dining | 31.4 | 34.1 | 33.0 | 30.8 |
| B4 | 31.4 | 34.1 | 33.0 | 30.8 |
| B5 | 31.4 | 34.0 | 33.0 | 30.8 |
| B6 | 31.4 | 34.0 | 33.0 | 30.8 |
| RH (%) | 77 | 64 | 66 | 71 |
| I.A.V. (m/s) | 0.1 | 0.0 | 0.1 | 0.1 |
| O.A.V. (m/s) | 0.5 | 0.2 | 0.8 | 0.5 |
Note.
Appendix D
Declaration of Conflicting Interests
The author(s) declared no potential conflicts of interest with respect to the research, authorship, and/or publication of this article.
Funding
The author(s) received no financial support for the research and/or authorship of this article.