
Abstract
Technical support through co-creation of value in automotive paint processes and activities is essential to the success of paint manufacturing companies. This study aimed to explore the impact of technical support on customer satisfaction through value-in-use in the automotive paint market. A quantitative questionnaire survey involving a convenience sample of 169 respondents was used for data collection. The questionnaire design bore on the SERVPERF instrument with embedded value-in-use attributes. The data were analyzed by using SPSS 21 statistical methods exploratory factor analysis (EFA) and multiple regression analysis (MRA). The findings of this study revealed that the key value-in-use attributes were relationship quality (trust), knowledge required for providing help in getting maximum product benefits, sharing of knowledge, and a range of product and service offerings that satisfy customer needs. Trust had the greatest impact on customer satisfaction. The results also revealed that service quality dimension assurance exerted the greatest positive impact on customer satisfaction.
Introduction
Services in manufacturing have emerged as a response to slow down of sales growth, fall down of product margins, and typically higher service margins and return on invested capital (Bundschuh & Dezvane, 2003). The automotive paint market is specific in that it involves and requires skilled, knowledgeable, well-informed, and experienced professionals who deal with chemical products and apply them properly and promptly in such a way that damaged car has final finish of new car. The very nature of automotive paint job requires that paint manufacturers permanently inform, educate, train, and support customers. Significant interactions with customers are also needed and are essential for mutual success and growth.
Defining Technical Support (TS)
The importance of product support has long been recognized. Scholars have revealed that product support is essential for customers to obtain maximum value from products, increase sales revenue, and positively affect customer satisfaction (e.g., Lele, 1986; Lele & Karmarkar, 1983; Saccani, Songini, & Gaiardelli, 2006). However, the marketing literature on TS is ambiguous in that different terms such as product support, service support, customer service, customer support, product service, and after-sales service are used. TS has also been identified in the software and chemical industries and has somehow been separated from customer service. Using TS in these two industries is probably due to the fact that the software and (IT) products are sophisticated just like special paints from the chemical industry that are more scientifically product development–oriented (Cooper & Kleinschmidt, 1993) and require more technical assistance to customers than in other industries (Chemical Business, 2013).
In this study, TS has the meaning of such activities that take place in interactions between customers, employees, other individuals, and products with aim to assist and support customers’ everyday practices partly taken from the definition of service defined by Grönroos (2008). TS activities include complex interactions and relationships with customers and products through which the customers get maximum product benefits, optimize product usage and business risks related to product utilization. The TS activities can be viewed as informative, educational, and relational, and TS as such can be seen as an element of integrated product-service design in manufacturing. Although customer relationship marketing points out customer service as the link between firms and customers (Christopher, Payne, & Ballantyne, 1991), TS is neither separated from customer service nor strictly divided into pre-sale and after-sale activities. TS has economic, societal, and ecological potentials. It ensures higher profit margins to firms, better productivity to customers, lesser customer’s operating costs, and higher dissemination (including internationally) of latest development and information related to ecological product usage (Aurich, Fuchs, & Wagenknecht, 2006). Therefore, TS is critical for both successful global marketing and technology transfer “Automotive Coatings: Technologies and Global Markets,” 2014; (Kosenko & Samli, 1985). According to Automotive Paint Market (2015), automotive paint manufacturers are driven to provide the high-quality service to their customers through dedicated teams of professionals, implying that TS is likely to play more strategic roles in the future.
Service-Dominant (S-D) Logic and TS
Widely acknowledged by marketing academics, S-D logic proposed by Vargo and Lusch (2004, 2008b) and further reviewed by Lusch and Nambisan (2015) has shifted the marketing view from goods-dominant (G-D) logic emphasizing products and transactions to a more service-oriented view that considers all businesses to be service businesses, emphasizing interactions and relationships with customers. However, despite an increasing interest in S-D logic and a strong conceptual background of value-in-use in the marketing literature, there is little empirical evidence on how customers experience value-in-use and how value-in-use affects customer satisfaction in particular in the automotive paint market. A gap also exists in that most of the studies have been conducted in Western countries, whereas the paint industry encompasses manufacturers all over the world, in both developed and developing countries. Valuing value-in-use by customers from different walks of lives especially from developing countries might shed some more light on the value co-creation process from the S-D logic stance.
Recent evidence suggests that there are seven key attributes of value-in-use (Raja, Bourne, Goffin, Çakkol, & Martinez, 2013)—knowledge, accessibility, relational dynamics, a range of product and service offerings, delivery, price, and locality, and that these attributes have positive impact on customer satisfaction. The findings of the key value-in-use attributes can help manufacturers to improve their service strategies as they can better understand needs of their customers, increase customer satisfaction, maintain loyal and gain new customers, and increase revenue. The literature on value co-creation activities also suggests that active participation of customers in the value-creation process positively affects customer satisfaction (Vega-Vazquez, Revilla-Camacho, & Cossío-Silva, 2013). Considering the aforementioned TS activities, it is evident that TS may affect customer satisfaction through knowledge and expertise, accessibility, relationships, providing help in product choices, and being involved in broadening of product offerings through the initiation of new product development (NPD).
Aim and Objectives
The aim of this study is to investigate the relationship between TS and customer satisfaction. The concepts discussed above and the findings of Raja et al. (2013) provide a base for the following two research questions:
Therefore, this study aims to contribute to the studies on TS and impact of TS in manufacturing companies on customer satisfaction. The research findings can extend the underlying S-D logic view and the growing area on value-in-use. They may also lead to changes and improvements in service strategies and TS activities in the paint industry for achieving competitive advantages.
Review of the Literature
The Importance and Key Dimensions of TS
Traditionally, product support has been differentiated as pre-sale and after-sale support (e.g., Burger & Cann, 1995; Morris & Davis, 1992). A large volume of published studies has acknowledged that product support can be a source of revenue (Cohen, Agrawal, & Agrawal, 2006; Goffin & New, 2001), is essential for achieving customer satisfaction (Burger & Cann, 1995; Innis & La Londe, 1994; Raja et al., 2013; Saccani et al., 2006) and increasing customer loyalty and enhancing customer relationship (Ahn & Sohn, 2009; Pan & Nguyen, 2015), is essential for obtaining maximum value from products (Das, 2003; Lele & Karmarkar, 1983), and is a key for achieving competitive advantages (Goffin, 1998; Oliva & Kallenberg, 2003) and increasing success rate of new products in market (Cherubini, Iasevoli, & Michelini, 2015; Cooper & Kleinschmidt, 1993). However, Raithel, Sarstedt, Scharf, and Schwaiger (2012) addressed the value relevance of customer satisfaction and found that the dealer service quality is not an important factor that investors would look for but rather the perceived product quality.
Over the past years, manufacturers have been called for adoption of servitization, the process of shifting from the position of “pure manufacturer to that of service provider” (Redding, Tiwari, Roy, Phillips, & Shaw, 2014, p. 2) to offer bundles of combinations of products, services, support, and knowledge (Vandermerwe & Rada, 1988) instead of a single product or a service. Attention is also focused on new business models such as product service systems (PSSs; for example, Baines et al., 2007; Tukker, 2004). Service systems are value co-creators and networks of resources such as people, information, and technology connected with other systems by value propositions (Vargo, Maglio, & Akaka, 2008). PSSs provide integrated and customized offerings that fulfill customer needs, build unique relationships with customers enhancing customer’s loyalty, and provide better following of customer needs, thus enabling faster innovations (Tukker, 2004). Similarly, Baines et al. (2007) found that PSSs offer value-in-use. In product-oriented PSSs, customer support enhances functionality and durability of products and optimizes product application through training and consultation.
One study by Cooper and Kleinschmidt (1993) has revealed that NPD projects in the chemical industry utilizing TS and customer service are more successful and that firm’s technical competences perceived by the customer increase success of products in markets. As noted by Aurich et al. (2006), the potentials of TS services are economic, societal and ecological—economic potential lies in higher profit margins of TS being service, providing higher productivity to customers who use products as resources for their own processes, and reducing customer’s operating costs through training which assists in economical use of products; societal potential lies in building and securing knowledge intensive work and spreading it geographically considering that support is provided at product usage location; ecological potential relates to providing customers with more conscious product usage. Flint, Blocker, and Boutin (2011) also opined that as customer value perceptions are also in a state of constant flux, it is important for suppliers to anticipate the requirements of users and propose to do so as to ensure continued satisfaction and develop loyalty.
Knowledge
There is an unambiguous relationship between TS and knowledge as knowledge is integrated part of TS work. Das (2003) emphasized that TS is an “exemplar of knowledge work” (p. 416) and that heuristic nature of knowledge underlies problem formulation and problem solving. In the chemical industry, hence in the paint industry as well, where the science involvement is high and technical uncertainty is greater (Cooper & Kleinschmidt, 1993), solving problems requires that the TS personnel locate, adapt, and generate the problem (Das, 2003). In TS work, the main problems that customers face are during and after application of automotive paints and related products or during the research process in research and development (R&D). Of particular importance for TS is tacit knowledge. Tacit knowledge should be renewed, and the renewal is possible if there is trust between employees who share knowledge (Ballantyne & Varey, 2006). However, it is sharing of knowledge between TS personnel and customer that is critical because “knowledge sharing and application is a hidden source of competitive advantage” (Vargo & Lusch, 2004, cited in Ballantyne & Varey, 2006, p. 341). The knowledge as a key dimension of TS may be best understood from six perspectives suggested by Alavi and Leindler (2001, cited in Wang & Lu, 2010) as a kind of comprehended or personalized information regarding data and personal information, a status of understanding, stored and utilized personal or group-owned asset, a means of utilizing experience and expertise, a condition of access to information, and a capability to perform effective actions.
Understanding customer needs
According to Tyagi, Yang, Tyagi, and Verma (2012), the competitiveness of any manufacturing industry is much dependent on its capability to readily cater to the requirements of market niches through the production of a variety of high-utility and low-cost products targeted for them. When TS personnel support the customer, the customer’s support expectations and responsiveness help the TS personnel in defining customer needs and assessing customer’s expectations (Bowen, Siehl, & Schneider, 1989). Information that a TS team gathers from the automotive paint market is used as inputs or ideas for the NPD and for modifications of existing products in R&D to customize the products where needed and satisfy customer needs in many countries. Empirical studies by Cooper and Kleinschmidt (1993), Goffin (1998), and Goffin and New (2001) have revealed that manufacturers engaging customer support in early stages of the NPD process are able to increase the success rate of new products in markets.
Field visit is another area widely used for understating customer needs and supporting customer requirements. For an automotive paint manufacturer, field visits are integral part of TS service and work performed in the automotive paint market because field service improves customer satisfaction (Ahn & Sohn, 2009) and maintains customer loyalty (Hull & Cox, 1994). Field service is a communication link from the customer back to product design, manufacturing, and marketing (Hull & Cox, 1994), a source of new information for understanding customer needs and supporting customer’s actions. Knowing customer needs would be a base for tailored after-sale activities. Such tailored after-sale activities increase customer’s loyalty and strengthen customer relationship (Ahn & Sohn, 2009).
Relationships
Several studies draw our attention on the importance of relationship between manufacturers and customers (e.g., Bowen et al., 1989; Dorsch, Swanson, & Kelley, 1998; Flint et al., 2011; Mathieu, 2001). Trust has been identified as an essential element of relationship (e.g., Flint et al., 2011; Jap, 1999) and a key factor for successful and sustainable relationship (Huang & Wilkinson, 2014) together with ethics (Goffin, Lemke, & Szwejczewski, 2006). A study by Goffin et al. (2006) investigating close or partnership-like relationship has revealed trust as commitment. Dorsch et al. (1998) argued that trust and commitment together with satisfaction, opportunism, customer orientation, and ethics are dimensions of relationship quality.
More recent attention has focused on relationship quality (e.g., Macdonald, Wilson, Martinez, & Toossi, 2011; Rauyruen & Miller, 2007; Segoro, 2013). This shift from service quality toward relationship quality likely comes from the changes of the quality perspective in American Society of Quality (ASQ). The ASQ has shifted toward the definition of quality as “the ongoing process of building and sustaining relationships by assessing, anticipating and fulfilling stated and implied needs” (Judd, 1994, cited in Macdonald et al., 2011, p. 672). Therefore, relationship quality underpins building of sustainable relationship. Flint et al. (2011) used the term collaborative relationship with customers that enables firms to acquire skills and insights what their customers value, and also enables both firms and customers to achieve competitive advantages (Jap, 1999). Customized and close relationship support customer’s actions (Mathieu, 2001). In a study that set out to determine value creation in business relationships from S-D logic, Ulaga (2003) found that product support was one among key relationship value drivers along with product-related additional services including the right information at the right time, manufacturer’s availability/presence, quick response, and providing appropriate information.
Value Co-Creation and Value-in-Use From S-D Logic
One study by Woodruff (1997) suggested customer value as value-in-use, which is perceived preference to and evaluation of product attributes, its performances, and results of the use that facilitate or block achieving the customer’s goals and purposes. Similarly, recent S-D logic proposed by Vargo and Lusch (2004, 2008b) has introduced the concept of value-in-use calling firms for a new view of marketing. According to S-D logic, products and services assist customers in their own value-creation processes, where value is not something produced and sold, but something that is co-created with the customer and all other participants engaged in the co-creation process (Vargo & Lusch, 2008a). The authors assert that customers are resources and part of firm’s network and that firm’s resources are knowledge and skills, therefore emphasizing interactions as the central concept in value creation and value co-creation.
The stance that TS department is a service provider is supported by Vargo and Lusch’s (2008a) premises that service is a collaborative process of value creation among participants and that products need some actions to be valuable. Service provided directly or through a product represents the knowledge and skills of a service provider and is an essential source of value and competitive advantage. According to S-D logic, manufacturers can only propose offerings whereas the value becomes value-in-use evaluated by the customer in the consumption process and through use (Vargo & Lusch, 2004). Evaluation of value-in-use is an outcome of co-creation process and “experience and perception are essential to value evaluation” (Vargo et al., 2008, p. 148). According to the latter view, it might be that more experienced customers in the automotive paint market in developed counties would assess value-in-use in a different way than their counterparts in developing countries.
Prahalad and Ramaswamy (2004) hold the view that value is co-created through customers’ unique experience. Such experience is based on high-quality interactions between the customer and the firm. They have proposed the DART model (Dialog, Access, Risk-Benefits, and Transparency) of interactions for co-creation of value that is built: from dialog and access to as much information to the customer whereby access and transparency are critical for meaningful dialog; and from risk-benefits assessments of actions and decisions provided through dialog, transparency, and access.One question that needs to be asked, however, is whether and how the quality of information provided by the firm to the customer affects the customer’s experience and the quality of (existing) relationship. It might be that such information can lead to losing potential or current customer or having an impact on customer satisfaction. Norman (2001, cited in Payne, Storbacka, & Frow, 2008) points out that customers’ ability to create value depends on the amount of information, knowledge, and skills that customers can access and use. This view holds true; however, it is likely linked with prior customer’s knowledge and experience as well. Overall, both prior knowledge and experience together with those that the customer can access and use might affect customer’s creation of value and evaluation of value-in-use because, as pointed out by Gummesson (2008), customers create the value often on their own and sometimes in contact with suppliers.
However, S-D logic has not been without criticism by some researchers (e.g., Schembri, 2006; Stauss, 2005). Schembri (2006) argued that S-D logic is grounded in rationalistic assumptions proposing marketing as a process of interacting with customers instead of understanding that marketing starts with customers’ experience. A large and growing body of S-D logic literature has theoretically investigated value co-creation (e.g., Grönroos, 2008, 2012; Möller, 2006; Payne et al., 2008; Prahalad & Ramaswamy, 2004), and a few studies have examined the concept of value-in-use itself (e.g., Ballantyne & Varey, 2006; Macdonald et al., 2011; Raja et al., 2013). One criticism emerging from the S-D literature on value co-creation and value-in-use is that value co-creation and value-in-use have been largely examined as theoretical concepts; therefore, more empirical research is needed to understand how value-creating activities such as those of TS might affect value-in-use derived by customers.
The SERVPERF Instrument
Parasuraman, Zeithaml, and Berry (1988) have developed widely known SERVQUAL for measuring service quality perceived by customer. SERVQUAL is a multi-item scale instrument having 10 service quality attributes, that is, 10 dimensions. Parasuraman et al. have found that there is a high degree of correlation between some items (i.e., variables), which have been placed under corresponding dimensions. The final result has given the five dimensions whose detailed descriptions are adapted by Lovelock and Wirtz (2011): (1) Tangibles—appearance of physical facilities, equipment, communicating materials, and personnel; (2) Reliability—ability to perform promised service dependably and accurately; (3) Responsiveness—willingness to help customer and provide prompt service; (4) Assurance—the knowledge and courtesy of personnel and their ability to inspire trust and confidence. Assurance contains items including credibility (trustworthiness, believability, and honesty), security (freedom from risk, danger, or doubt), competence (possession of the skills and knowledge required to perform the service), and courtesy (politeness, respect, consideration, and friendliness); (5) Empathy—The provision of caring individualized attention to customers. Empathy includes items like access (approachability and ease of contact), communication (listening to customers and keeping them informed), and understanding the customer (making the efforts to know customers and their needs). (p. 385)
SERVQUAL involves customer’s perceived service quality by measuring the gaps of the five dimensions between the customer’s expectations of the service to be performed and the customer’s perceptions about the actual performance of the service. Several authors have used SERVQUAL in various service sectors with modifications of the scale items (i.e., the questions) according to the specific context (e.g., Banu & Gül, 2012; Freeman & Dart, 1993; Haque, 2013; Kettinger & Lee, 1994; Nadiri & Hussain, 2005).
However, despite the acknowledgment of the SERVQUAL instrument and all the benefits of the service quality theory, SERVQUAL has been subjected to both theoretical and operational criticisms (e.g., Buttle, 1996; Cronin & Taylor, 1992, 1994). Cronin and Taylor (1992) have criticized SERVQUAL arguing that customer satisfaction is an antecedent of service quality whereby service quality is strongly affected by existing service performances. Accordingly, they have developed an instrument that measures only service performances called SERVPERF based on the same five dimensions as SERVQUAL and with a reduced number of items from 44 to 22. Furthermore, because customers’ expectations may differ within different regions and populations based on, for example, customers’ experience and performance in accomplishing tasks, actions, or processes, SERVPERF may be more reliable as a measure of service quality.
Customer Satisfaction
Customer satisfaction is one of business performance metrics linked with service quality, product evaluation, repeat purchase, customer behavior, brand loyalty, and revenue (e.g., Bell, Auh, & Smalley, 2005; Finkelman & Goland, 1990; Griffin, Gleason, Preiss, & Shevenaugh, 1995; Vega-Vazquez et al., 2013). Woodruff (1997) suggested that customer value and product utilization have impact on customer satisfaction. He argues that product usage plays a critical role in customer’s evaluations and desires, and proposes customer value hierarchy model consisting of levels of customer satisfaction. Consistent with Woodruff’s (1997) model are findings by Macdonald et al. (2011) that customers can assess the usage process in terms of whether their goals, purposes, and objectives were supported or hindered therefore being satisfied or dissatisfied.
Individual communication improves customer satisfaction not only because of its immediate responses and faster solving of customer problems but also because direct communication of technically trained people assists in gathering the right information directly from customers who have them. Accordingly, this helps to minimize possible misinterpretations and wrong judgments about the importance of relevant aspects (Griffin et al., 1995). Yi and Gong (2013) argued that customer co-creation behavior consists of information seeking and information sharing with employees supplying them with information following employees’ guidelines and orientations; personal interactions with the employees based on courtesy, friendliness, and respect, which are fundamental for value co-creation; feedback leading to long-term improvement of the service provision; the recommendations to other individuals (families and friends); willingness to advice and give information to other customers; and tolerance when customers’ expectations were not met. Adopting S-D logic conceptual framework in the personal care sector, an empirical study by Vega-Vazquez et al. (2013) has revealed that customer involvement in the value co-creation process increases customer satisfaction with firm’s service.
Method
A quantitative research design was conceptualized based on the theoretical framework developed from the theories and concepts discussed in review of the literature. In quantitative research process, the researcher should “try to maintain objectivity and detachment from the research process” (Gray, 2014, p. 175). In this quantitative research, the main author took a posture of an observer with social constructionism as the epistemological paradigm, which means that the author’s personal experience from the paint industry and automotive paint market can assist in general understating of the TS work and its impact on customer satisfaction. Namely, social constructionism stems from the view that reality is “socially constructed and given meaning by people” (Esterby-Smith, Thorpe, & Jackson, 2012, p. 23). In social constructivism, the researcher is part of what is being observed and explanations are aimed to increase general understanding of a particular situation (Esterby-Smith et al., 2012). Because the TS team participates in value co-creating processes, and assists and affects customers’ own processes, the main author being in charge of managing the TS department was interested to investigate the impact of the TS activities perceived by customers on customer satisfaction through value-in-use from the S-D logic perspective.
Participants in this study were customers of an Egyptian paint manufacturer who were located in Egypt and India. The customers from Egypt and India were chosen because the paint manufacturer was located in Egypt with a subsidiary in India and due to similarities of the automotive paint market in both countries. The customers from Egypt and India were chosen by using non-probability convenience sampling method considering that the participants were customers of the Egyptian paint manufacturer who could easily be reached. The survey was conducted face-to-face during a 6-week period (July/August 2014), and the data were gathered using a paper-based survey questionnaire administered by hand as this method provided the fastest and most reliable way to reach the participants. The initial sample consisted of 169 customers. Of 169 participants, 11 had no variations in responses, and they were excluded from the analysis. The remaining 158 participants provided usable responses used for the analysis.
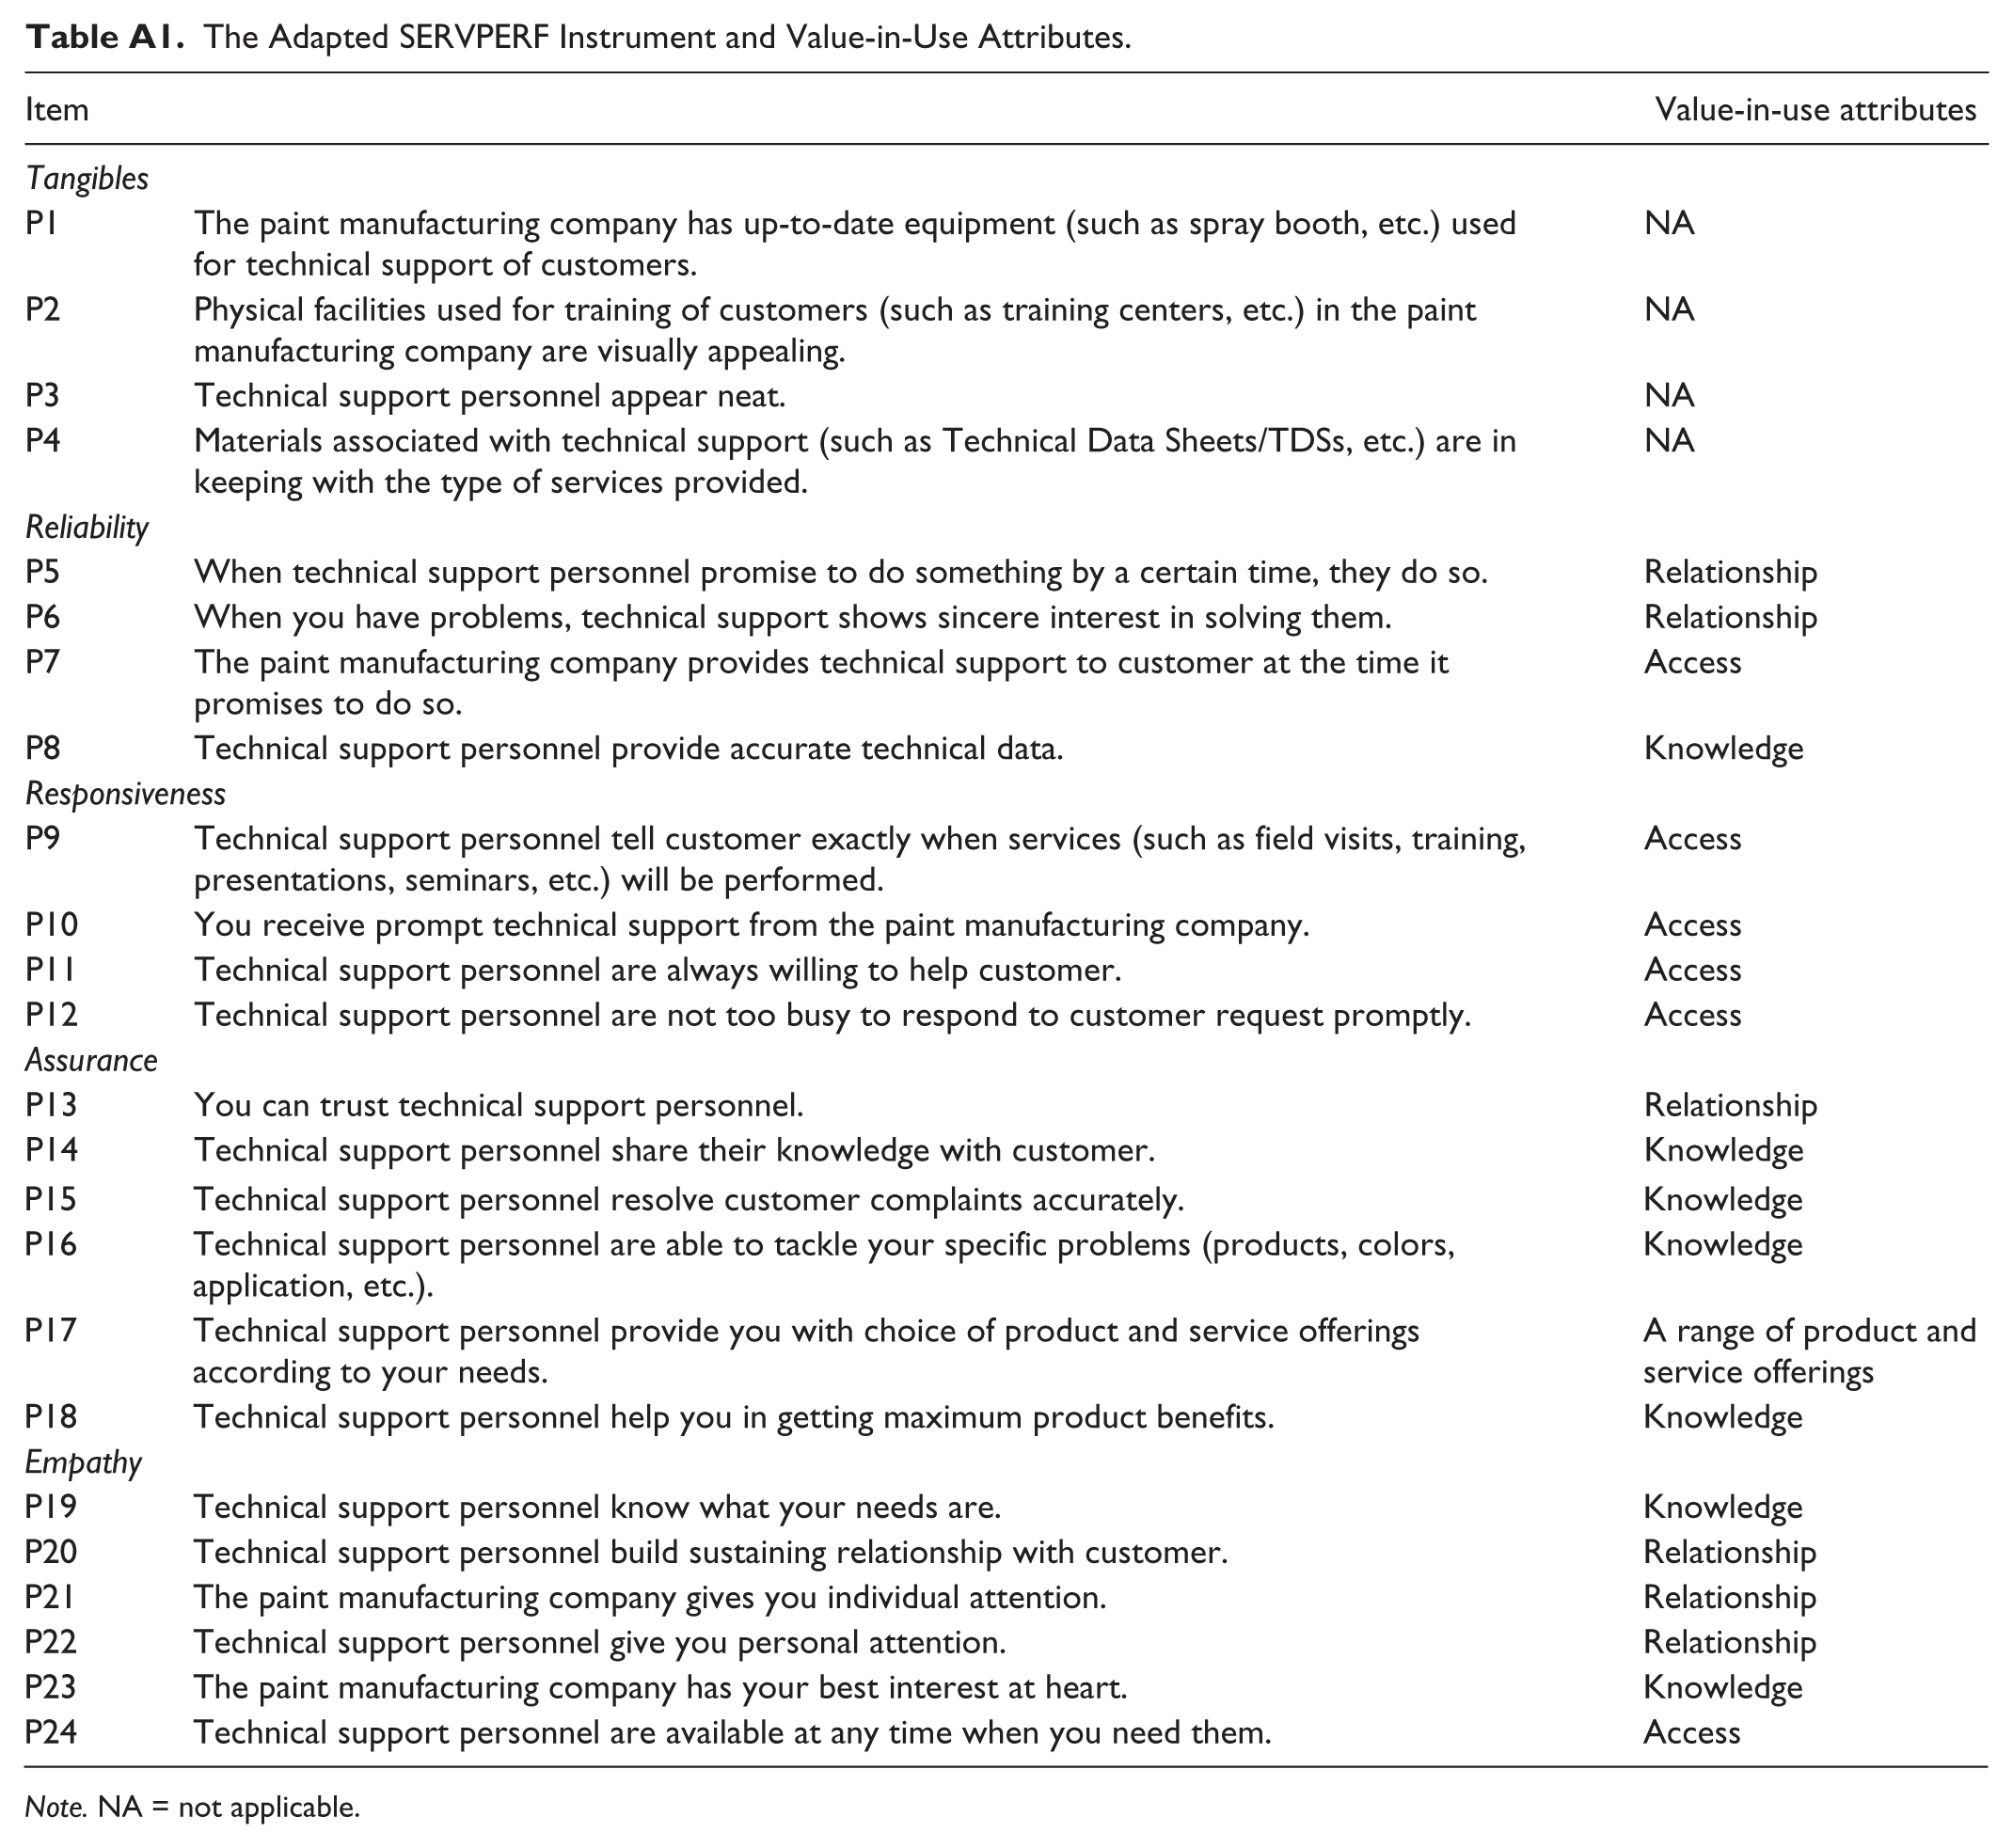
The questionnaire design bore on the performance-based SERVPERF instrument consisting of the same five dimensions as the SERVQUAL instrument. The original SERVPERF instrument was adapted to the TS activities. The total number of items was 25, 24 items for measuring TS service quality performance perception by customer and a separated item for measuring overall customer satisfaction (see Appendix A). The adapted SERVPERF instrument also contained embedded value-in-use attributes in order to identify them in the TS activities.The 25 items were measured on a 5-point Likert-type scale. The pilot test of the questionnaire in both Arabic and English language was conducted with five professional colleagues and five potential users of data to check whether the questionnaire gathered all needed information relevant to the TS activities and whether the questions were understood well. Based on the feedback from the respondents, a few changes were made and the final questionnaire (see Appendix B) administered to the respondents.
Results and Analysis
Results
Descriptive statistics
Demographic breakdown of the sample showed that from the 158 respondents, 139 were from Egypt and 19 were from India. Table 1 presents frequency distribution of kind of jobs of the participants. Of the 158 participants, 32.9% were retailers, 25.3% were painters, 22.8% were agents, 12.7% were technicians, 5.1% were “others” (i.e., body shop managers as stated by the participants), and 1.3% did not respond to the question about job specification.
Frequency Distribution of Kind of Jobs.

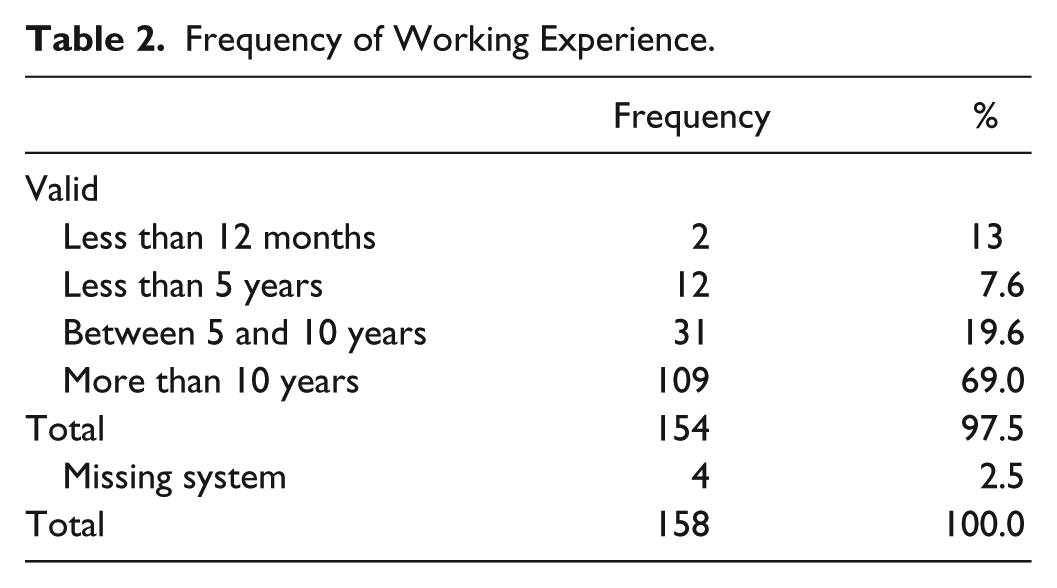
Table 2 shows frequency distribution of working experience in the automotive paint market. Of the 158 participants, 69% had more than 10 years of experience, 19.6% had between 5 and 10 years of experience, 1.3% had less than a year, 7.6% had less than 5 years of experience, and 2.5% did not respond to the question.
Frequency of Working Experience.
The results of the mean from Table 3 construe that the respondents from Egypt and India had relatively higher perceptions for reliability, assurance, and empathy, and relatively lower perceptions for tangibles and responsiveness. Considering that tangibles do not comprise value-in-use attributes, this service quality dimension was not taken into consideration in the analysis. Relatively higher mean values (M ≥ 4.02) show that the respondents had relatively higher perceptions for solving customers’ problems accurately and showing sincere interest in solving problems. The ability of TS personnel to tackle customers’ specific problems (such as color matching, product problems, application problems, etc.) and the trust placed in the TS personnel are also rated on the higher side. Finally, Table 3 shows that building sustainable relationship with customers assists in providing and maintaining satisfactory service quality.
TS Service Quality Perception (N = 158).

Note. TS = technical support.
As mentioned earlier, responsiveness plays important role in customer satisfaction and helps in improving it. The results of relatively low perception scores (M ≤ 3.29) for informing customer about the exact time for performing the TS activities such as field visits, training, and so on (P9), suggest that TS failed somewhat in ensuring responsiveness. There are several possible explanations for this result. It might be that the TS activities were not well-organized, the TS team could not provide the right information, or there was a lack of (adequate) employees earmarked for providing TS.
The assessment of sampling adequacy
The suitability of the respondent data was checked by generation of correlation matrix shown in Table 4. The pattern of relationships of the correlated items is used to investigate whether the items are correlated too low (R < .1) or too high (R > .9; Institute for Digital Research and Education–University of California, Los Angeles [IDRE-UCLA], 2014). From Table 4, it is noted that none of the items correlated above .9 or below .1 suggesting possibility to determine unique contribution of items onto a factor. However, it was also necessary to check whether the items did not correlate too low by using Kaiser–Meyer–Olkin (KMO) and the Bartlett’s test of sphericity. If KMO is higher than 0.50 and the Bartlett’s test of sphericity is significant (p < .001), then the data for exploratory factor analysis (EFA) are suitable (B. Williams, Brown, & Onsman, 2012). The results of KMO of 0.942 and significance p < .001 for the Bartlett’s test proved the suitability of the sample size and data set for EFA.
Correlation Matrix for the Initial SERVPERF.

Reliability
Reliability coefficient Cronbach’s alpha varies between 0 and 1, where values of .7 and above are considered acceptable (Gray, 2014). The results of reliability value of Cronbach’s alpha for the initial SERVPERF scale shown in Table 5 interpret that that Cronbach’s alpha was acceptable at .959. Cronbach’s alpha for each of the five dimensions was also acceptable being above .7. The results of reliability for the resulting SERVPERF scale presented also in Table 5 show that the overall Cronbach’s alpha for the resulting SERVPERF slightly decreased to .942 because the number of the items decreased from 24 to 17, while all resulting dimensions had increased Cronbach’s alpha values.
Cronbach’s Alpha for Each Dimension and the Initial and Resulting SERVPERF.

Construct validity
Table 6 shows that P3 item with the lowest correlation value of .546 from tangibles would have increased α = .875 if P3 was deleted, and P12 with the correlation value of .577 from responsiveness would have increased to α = .853 if the item was deleted whereby all other items showed higher correlations with their corresponding items and higher values of Cronbach’s alpha. Because the correlations ranged from .546 to .803 and were above Lai, Hutchinson, Li, and Bai’s (2007) recommendation of .20 for the inclusion of items, all items were included.
Item–Total Statistics for the Initial SERVPERF.

Value-in-use attributes
Principal axis factoring (PAF) with promax rotation was used for EFA as it produced the results that could easily be interpreted following Fabrigar, Wegener, MacCallum, and Strahan’s (1999) recommendation that the researcher can choose the procedure, a number of factors and methods for rotating to get more readily interpreted data. As suggested by Field (n.d.), the initial EFA included the eigenvalue greater than 1 which extracted three factors. To keep as much data and because the next two factors F4 and F5 had eigenvalues close to 1, that is, 0.882 for F4 and 0.734 for F5 as shown in Table 7, it was decided to choose five factors as the SERVPERF instrument had five dimensions. For easier reading and interpretation of factors, factor loadings with values lees than 0.4 were suppressed.
Eigenvalues for the Initial SERVPERF.

After 12 iterations, PAF produced the final results that could easily be interpreted, presented in Table 8. Following B. Williams et al.’s (2012) suggestion, items attributable to a factor were examined and the factor labeled by a proper name. Table 8 shows that the items loaded on F1 were P13, P14, P17, and P18 from assurance and P19, P20, and P22 from empathy, whereas P18 and P17 were the most attributable to F1 having the highest factor loadings at the values of 0.915 and 0.877, respectively. Therefore, Factor F1 was named assurance. F1 contained, along with the original item P13 “you can trust TS personnel,” new items added in this dimension implying the importance of assurance in TS service quality. This finding confirms the strong relationship between TS work, knowledge, and assurance, as mentioned earlier in the literature review. The Items P6 from reliability, P11 and P12 from responsiveness, and P24 from empathy loaded on Factor F2 whereby P24 was the most attributable to this factor having the highest factor loading of 1.01. Considering that empathy includes attributes such as accessibility included with P11 and P12, understanding customer and customer needs included with P6, F2 was named empathy. Factor F3 was named tangibles including Items P1 and P2 with high factor loadings of 0.981 and 0.859, respectively. Factor F4 was named reliability including P16 with higher factor loading of 0.726 and P15 with lower factor loading of 0.519, the items that had initially been in assurance. Nevertheless, both items may relate to reliability because this service quality dimension emphasizes ability to perform promised service dependably and accurately. Because Items P9 with factor loading of 0.877 and P10 with factor loading of 0.513 from the original responsiveness dimension loaded on F5, this factor kept the same name responsiveness.
Factor Loadings for the Resulting SERVPERF.

Table 9 shows the resulting SERVPERF scale containing 17 items in total with five service quality dimensions including assurance, empathy, tangibles, reliability, and responsiveness and embedded value-in-use attributes in them. Table 10 interprets that the value-in-use attributes embedded in corresponding items and four dimensions including assurance, empathy, reliability, and responsiveness were knowledge, relationship, providing a range of product and service offerings according to customer needs, and accessibility, and that TS service quality can be explained by five dimensions with 73.38% of the total variance.
The Resulting SERVPERF: The Service Quality Dimensions and Value-in-Use Attributes.

Note. NA = not applicable.
Total Variance of Factors for the Resulting SERVPERF.

The key value-in-use attributes and customer satisfaction
The key value-in-use attributes and their impact on customer satisfaction were determined by conducting multiple regression analysis (MRA). The R2 shows the “percentage of variance in the dependent variable explained by the independent variable(s)” and ranges from 0 to 1 (Gray, 2014, p. 591), that is, up to 100%. Table 11 shows that the regression coefficient R2 was .717, which means that 71.7% of customer satisfaction can be predicted by tangibles, reliability, responsiveness, assurance, and empathy. Adjusted R2 was .683 (68.3%) and did not differ significantly from the R2 value of 71.7% implying that there were not too many predictor variables used in the model.
Regression Coefficients for the Model With 17 Predictors.

Predictors: (Constant), P10, P16, P6, P1, P17, P12, P19, P14, P20, P13, P15, P22, P18, P11, P9, P24, P2.
The F test from ANOVA presented in Table 12 interprets that the model was statistically significant and there was statistically significant relationship between all 17 predictor variables and customer satisfaction as the p value was lower than .001 at the F value of 20.907. From Table 13, it is noted that the largest value of standardized coefficient beta (β) had relationship (β = .403 for P13) followed by providing help to customers in getting maximum product benefits (β = .215 for P18), providing a choice of product and service offerings according to customer needs (β = .202 for P17), and knowledge sharing (β = −.163 for P14). As can be seen from the t scores, trust (t = 5.200, Sig. = .000), providing help in getting maximum product benefits (t = 2.707, Sig. = .008), providing a choice of product and service offerings according to customer needs (t = 2.829, Sig. = .005), and knowledge sharing (t = −2.171, Sig. = .032) were all significant at a significance level p < .05. The positive β values for trust, providing help to customers in getting maximum product benefits, and providing a choice of product and service offerings according to customer needs had a positive relationship with customer satisfaction, whereas the negative β value for knowledge sharing had a negative relationship with customer satisfaction. A possible explanation for this might be that highly knowledgeable personnel providing TS might have been assuming that customers were aware of developments in the area when such might not have been the case.
ANOVA: F Test and Statistical Significance for the Model With 17 Predictors.
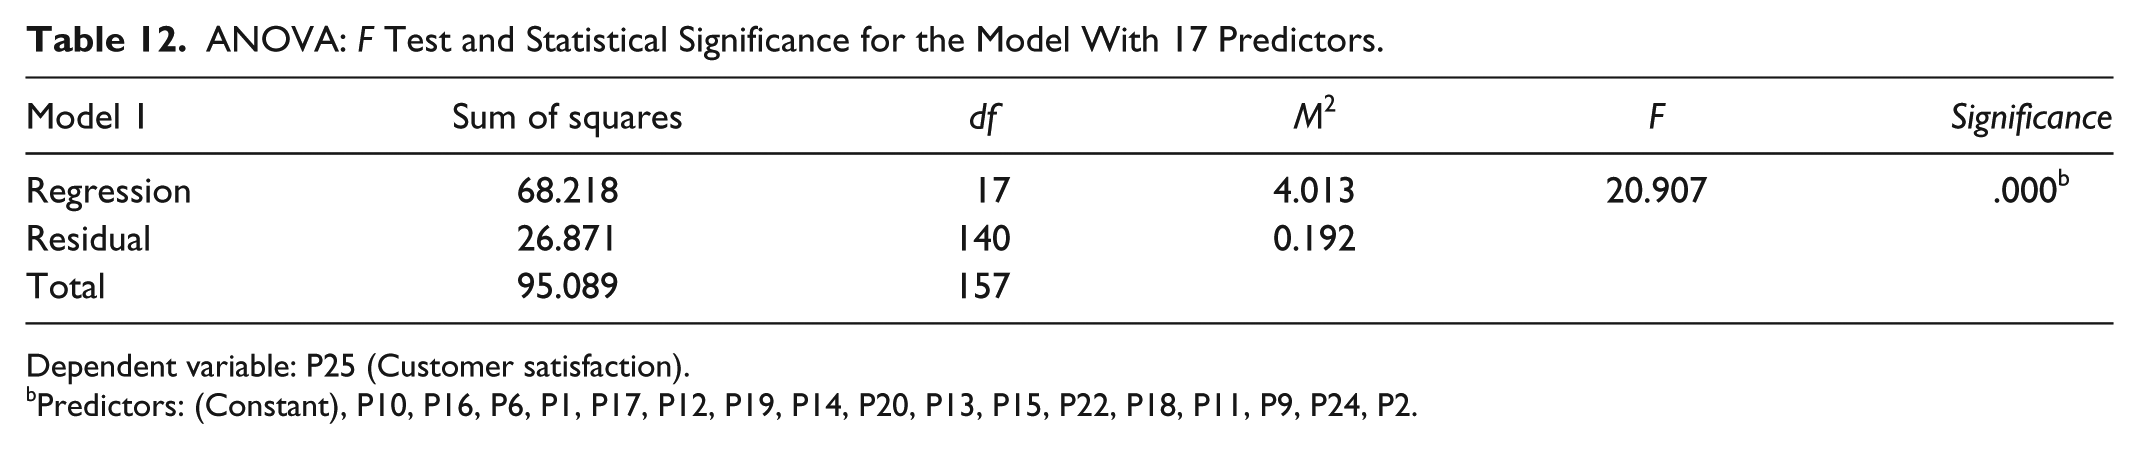
Dependent variable: P25 (Customer satisfaction).
Predictors: (Constant), P10, P16, P6, P1, P17, P12, P19, P14, P20, P13, P15, P22, P18, P11, P9, P24, P2.
Standardized Coefficients Beta (β), t Value, and Statistical Significance for the Model With 17 Predictors.

Note. NA = not applicable.
Dependent Variable: P25 (Customer Satisfaction).
Although P22 had the value of standardized coefficient β = .142 and was statistically nonsignificant (t = 1.793, Sig. = 0.075), this item should be taken into consideration as predictor of customer satisfaction as its significance p level was close to .05. That P22 may be important can be seen from the correlation matrix in Table 4 where P22, “technical support personnel give you personal attention,” was relatively highly correlated with P13, “you can trust TS personnel,” at the value of .717 and with P14, “technical support personnel share their knowledge with customer,” at the value of .737. The results for P22 from empathy should be interpreted with caution because personal attention in relationships may also be viewed as a value-in-use attribute for prediction of customer satisfaction. The overall results also show that assurance was the single most important dimension affecting TS-perceived service quality.
Analysis
The key value-in-use attributes
The first question in the study sought to determine the most important value-in-use attributes from perspective of customer who uses automotive paints and related products. Obtained service quality dimensions assurance, empathy, reliability, and responsiveness determined value-in-use attributes built in each corresponding item from these dimensions. The results show that the key attributes of value-in-use were trust, providing help to customers in getting maximum product benefits, providing a choice of product and service offerings according to customer needs, and knowledge sharing. These results corroborate the findings of a great deal of Raja et al.’s (2013) findings, which showed that the key attributes of value-in-use were relational dynamics, access, knowledge, and providing a range of product and service offerings. In contrasts to their findings, access was not detected as a key attribute. Previous study has also stressed the importance of fast responses and instant attention. However, the result suggests that access to information on time or when the information was needed was not of significance to customers. A possible explanation for this result may be that relationship quality and knowledge are considered more important in customer usage processes than accessibility by customers who are well experienced. The results of demographic breakdown show that most of the respondents were retailers and end users/painters with more than 10 years of experience in the automotive paint market being able to solve common product problems satisfactory. Another possible explanation may dwell in customer participation behavior in value co-creation who can express tolerance when service provision does not meet their expectations (Yi & Gong, 2013).
The study found that trust was the most important value-in-use attribute. It is the quality of the relationship that is important for creation and application of knowledge. Previous study contributing to S-D logic has found that product support was one among the key relationship value-creation drivers (Ulaga, 2003). Some authors have noted that value is co-created through customers’ unique experience of interactions in which risk-benefits assessments can be obtained through communication, shared learning, shared problem solving, and transparency of and access to information. It can thus be suggested that TS through product support and its key dimensions assists in customers’ everyday practice, particularly when such assistance is ensured by experienced personnel providing TS.
The study also found that helping customers in getting maximum product benefits and providing a choice of product and service offerings according to customer needs are key value-in-use attributes. These findings together show the importance of engagement of TS in NPD, field visits, and training to customers. Without field visits, engagement in NPD, and training, it would not have been possible to help customers in getting maximum product benefits and offer products and services that satisfy customer needs. In reinforcement to this, P. Williams and Nauman (2011) observed that there are strong links between customer satisfaction and retention with respect to revenue and earnings per share, and hence, better financial performance is more likely to occur.
Previous studies on S-D logic have emphasized knowledge sharing as a source of competitive advantages and noted interconnectedness between relationship and knowledge. Of particular note in the study is the importance of knowledge sharing that led customers to determine it as value-in-use attribute. This finding further supports the idea of Yi and Gong (2013) that customer participation behavior in value co-creation is to seek information and share them with employees following their guidance and orientations. This finding also confirms relationship between knowledge sharing and trust in value co-creation activities. It is encouraging to compare this result with that found by Cai, Goh, de Souza, and Li (2013) that trust was a key determinant of knowledge sharing in collaborative supply–chain relationship. This result may be explained by the fact that TS transfers knowledge to customers but also acquires new knowledge from them. Sharing of knowledge between customers and the TS personnel correlates with sharing of knowledge between the TS team members. The finding also suggests correlation with other three key attributes—trust, help in providing maximum value from a product, and providing products and services that satisfy customer needs. Taken together, these findings support Prahalad and Ramaswamy’s (2004) DART model of interactions in the value co-creation process where shared learning, communication and shared problem solving with customers, and transparency of and access to information together assist customers to perceive possible business risks and accordingly make decisions and take actions.
The key value-in-use attributes and customer satisfaction
The second question sought to determine whether the customer was satisfied or dissatisfied with the key value-in-use attributes. The results show that trust was the strongest predictor of customer satisfaction having the greatest positive impact. The importance of interactions between TS personnel and customers that led to trust to be valued as value-in-use attribute corroborated the idea of Huang and Wilkinson (2014) who suggested that trust was not fostering trusting environment in relationships, but it was fostering trusting actions that reflected decisions “to rely on trust to deal with perceived risks” (p. 272) and the way trusted actions were used. Accordingly, the result suggests that the customer is satisfied when trusted actions were previously experienced and proved to be true in assisting or improving of the customer’s processes or operations.
Next strong predictors with positive relationship with customer satisfaction were providing help to customers in getting maximum product benefits and providing a choice of product and service offerings according to the customer needs. As mentioned earlier, a customer is satisfied or dissatisfied depending on whether goals, objectives, and purposes of the usage process were met. It can therefore be assumed that relationship, knowledge, and a range of products and services offerings that satisfy customer needs are the most significant attributes of the usage process for a prediction of customer satisfaction. The results also show that knowledge sharing was the least significant predictor with negative relationship with customer satisfaction. This result suggests that without improvements in quality of the relationship, providing help in getting maximum product benefits, and better understanding customer needs (probably due to ever-increased customer needs), a customer would be dissatisfied if there is only a bundle of new information, which is not properly used and/or does not meet customer goals. Previous studies have noted that value co-creating activities are relating, communicating, and knowing, and that effective knowledge sharing in collaborations between suppliers requires understanding, valuing, and absorbing the partner’s knowledge. Therefore, sharing of knowledge requires evidence that information and learning received by customers were supportive in meeting customer needs and goals leading to satisfied customers.
Conclusions and Recommendations
Summary of conclusions
The conclusion about the first research question is that the key attributes of value-in-use in the automotive paint market are trust, providing help to customers in getting maximum product benefits, providing a choice of product and service offerings according to customer needs, and knowledge sharing. Trust, as an essential element of relationship, is the most important key value-in-use attribute in the automotive paint market; therefore, TS affects customer satisfaction through relationship quality. TS as an after-sales strategy builds relationships with customers and assists in product support and customers’ own processes reflecting trust as the most important attribute. It comes as no surprise considering that TS personnel train customers and spend most of their working (and non-working) time on-site and in personal interactions supporting customer’s activities and business performances. Customers value those product and service attributes in use affected by TS, which are perceived to generate and fulfill desired outcomes of customer’s own processes. However, customers did not perceive of higher importance time availability of TS personnel and prompt TS service. Although the availability is perhaps because such activities require that customers organize themselves thus affecting their everyday’s activities, the latter can be explained by the customers’ tolerance and experience as most of the respondents had more than 10 years of experience and were able to solve product problems without affecting their own processes.
Regarding the second research question, the factors such as trust, knowledge that ensures help to customers in getting maximum product benefits, providing a choice of product and service offerings according to customer needs, and sharing of knowledge with them are good predictors of customers’ satisfaction. Among these attributes, trust has the greatest impact on customer satisfaction. Therefore, the conclusion emerging from this study is that TS is perceived by customers as TS personnel possessing capabilities to assess well customer usage processes, understanding customer needs, objectives, and goals, and improving customers’ performances.
Another conclusion emerging from the study is that assurance has the strongest impact on customer satisfaction because it comprises the key TS dimensions. TS should maintain training to customers and field visits as they are sources of sustainable relationship, knowledge, and understanding customer needs. Both field visits and training ensure active participation of customers on what is important for value co-creation enhancing relationships. They also build customer trust assisting in understanding customer needs because in such interactions, TS personnel can comprehend customer expectations and responses to product and service offerings. Therefore, TS should focus not only on hard skills but on soft skills as well.
Benefits of the Study
The findings from this study make several noteworthy contributions to the existing literature. The current empirical findings add to a growing body of literature on S-D logic and value-in-use, which have strong conceptual background, yet still little empirical evidence. The study provides additional evidence of the importance of relationship quality and the recent shift from service quality to quality of relationships with customers. The present study also enhances our knowledge on TS in manufacturing. It contributes to our knowledge on TS in the paint industry and automotive paint market. In addition, the study contributes to existing knowledge on customer satisfaction by providing empirical evidence on the impact of TS on customer satisfaction.
Implications of the Study
This study has several implications for the automotive paint industry in general and the provision of TS in particular. First, the industry is an evolving one with new products developing at an increasing pace. Second, assumptions regarding customers of automotive paints are fully aware of developments, and new products might be wrong, and hence, it requires a dynamic team to visit customers as often as required to share with them knowledge and expertise to accommodate new techniques. Last, relationship building and trust arising from such relationship are key drivers for ensuring competitive advantage and growth.
Limitations of the study
The findings in this study are subjected to a number of limitations. First limitation is that small sample size and the use of the non-probability convenience sampling method limited the research results to generalizability. Second, the SERVPERF instrument was adapted to the research context and may not be applicable in other industries. Third, the value-in-use attributes were included in the SERVPERF instrument based on the main author’s assumption from the literature review that the four key value-in-use attributes may be included in each corresponding item from the questionnaire. The fourth limitation is that most of customers were from Egypt and far less from India producing results more related to the customers from Egypt than from India. Last, customers’ prior knowledge and experience were not taken into consideration although they might likely be positively associated with how customers performed and determined value-in-use and customer satisfaction as well.
Recommendations for Further Research
The findings of this study may be tested in other industries to explore impact of TS on customer satisfaction through attributes found in a specific industry. The use of the SERVPERF instrument with embedded value-in-use attributes can also be investigated in a further research. A further study might use in-depth interviews to investigate the identified attributes and their relationship. Another possible area of further research may be longitudinal research to understand how value-in-use attributes may change over time with changes of customers’ goals and with TS service quality as well. Finally, with respect to the finding “knowledge sharing” is significantly negatively related to customer satisfaction, it might be useful to look into this further by conducting research in other sectors to shed light on the same. The assumption that some respondents did not like to share their knowledge, expertise, and experience or be told what to do might not hold true.
Footnotes
Appendix A
The Adapted SERVPERF Instrument and Value-in-Use Attributes.
| Item | Value-in-use attributes | |
|---|---|---|
| Tangibles | ||
| P1 | The paint manufacturing company has up-to-date equipment (such as spray booth, etc.) used for technical support of customers. | NA |
| P2 | Physical facilities used for training of customers (such as training centers, etc.) in the paint manufacturing company are visually appealing. | NA |
| P3 | Technical support personnel appear neat. | NA |
| P4 | Materials associated with technical support (such as Technical Data Sheets/TDSs, etc.) are in keeping with the type of services provided. | NA |
| Reliability | ||
| P5 | When technical support personnel promise to do something by a certain time, they do so. | Relationship |
| P6 | When you have problems, technical support shows sincere interest in solving them. | Relationship |
| P7 | The paint manufacturing company provides technical support to customer at the time it promises to do so. | Access |
| P8 | Technical support personnel provide accurate technical data. | Knowledge |
| Responsiveness | ||
| P9 | Technical support personnel tell customer exactly when services (such as field visits, training, presentations, seminars, etc.) will be performed. | Access |
| P10 | You receive prompt technical support from the paint manufacturing company. | Access |
| P11 | Technical support personnel are always willing to help customer. | Access |
| P12 | Technical support personnel are not too busy to respond to customer request promptly. | Access |
| Assurance | ||
| P13 | You can trust technical support personnel. | Relationship |
| P14 | Technical support personnel share their knowledge with customer. | Knowledge |
| P15 | Technical support personnel resolve customer complaints accurately. | Knowledge |
| P16 | Technical support personnel are able to tackle your specific problems (products, colors, application, etc.). | Knowledge |
| P17 | Technical support personnel provide you with choice of product and service offerings according to your needs. | A range of product and service offerings |
| P18 | Technical support personnel help you in getting maximum product benefits. | Knowledge |
| Empathy | ||
| P19 | Technical support personnel know what your needs are. | Knowledge |
| P20 | Technical support personnel build sustaining relationship with customer. | Relationship |
| P21 | The paint manufacturing company gives you individual attention. | Relationship |
| P22 | Technical support personnel give you personal attention. | Relationship |
| P23 | The paint manufacturing company has your best interest at heart. | Knowledge |
| P24 | Technical support personnel are available at any time when you need them. | Access |
Note. NA = not applicable.
Appendix B
Authors’ Note
The study was carried out as part of Master in Business Administration of the lead author at the University of Liverpool/Laureate.
Declaration of Conflicting Interests
The author(s) declared no potential conflicts of interest with respect to the research, authorship, and/or publication of this article.
Funding
The author(s) received no financial support for the research, authorship, and/or publication of this article.