
Abstract
This paper studies the service quality (SQ) of higher education institutes (HEI), offering professional courses from the perspective of faculty as they are the service providers as well as a major stakeholder in the educational arena. PHEISQUAL (Professional higher education institute service quality) scale has been developed to measure the service quality of HEI offering professional course using mixed methodology. Four factors namely—Training & Placement, Faculty Resource, Learning Infrastructure, and Assessment & Evaluation have been extracted. The scale has been subjected to rigorous analysis of scale development process and has complied with same. Thus this study accrues a new instrument to measure service quality of professional institutes offering higher education by taking into account the technical as well as operational factors.
Introduction
21st century business is driven by quality matrix. This may be accrued, to the nexus between quality and sustainability in the tough waters of competitive pressures faced by business (Nguyen et al., 2018). Whether it is the business of manufacturing goods or trading commodities or serving the customers, it is the quality that gets supremacy over all other business metrics. Wirtz and Lovelock (2021) says service quality is important for all organizations as it relates to their success or failure; it should be judged validly and reliably to bring improvement (Abbas, 2020a). While quality is perceptible differentiator in goods, the same cannot be said for services. In services, quality is a slippery concept to understand and use as differentiator toward sustainability. Services are intangible, heterogeneous, inseparable that lends to the complexity. Entrepreneurs who have their stake in service industries are always rummaging for getting hold of this concept. They are on the lookout for ways and methods to identify and measure quality of services for sustainability. Abad-Segura and González-Zamar (2021) in their paper on sustainable economic model in education, assert that the future lines of research are in establishing indicators that allow managers of academic institutions a protocol to assess the economic dimension of sustainability.
Education after having long lived the life of charitable monk has finally shed the cast to ensemble as profit driven business entity (Mok & Jiang, 2018). To survive in this new attire it needs to deck itself with quality attributes for prolonged survival. To compete in this quality driven paradigm, educationalists need to identify and work on the quality measures in the educational landscape (Campos et al., 2017). Education industry is broad spectrum covering various types and formats as it is a lifelong process. It may refer to the dichotomy of vocational and professional education. Education may allude to domain specific taxonomy like—engineering, medical, pharmacy, management. The international standard Classification of Education (ISCE) has identified the following fields of education: Education; Humanities; Law and social sciences; Natural, technical, and agricultural sciences; and medical sciences. Professional education can be defined in different ways in different countries based on goal, levels, institutions etc. In the words of Sarkisov (2019), professional education would be the education of different levels by means of which people qualify for a certain profession or specialty. Professional education is a formal specialized training about a particular profession in which learners are taught the central concepts, principles, and techniques, and how these are applied in real practice, and the learners also acquire the necessary competencies needed for proper practice and behavior (Gondwe, 2020). Professional education is a formalized approach to specialized training in a professional school through which participants acquire content knowledge and learn to apply techniques (Professional Education, n.d., p. xx).
In countries where education has to satisfy the educational demands of individuals, there is a large proportion of graduates in the humanities, law, and the social sciences. In countries where the educational system is part of the system of material production there is a greater proportion of graduates in natural and technical sciences. With economy standing at the cross roads of service and manufacturing businesses, there is going to be an ever increasing requirement of proficient technical and science graduates with professional qualifications. This poses challenge as well as opportunity for the institutions offering professional education to feed the industry with right graduate attributes and inch itself toward sustainability (Brachem & Braun, 2018). Increase in quantity poses a threat to quality (Ali et al., 2016). Substantial increase in the establishment of Higher Educational Institutes (HEIs) has resulted in the issue of quality in HEIs (Abbas, 2020c). It is time institutes offering professional courses have a relook on quality aspects in education to be competitive as well as sustainable (Segura & Zamar, 2021). Professional education deals with need based knowledge and skill requirement in society, hence the onus of nurturing the right skills lies on the shoulders of professional courses.
Higher professional education is a major contributor in the growth of nation as it trains a regular pool of human skills and transform them into valuable resources (Premand et al., 2016). Quality of education is of utmost importance, as the higher education institutes groom the potential managers/technocrats/medical professionals, who will be the ambassador of growth and civilization in a nation.
This paper offers insights into the quality dimensions relevant to higher professional educational institutes. The research captures the quality dimensions from academician’s perspective (faculty perception). as they are indispensable stake holders in the service landscape of education industry and they are the main vehicle to deliver education.
Literature Review
Literature is replete with research articles on quality touching on various aspects of it. Yet there is no single definition of service quality that one comes across while exploring this domain (Seth et al., 2005). Service quality is often referred to as—technical output of service (Grönroos, 1984); operational performance of service (Cronin & Taylor, 1992; Parasuraman et al., 1985); it is the experience one has on consuming the service; it is situational or contextual or industry specific (Seth et al., 2005). Given to so many definitions of service quality, there is no single best fit solution to measure service quality. Seth et al. (2005) talks of 19 different service quality models to define and measure the service quality . While every model contributes uniquely in measuring one or the other aspect of service quality, yet the most popular model that has been suggested or used by researcher is the Parsuraman’s gap model (expectation—performance gap) (Parasuraman et al., 1985). A variant to this, is the parsimonious Servperf (Cronin & Taylor, 1992, 1994) scale, as it captures only the perception of service quality. However limitation of Servqual and Servperf scales are that they are generic thus cannot be applied to all service types; they do not capture all the aspects of service quality (Abbas, 2020c) but only the operational aspects. While majority of researchers have used these scales with modification/adaptations to suit the service setting, there are researchers who have developed industry specific scales for various industries like-education, agriculture, tourism, logistics etc. (Balaji & Ganesan, 2005; Chowdhary & Prakash, 2007; Davila et al., 2010; Eboli & Mazzulla, 2007; Hajdari, 2019; Newman, 2001; Nwabueze & Mileski, 2008; Rahman, 2005; Rhee & Rha, 2009; Selen & Schepers, 2001; Shamdasani et al., 2008; Yu & Fang, 2009; Zhou et al., 2009).
Education is a service industry with a very high customer interface (Amorim et al., 2014). It involves the active involvement of customer (students) as well as service provider (faculty) for effective delivery. Researchers have shown interest in measuring service quality of education across various landscapes and settings (Abdullah, 2006a, 2006b; Brochado, 2009; Trivellas & Dargenidou, 2009; Truong et al., 2016). The key issues involved in evaluating service quality are the identification of quality indicators and designing a suitable measuring instrument (Abbas, 2020c; Silva et al., 2017). By and large the majority of research that exists on education deliberates on measuring service quality using Servqual/Servperf scales (Cronin & Taylor, 1992; Parasuraman et al., 1985). However the problems with these scales are that they are too generic and have to be modified by identifying the relevant indicators in an educational setup (Abbas, 2020c; Abdullah, 2006c). These instruments measure the operational/functional service quality but, they do not measure the technical or the output service quality (Abbas, 2020c; Kang, 2006). Hedperf (Abdullah, 2006a), Hesqual (Teeroovengadum et al., 2016) are the scales that address the above shortcoming. Abbas (2020c) claims that Hedperf (Abdullah, 2006a) and Heqsual (Teeroovengadum et al., 2019) are better than Servqual and Serfperf as they focus on education, yet they do not address the technical aspects of service quality of education. Since service quality is a multifunctional phenomenon, a holistic scale is yet needed to gets a comprehensive measure of service quality in education (Abbas, 2020c; Ali et al., 2016).
Abbas (2020c) has recently developed a holistic scale to measure technical and operational service quality of education. The sample responses for the scale developed, were drawn from the students of bachelors, masters and PhD courses. The scale captures service quality of HEIs across various courses but does not particularly talk about professional education. Professional education is a formal specialized training about a particular profession in which learners are taught the central concepts, principles, and techniques, and how these are applied in real practice, the learners also acquire the necessary competencies needed for proper practice and behavior (Gondwe, 2020). Since professional education develops competency to meet society needs, any lacunae in quality of professional institute may correlate with the progress of the community/nation. This solicits the need for a holistic look into service quality of HEIs with focus narrowed down to professional courses.
Student as a Customer in HEIs Quality Surveys
The plethora of instruments developed for education service quality focuses on capturing the student’s perception. The perception of other stake holders in this trade has been seriously overlooked. HEIs have witnessed continued debate on who the customers are (Guilbault, 2018), though there is no universal agreement (Mark, 2013).
Plethora of studies have been conducted on service quality of education capturing the perspectives of students, but taking students as sample has widely been criticized by researchers. Some opine that considering students as customer would lead to erosion of academic rigor (Albanese, 1999; Bay & Daniel, 2001; Bunce et al., 2016; Franz, 1998; Guilbault, 2018; Liu, 2016; Tholen et al., 2016) as they must be given what they want. Sears (1986) argued against taking sophomores as subject of study, stating that compared to adults they have less crystallized attitudes, less formulated sense of self, unstable peer group relationship and stronger tendency to comply with authority. Others on similar line posit that undergraduate students view of course/ program will vary over time (Oldfield & Baron, 2000); students expectations lack validity as they have little or no prior knowledge and experience with tertiary education (Joseph & Joseph, 1997). Guilbault (2018) have aptly criticized taking student as customer as they have short term perspective; absence of accountability; student as a judge might influence course grading (Hassel & Lourey, 2005), water down course content (Birnbaum, 2022), though Mark (2013) asserts that these arguments are not supported empirically. Further studies have also shown that use of students as a direct surrogate of customers could be misleading for specific research (Chihyung et al., 2007), thus students perception of quality cannot be projected on other stakeholder.
Many studies have been carried out in the past to assess student’s perspective on HEIs’ service quality but there are hardly any studies that capture the quality perspective of other stakeholder’s. Abbas (2020c) suggest the need for studying the perspective of other stakeholders in higher education. The present study seeks to bridge this gap by studying faculty perspective of service quality. Faculty members who are deliverer of the service can also be taken as first line of customers with more crystallized attitude which is less likely to vary with time
Faculty of any higher educational institute is the intellectual resource that mentors the students (Ramirez et al., 2013). They have a good understanding as to what will foster learning and what will inhibit. Their perception about what makes quality in an educational setup can prove very useful in enhancing the institute’s quality. It is surprising that only a few studies could be found that have explored the faculty perspective on service quality of higher education (Lakal et al., 2018) Faculty resources are the internal customer (Hinson, 2019) of the institute and are the closest to students, they interact most with the students so their view could be taken up to get an understanding of service quality aspect. Since there is a dearth of literature available on service quality in HEI’s from faculty perspective, the authors have attempted to identify what constitute service quality according to faculty members and how can it be operationalized. This paper caters to two objectives primarily:
Identify factors that measures service quality from faculty perspective
Develop a scale to measure service quality in institutes offering professional education from faculty perspective
Research Methodology
Since the purpose of this study was to develop and validate an instrument for measuring the service quality in higher education institutes, mixed methodology, as suggested by researchers (McKim, 2017) has been adopted. Qualitative techniques like—literature review, focus group, expert opinion have been used in the design part of the scale for identifying the main constructs and operationalizing them. Subsequently data is collected and put to quantitative analysis as suggested by Morgado et al. (2017). The broad steps followed by researches to develop this instrument are—Item generation, theoretical analysis and psychometric analysis.
Item Generation
There are two methods for item/construct generation—deductive (literature review, existing scales) and inductive (focus group, interviews, expert panels). Authors have identified the constructs through literature review and then invited the opinion of target groups for additions and deletions in the constructs. Once the constructs are finalized, the items have been drafted by the authors and subsequently put to expert panel for refinement.
Literature review to identify the service quality constructs had been performed in three steps. In the first step the journals were identified, in the second step the articles were identified from the shortlisted journal, in the third step the articles were further funneled down to be included in research. The databases used for literature review were SCOPUS, Directory of open access journal (DOAJ), Journal storage (JSTOR). The journals were identified using keyword search phrases like—Quality, Service Quality, Total Quality Management, Quality Assurance, Education, Education Management, Quality in education. Another keyword search with phrases like—service quality in education, quality in education, education quality and students was performed to identify the articles in the short listed journals that were published after 2005. The articles that included words like—Dimensions, Factors, Constructs, Determinants, Attributes, Quality perceptions in their abstract were considered for research.
Literature review delineated academics, faculty, infrastructure, governance and placement as the common constructs for quality in education (Table 1). Subsequently, the authors have put these five constructs to the target group to invite their opinion and suggestions as Morgado et al. (2017) argues that while developing future scales, researchers should be concerned, not only with opinions from experts but also with the opinions of the target population as it forms the basis for content validity (W. Bastos & Levy, 2012). Clark and Watson (1995) and Malhotra (2004) suggest that it is essential for the new scale to undergo prior review by members of the target population. Since the scale was intended to capture the faculty perspective of service quality, the target population were the faculty members of HEI’s that offer professional education.
Constructs Identified From Literature Review.
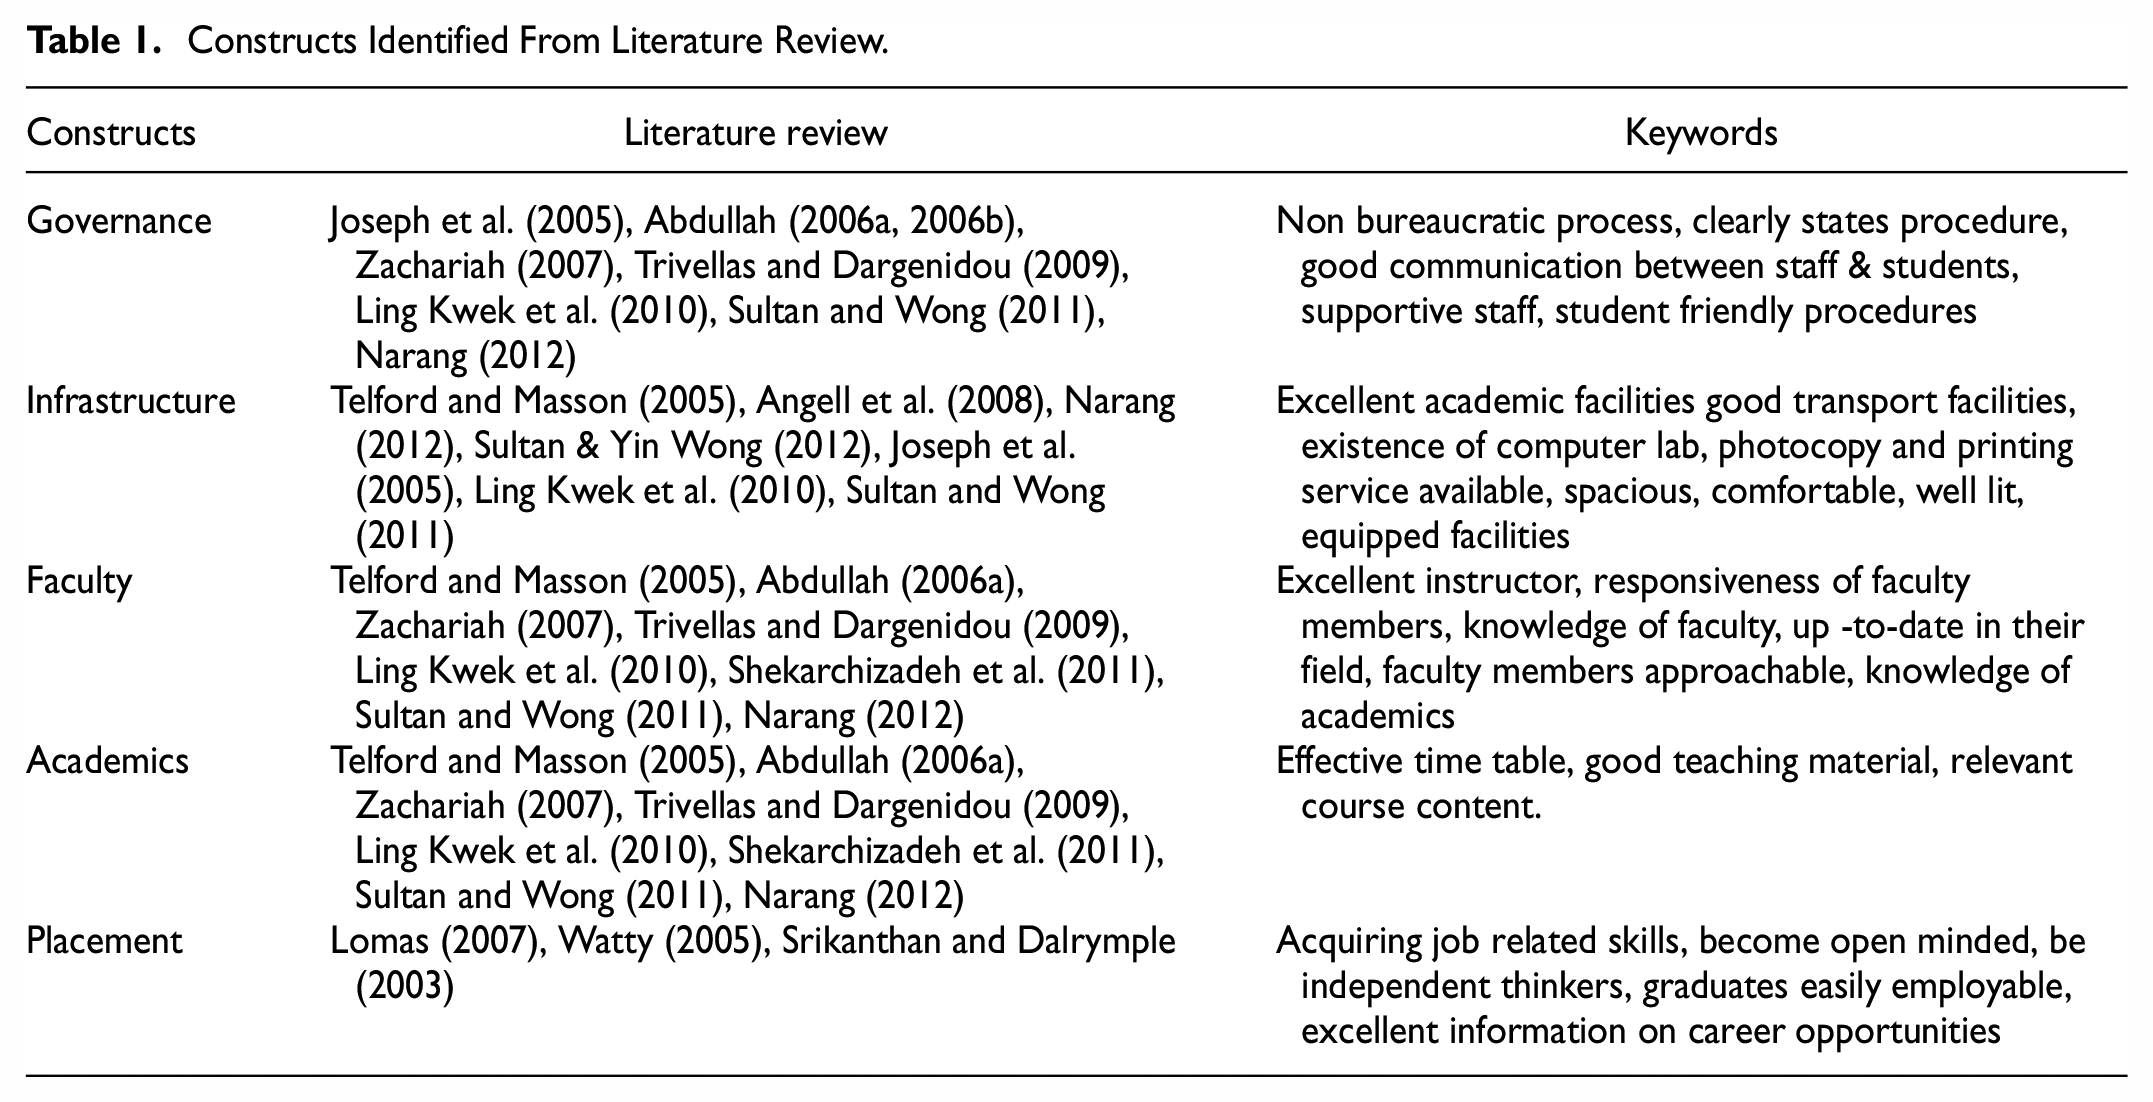
The researchers took qualitative input from the target group, through an unstructured focus group approach. Following Krueger’s (1998) suggestion of 5 to 10 participants in each group; there were three focus group interviews conducted with faculty members from various streams (medical & pharmaceutical, engineering, management). Faculty were selected in the group based on their experience. Faculty with experience of 5 to 17 years (mean 7.5 years) was chosen in each group. The constitution of three focus groups were as follows—eight members in engineering group, nine members in medical group, seven members in management group. All the three focus group were conducted by the same author, the pooled data of the focus group was presented to the second author for analysis and subsequent categorization of constructs. The focus group interviews were conducted in the meeting room of respective institutes in face to face format. Before starting the session the author explained the objective of research to the participants and assured confidentiality. The time taken for the focus group ranged from approximately 40 to 50 min per group. Five constructs identified through deductive reasoning were divulged to the participants and their opinion was sought on two points— (i) To what extent these constructs measure quality in education (ii) How would they evaluate the quality of education of their institute. Most of the participants termed teacher, academician, knowledge, faculty as utmost important, followed by placement and job security, administration, admission process, infrastructure, assessment, performance etc. The words/phrases in the discussion that were repeated more than three times were recorded by the author. The same procedure was repeated for the other two groups. The recorded words and phrases of the three focus groups were collectively categorized by the other author into categories based on similarity of the theme they represented. The words and phrases converged into five constructs namely—academics, faculty, infrastructure, governance, placement. These phrases coincides with the constructs identified through deductive reasoning.
While participants of all three groups converged on five constructs provided at the start of the session, two senior faculties in engineering group and one from management group emphasized the need for regular monitoring and assessment of student’s performance. They argued that constructs like—infrastructure, faculty, governance are of marginal importance until and unless the students are assessed on their performance. Rigorous and continuous assessment compels the students to study hard and bring laurels. Such students are brand ambassadors of educational quality. After due discussions and deliberations, the other members of the groups also agreed to it. Since there was consensus in two out of three focus groups on regular monitoring & assessment of students, it was decided to add the sixth construct (assessment) to the proposed five construct measuring education qualities (academics, faculty, infrastructure, governance, placement).
With these six constructs being identified authors embarked to draft the questionnaire. The initial items were selected on the basis of literature review as well as focus group inputs. Number of items in each construct ranged from 12 to 20 totaling to 91. Questionnaire was divided into two parts—A and B, part A captured the demographic profile of the respondent and part B had all 91 items capturing constructs of interest.
Theoretical Analysis
As argued by Hardesty and Bearden (2004) in the process of new scale development the initial draft should be put to panel of expert for redaction. The initial draft of the scale consisting of 91 items was reduced to 49 by a panel of experts from engineering, management and medical field. This was done on the basis of sum score decision rule suggested by Morgado et al. (2017). Experts were asked to give a separate score out of 10, to each item based on the importance of the item to measure service quality. The summated score formed the basis for eliminating the items. The items that scored less than 21 (70%) were the candidates for deletion. The items were given a low scoring by the experts on account of being ambiguous, biased, irrelevant to the context (J. Gottlieb, Hayhoe et al., 2014; L. Gottlieb, Hessle et al., 2014).
The scale consisting of 49 items, anchored on 5 point likert scale, where 1 represented strongly disagree and 5 represented strongly agree, was put to pilot testing on a sample of 20 respondents, to refine it further. Six items were further deleted as they lacked clarity or did not express a single idea. Some changes in the structure and sequence of questions and semantics were made to engage the responder while filling the questionnaire (Clark & Watson, 1995; Malhotra, 2004). The questionnaire consisting of 43 items, after making the required changes was used to collect the data from the respondent.
A comprehensive survey (the non-probability convenience sampling technique) was initiated in different HEIs located in Central India. The data were collected from November 2020 to March 2021 in mixed mode; Online—google form and Offline—personally administered. Questionnaires were administered to 125 respondents (faculty from disciplines like management, medicine, pharmacy, engineering) at post graduate level, which resulted in 97 valid responses. Out of these 97 responses 62.9% were male and 37.1% were female. 25.8% were from engineering, 20.6% were management, 29.9% from medical, 14.4% from pharmaceutical stream and 9.3% were from other stream. 44.3% of the respondents had less than 5 years of experience, 24.7% had between 5 and 10 years of experience and 30.9% had more than 10 years of experience. All of the respondents were post graduates, including 22.7% Ph.D. holders.
Data Analysis and Results
Data once collected was subjected to analysis using SPSS and R software. Data was screened for basic assumption checks of Normality, Linearity and Outliers. Normality was assessed using Shapiro-Wilk test as lack of normality of the data can lead to a reduction in correlation among variables (Abdullah, 2006b), Outliers were detected using boxplot and standardized score and values above or below two standard deviations were removed. In all 43 items, outliers were identified and removed. Linearity was checked through visual examination of correlation matrix. All correlation coefficients were significant at 1% significant level. Kaiser-Meyer-Olkin (KMO) value of 0.88 (χ2 = 6714.04, p = .000) corroborated adequacy of sample for factor analysis Kaiser and Rice’s (1974).
Exploratory Factor Analysis (EFA)
Once it was assured that data is fit for factor analysis, EFA was carried out using Principal Component Analysis following “Varimax Rotation” technique. In accordance with Hair et al. (2010), items that showed average variance extracted (AVE) more than 0.5 and partial correlation less than .5 were retained, 10 items that did not meet the criteria were deleted. Further considering the sample size, items which loaded 0.45 or more on a single factor (Hair et al., 2010) were retained for analysis. Seven items were deleted that showed loading of more than 0.45 on more than one factor and also factor showing less than three items loadings were not considered for analysis, thus in all 26 items were retained after EFA. Four factors was extracted with 58.06% cumulative variance extracted. Eleven items loaded on first factor, eight items loaded on second factor, four items on third factor and three items on fourth factor (refer Table 2 for reliability, composite reliability and factor loadings). Based on the items that on loaded first factor was named as “Training and Placement” (TP), second factor was labeled as “Learning Resources and Facilities” (LR), third factor was labeled as “Intellectual Capital”(IR) and fourth factor was labeled as “Assessment and Evaluation”(AE).
Table Showing Standardized Loading, Variance Extracted and Reliability Estimates.

Confirmatory Factor Analysis (CFA)
After exploratory factor analysis the factors along with corresponding items were subjected to confirmatory factor analysis using “lavaan” package on R using Maximum likelihood estimation method. The output of the CFA showed decent model fit with 80 model parameters. Model showed χ2 = 327.34, p = .000, df = 247. The chi-square to the degree of freedom (CMIN/DF) value for the model was 1.32, which is in accordance with R.P. Bagozzi and Yi (1988) and Byrne (1989) suggested values less than three and less than two, respectively. Other indices for model fit showed CFI = 0.945, TLI = 0.934, NNFI = 0.934, IFI = 0.947; these values being well above 0.9 are compliant with what has been suggested by Bentler and Bonett (1980), McDonald and Marsh (1990), Bagozzi (1981), Byrne (1989). The RMSEA value was 0.058 indicated good fit as it meets Browne and Cudeck’s (1992) cut-off requirement of up to 0.08. Further, the SRMR value was 0.066, which was also well below the upper limit value 0.08 proposed by Hu and Bentler (1998), indicated a decent model.
Once the unidimensionality and reliability is established, then we have to ascertain validity (Abdullah, 2006b; Hinkin, 1998) of the constructs, which was ensured via convergent and discriminant validity (which is the extent to which the scale correlates or does not correlates with other scales assessing similar constructs). Convergent Validity of the model is established using magnitude, direction and statistical significance (Hair et al., 2010) of parameters. Standardized loadings of all items were statistically significant (p > .000), and all loadings are well within the range of 0.5 to 0.7 as suggested by Hair et al (2010), ensuring variance extracted is around 0.50 (refer Table 3) Hence construct reliabilities for various constructs TP, LR, IR, and AE calculated are 0.91, 0.91, 0.77, and 0.79 respectively. All these statistical evidences support the convergent validity of the measurement model. Though some loadings are below 0.70, 8 loadings are marginally below 0.7 others are not significantly harming CFA model fit, so these low loadings are retained as the adequate evidence of convergent validity is provided. The result of convergent validity showed that in addition to the loadings of all dimensions being more than 0.70, the average variance extracted (AVE) values of all dimensions was also higher than 0.5 (See Table 2).
Bold Elements on the Diagonal Represents AVE and Off Diagonal Elements are the Partial Correlation coefficients.

The discriminant validity was ascertained by the absence of any crossloading among construct, further in accordance with the direction given by Fornell and Larcker (1981) that the square root value of the construct AVE should be higher than its correlation with other variables, support discriminant validity of the scale. The results given in the Table 3 clearly shows that the square root of all constructs’ AVE is higher than their correlation value and absence of multicollinearity. By considering the results of EFA, CFA, unidimensionality of the scales, reliability, and validity, it can be said that the scale fully meets the benchmark requirements to propose the instrument.
Nomonological validity is ascertained through previous research findings on HE service quality which suggest that that all these constructs are positively related to each other. Correlation score between factor scores for each construct (shown above in the Table 4) support the findings as these are positively related to each other.
Values Below Diagonal are Correlation (p < .000) Estimates and Those Above are Squared Correlation.

Discussion
The initial draft of the scale had 91 items which were funneled down to 26 items through process of successive refinements. This is in line with Nunnally and Nunnaly’s (1978) assertion that the initial set of items should be 3 to 4 times more numerous than the number of items desired to ensure internal consistency of the scale (DeVellis, 2016); Margado et al. (2017) also asserts that in scale development, almost 50% items are deleted in factor reduction. Regarding minimum sample size needed for carrying factor analysis, literature suggests that sample is adequate if ratio of responses to number of factors is 20:1 (Arrindell & van der Ende, 1985; Kline, 2014) posits, that ratio of the number of cases to the number of variables should be two or more. Thus it can be safely concluded that current study sample size is adequate for carrying exploratory factor analysis
There is no doubt on the importance of service quality in higher education, however literature lacks unanimity on the type and number of service quality dimensions (Schijns, 2021); how to measure service quality (Annamdevula & Bellamkonda, 2016a, 2016b; Clewes, 2003); though researchers agree it being multidimensional construct (Teeroovengadum et al., 2019); containing multiple items dimension (Gupta & Kaushik, 2018). Researchers have agreed to a range of 3 to 28 dimensions of service quality in HE, with mode being five dimensions (Sultan & Yin Wong, 2012). It is also seen in literature that the service quality of education was focused on capturing student’s perception, but Lakal et al. (2018) a recent study conducted in engineering education has studied service quality from faculty perspective. Their study captured the response of faculty, treating faculty as the customer of this service. But the current study captures the service quality indicators form faculty perspective where students are the service user and faculty is the service provider. Thus faculty has registered their perception of what constitutes good service quality for students.
Four factors have been extracted in this study namely—Training &Placement, Learning Resource, Intellectual Resource, Assessment & Evaluation.
Training & Placement
This factor includes—timely sharing of placement news, career counseling activities, placement of the students, presence of alumni association, job profile of the offerings, personality development classes, sensitivity toward social responsibilities, positions offered in the job, system of recognition and rewards, duration of on-the-job training and company’s reputation in which placed. A closer gloss of the indicators reveals three subgroups relating to placement of students, grooming of students, and social sensitivity.
Placement of students (placement of the students, positions offered in the job, company’s reputation in which placed, job profile of the offerings, timely sharing of placement news) is an important indicator of service quality. The very reason the students takes up higher professional education is to craft a suitable career. Timely sharing of placement news is of concern to the students as it helps them to prepare for the drives. Campus placement, Job profile and company’s reputation are the key components for the students to evaluate the institute’s quality. The faculty perceives these factors as enablers to launch a good career. The institutes dealing in professional education should have a well structured placement wing, dedicated resources for timely dissemination of news, tie-ups with reputed industries, campus placements etc.
Faculty is perceptive about Grooming of students (career counseling activities, presence of alumni association, personality development classes, system of recognition and rewards, duration of on- the- job training) as quality indicator in professional institutes, because these institutes serve as pipeline for providing a regular pool of skilled human ware. Grooming attires, the students with the right skill sets thereby enhancing their employability. Provisions for on- job training should be there to provide hands on experience to the students, counseling activities provide hand holding to the students in delineating their career graphs, alumini associations give the double advantage of bringing up job opportunities as well as mentoring the students. Voice of alumni provides that element of authenticity, believability and trust in rating the institute. Since the study is on professional education, career counseling and alumni mentoring are indispensable, as often the students stand at crossroads demanding apt decision and choices. An engineering/management/pharma/medical student are ambiguous about selecting the specialization or selecting Placement Company or on prioritizing between the rungs of pay, package or profile.
Sensitivity developed toward social responsibility is a new indicators that has not been discussed so far in the extant literature on higher education. This new indicator finds place in this study as it centre’s on capturing faculty perspective of quality rather than the student’s view of the same. As faculty perspective is matured, updated and seasoned, faculty beholds a macro view and has a futuristic vision. Looking into the paradigm shift from “Me” business to “We” business, it is important that the prospective professionals are sensitized to the social needs and causes of the community.
Learning Resource
This factor includes eight items namely- library facility, type of books, number of books, availability of journals, student per experimental set up, technical staff for lab, modern equipment & latest learning material and internet. A good educational institute should have adequate library resources—books, magazines, newspaper journal. This will promote reading habits and research amongst the students. The students will thus develop problem solving abilities besides being updated about the latest practices in their respective field. The employability skills of the students are nurtured as they are well updated with the happenings around them. As this paper captures the faculty perception, the item, availability of the journal, is also included in service quality indicators which students would not have thought of, if the study had captured their perception.
Moreover the institute must have well equipped labs with software, machines, gadgets etc. so that students get sufficient practical exposure. The labs should be routinely updated with the latest software’s, equipments and gadgets so that the gap between industry practices and academia is minimized.
Faculty believes that library and internet facilities are indicators of service quality. This speaks volumes of the state of educational infrastructure in various nations. Some nations might find these facilities as a routine requirement, that need not be talked about but there are many nations where availability of these is still considered quality indicators.
Intellectual Resource
Qualification, teaching experience, industry experience, and research experience are the items that constitute this latent construct. An educational institute should have well qualified faculty with relevant expertise. A good mix of UG, PG, and doctoral degrees should be there in any academic institute to build up synergistic learning. The younger faculty always adds an element of newness in the institute while a matured faculty can add from their experience and wisdom.
The industrial experience of the faculty is given due weightage in service quality as the faculty can always relate the classroom lessons with industry practices. This fosters the employability skills of the students. The research experience of faculty can contribute in stoking the inquisitivity of the students and channelize them toward innovation and inventions.
Though the factors intellectual resource has been quoted by many similar researches (Abbas, 2020b) yet this study captures the experience of faculty, separately on industry, academia and research. While many researchers quote items like- subject knowledge, faculty communication skills, teaching style, behavior with the students as indicators of service quality, this study looks beyond the generic perception and addresses service quality with more gravity
Assessment & Evaluation
Internal assessment based on attendance and actual performance; periodic assessments are the items that make up this factor. Continuous monitoring and evaluation of the students is a must to maintain standards in education. The institute should assess the students on their regularity in attending the classes. As this is a must to build up strong foundation. The students can be voluntarily drawn to the classes if their assessment is linked to it.
Internal assessment should be so designed to capture the actual performance of the students. Maki (2002) asserts that assessment tools should be an eclectic mix of various types of formats (MCQ, Essays, Team activities, projects etc.) and should assess the various levels of cognitive skills of the students (Rao & Rajnikanth, n.d.). In a professional institute offering higher education, the students have to be prepared for employment soon after the completion of education. It is important that they develop the basic domain knowledge at the same time they should also develop applicability skills so that they can apply the knowledge in their job. A proper evaluation system is thus required to maintain the quality of students.
Sultan and Wong (2010 Truong, 2012, 2013, and 2014) suggest that service quality models in Higher Education should converge on three critical aspects namely- academic, administrative and facilities. Assessment and evaluation is the factor extracted in this study that can be considered as offshoot of academics. Learning resource, yet another factor extracted in this study is similar to facilities.
Implications of Study
PHEISQUAL is a parsimonious instrument to measure the quality of professional institutes offering higher education. The scale can be used to identify the lacune in Training and Placement, Learning Resource, Intellectual Resource and Assessment and Evaluation. Timely intervention by the management to bridge the deficiencies may go a long way in building the brand of the institutions and garnering quality faculty & students, besides attracting good recruiters. The study helps in identifying faculty holding negative perception about the institute beside gaging service quality. Based on the analysis of outcome the management may require to intervene in two different dimensions; if quality of the institute is seriously lacking then suitable action plans are required to pull it up; if faculty resentment is implicit than there is a need to organize faculty orientation program to prevent good faculty turnover.
Limitations and Directions for Future Research
The scale needs to be validated across different educational institutes spanning across varied socio-economic background. This will help in comprehending educational get varied perspectives as to what constitutes service quality across the globe. This study is limited to capture the faculty perspective on service quality, however there are other stake holders like employers, parents, management, recruiters etc., studying their perspective on quality can open up new ways to augment institute’s quality. The variation in quality spectrum across various stake holders may be studied. Panel data analysis with stake holders may be conducted to study the changes in quality perspectives.
Conclusion
This study proposes PHEISQUAL an instrument to measure SQ in HEIs offering professional education. A mixed method approach has been adopted by the researchers to develop the scale. The items for scale had been identified using deductive and inductive techniques. Subsequent to this the theoretical analysis of the scale was carried out by experts from industry and academia. The data was collected across sample size of 97 faculty members spanning across engineering, management, medical and pharmacy. Ninety-one items initially identified were reduced to 26 items, four factors extracted were namely—Training and Placement, Faculty Resource, Learning Infrastructure, and Assessment and Evaluation. As all the statistical results have complied with scale development requirement, this study finally proposes the scale to measure service quality of HEIs offering professional courses. The unique contribution of the scale is that it captures the faculty perspective of service quality besides being holistic (technical and operational service quality).
Footnotes
Declaration of Conflicting Interests
The author(s) declared no potential conflicts of interest with respect to the research, authorship, and/or publication of this article.
Funding
The author(s) received no financial support for the research, authorship, and/or publication of this article.