
Abstract
Private monetary contributions and the role of athletics are topics of discussion at nearly all institutions, and thus any relationship between the two has become increasingly valuable to determine donor motivations. This quantitative research study analyzed universities’ overall private contributions to determine whether there was a significant difference in the percentage of overall financial support to the institutions following a year of athletics success. For this study, athletics success included participation in either the Division I (DI) men’s basketball National Collegiate Athletic Association (NCAA) Final Four or DI Football Bowl Subdivision (FBS) Bowl Championship Series (BCS) Bowl Game. The study focused on a period of 10 years (2002-2011) using a sample of 129 observations (Council for Aid to Education’s [CAE] Voluntary Support of Education [VSE] Survey)—satisfying the criteria above, then comparing them with the baseline (all institutions) during the same period of time to determine whether the change in the percentage of overall contribution was statistically significant over a 2-year period. The results show a significant statistical difference of more than double in the percent increase of overall private contributions for institutions with athletics success compared with all higher education institutions. Furthermore, a small statistical difference was found for the athletics success in private institutions compared with public institutions that experienced similar athletics success. No difference was found by region, for history of athletics success, or between basketball or football athletics success for those institutions experiencing athletics success. The study concluded that there are significant implications for overall private financial support for institutions that experience athletics success, especially those with a private affiliation.
College athletics is often the first insight or topic that is discussed nationally among the U.S. public in reference to institutions of higher learning. When a university’s athletics program is successful at an elite level, the media exposure can cast a wide spotlight and positive perception on that institution (Goff, 2000). This begs the following question: When a Division Institution experiences a year(s) of “athletics success,” how does that athletics success impact an institution in terms of private contributions? For this study, athletics success included Division I (DI) institutions that competed in a football Bowl Championship Series (BCS) Football Game or National Collegiate Athletic Association (NCAA) Men’s Basketball Final Four. This operational definition of success was conservative in nature to include a broad range of definitions for athletics success. This definition is even sometimes considered to be “elite athletics success.” Fifty-two DI universities and 129 total samples were studied over a period of 10 years (2002-2011) to determine whether athletics success had a significant impact on overall private contributions to the university. Private contributions included donations to the entire university, including academic and athletic areas, and also restricted and unrestricted giving to the institution.
Universities in particular depend upon a large majority of their resources from external forces such as private contributions from individuals, corporations, and foundations (Lee & Clery, 2012). These external entities have power over the organization to determine whether it receives the resources and how the resources should be spent (Froosman, 1999). Because these funds are not required, but voluntary, the outside agencies have influence with their contributions. Therefore it is essential to understand and analyze relationships that exist in donors’ motivations for their private contributions, which may include athletics success or other variables (Wunnava & Okunade, 2013). Relationships with external entities therefore are critical to maintain and enhance those resources (Pfeffer & Salancik, 1978). Intercollegiate athletics have played a central role in higher education and those relationships for many years by galvanizing alumni, friends, community, and the campus culture.
The topics of enhanced admissions standards and private philanthropy are increasingly being emphasized on campuses nationwide. Alumni giving, in the form of private donations, are increasingly important in the current economic climate challenging higher education. In fiscal year 2012, donors contributed more than US$31 billion to the nation’s colleges and universities (Council for Aid to Education [CAE], 2013). Forty-four percent of contributions were directed from individuals, while 30% were generated from foundations and 17% from corporations (CAE, 2013).
Theoretical Framework
The theoretical framework that follows ties together the thought that the perception, image, or identity a potential donor holds or university portrays may be influential on the decision of donors to contribute or increase their monetary support. Each of the theories below are closely associated with athletics, in that often times, athletics receives the most exposure at an institution and is used as a conduit for the university’s image. A successful athletics program may convey a positive image overall of the university and make a donor more inclined to give to that institution in regard to the enhanced exposure and feelings of pride or achievement for an institution they associate with personally.
Because athletics have an impact on the external environment and perception of the institution, these theories align with the premise of this study. Understanding how these theories are woven into the fabric between athletics and the university can be beneficial to administrators to take advantage of situations where athletics success can enhance the image, perception, identity, or external environments in their favor.
Resource Dependence Theory
Resource dependence theory developed by Pfeffer and Salancik (1978) operates on the concept that organizations depend on their environments for resources, both internally and externally. Universities in particular depend upon a large majority of their resources from external forces including key stakeholders and donors to the institution. These external entities have power over the organization to determine whether it receives the resources and how those resources should be spent (Froosman, 1999). Depending on the needs and scarcity, the university can be highly dependent upon the supplier of those funds (Casciaro & Piskorski, 2005).
Resource dependence theory states that institutions are dependent on external entities to survive (Bess & Dee, 2012). External constituents not only determine whether or not an organization will receive resources but they also determine the extent to which the organization uses the resources. These constituents may be influenced by the outward perception of the institution for their donor motivations, which may be influenced by athletics success. Resource dependence theory implies that there is a power relationship. In addition to adapting to the environment, organizations must maintain strong external relationships with constituents to attain resources for stability.
Systems Theory
Systems theory originates from early research by Bertalanffy (1968) and Berrien (1968). Systems theory in organizational environments asserts that institutions have an interdependent relationship with the external environment (Bess & Dee, 2012). Ongoing transactions occur on a continuous basis between the organization and the environment. Key characteristics of the environment sustain the organization.
This theory relates how athletics has a direct and indirect impact on the institution. These direct and indirect impacts range from perception to financial. Athletics gains much public attention, and public opinion can be cast on the entire institution based on positive and negative associations. Athletic scandals, criminal arrests, or poor academic results can have a negative perception, while conversely, athletics success, community service and involvement, and academic success and graduation in athletics can lead to positive perceptions. Under this theory, reciprocal relationship exists between the organization and the environment. Such a relationship could occur in regard to athletics success and the external environment, the community where the university resides in being a primary example. This relationship could be positive, neutral, or negative.
Institutional Theory
Institutional theory addresses the significance of understanding external expectations for institutions (Bess & Dee, 2012). According to DiMaggio and Powell (1983), colleges and universities gain legitimacy through coercive, mimetic, and normative conformity. Choices made by the institution are limited by external pressures from the environment. Institutional theory explains that institutions reflect the attitudes, values, and beliefs of the external environment in which the institution is embedded (Bess & Dee, 2012). Such might be the case with the surrounding community in which an institution is located, depending upon the community’s actions and values may determine to the extent in which the athletics program is embraced or neglected. This is often the case in communities that place a heightened emphasis or expectations on institutions in regard to athletics success. One example is in the Southeastern Conference (SEC), where the fan bases can be obsessive and place great personal and emotional investments on the performance of their athletic programs.
Literature Review
Relationships Between Athletics Success and the Direct Impact on Universities
The basis of a positive relationship between donor giving and athletics team success is to an extent a psychological perspective. James Strode (2006), in his research on this topic, noted that the relationship begins with the concept of achievement.
Athletics donors earmark their gifts to athletics because of a special affinity or because of the incentives and benefits of giving to athletics (Howard & Stinson, 2008). Some have analyzed whether giving to athletics has produced a crowding-out effect, hurting overall academic giving. For instance, Howard and Stinson (2008) found that a shift toward greater athletics giving was present at schools with major football programs. The researchers deduced that schools did experience giving increases around athletics team success. Their research shows that the crowding-out effect does not occur, on average, at these institutions but that both parties (athletics and academic) benefit from success (Howard & Stinson, 2008).
The definition of success is different to each individual, although Humphreys and Mondello (2005) closely studied the effects of post-season football bowl games and NCAA DI men’s basketball tournament appearances. They define success as partaking in post-season play. Again football and basketball, the most visible sports, generate the most interest and contributions from donors. These are also the sports which receive the most media exposure nationwide. For this study, the definition was even more conservative and included only universities reaching the DI men’s Final Four or a football BCS Bowl Game.
Most importantly, Humphreys and Mondello (2005) found that restricted giving (giving specifically earmarked for athletics) did increase with appearances by schools in post-season play, although unrestricted giving did not increase. Unrestricted giving typically responds to variations in economic conditions, and athletics success does not prove to induce donors to increase this unrestricted giving.
In 2007, Humphreys and Mondello reviewed a comprehensive data set for 320 colleges and universities drawn from the Integrated Postsecondary Education Data System for the period 1976 to 1996, a previously untapped source for donation studies. Their data included giving by alumni, foundations, corporations, and other sources. They studied both restricted and unrestricted donations in the study. They found no increase in unrestricted donations as a result of any measure of success of either football or men’s basketball programs. Restricted giving appeared to rise at both public and private universities in response to success of the basketball team, and at public institutions when the football team is invited to a bowl game.
Howard and Stinson (2007) found similar findings that less prestigious academic institutions are influenced more by athletics success and have a larger portion of total institutional gifts allocated in support of intercollegiate athletics programs. According to Litan, Orszag, and Orszag (2003), there is no relationship between spending more on athletics and winning more. Second, increased spending on coaches’ salaries has no significant relationship to success or increased revenue, according to a follow-up study.
These studies would be another factor to examine each institution on a case-by-case basis to determine why this is so. One could hypothesize back to the culture and environment discussed in the “Theoretical Framework” section that relates to giving; stated that the mission, image, identity, and expectations of the institution affect perceptions and, therefore, emphasis placed on athletics success and giving. Simply stated, each institution’s perception and relationship with athletics is shaped by their own identity and community or environment in which each institition is located.
Meer and Rosen (2008) found when a male graduate’s former team wins its conference championship, his donations for general purposes increased by about 7% and his donations to the athletics program increased by about the same percentage. This study indicates another perspective that overall athletics success drives overall private contributions to an institution. Rhoads and Gerking (2000) also found a positive relationship by examining bowl appearances in football and NCAA tournament appearances in basketball, which resulted in an increase in overall alumni contributions to the institution.
Ethical Issues and Litigation in College Athletics
Large ethical concerns persist within college athletics. Walter Byers, who served as NCAA executive director from 1951 to 1987, was charged with the dual mission of keeping intercollegiate athletics clean while generating millions of dollars each year for the colleges. Byers believes that modern-day college sports are no longer a student activity or amateur sport, but they are a high-dollar commercial enterprise, and college athletes should have the same access to the free market as their coaches and colleges (Byers, 1995).
College athletics is now beginning to see this proliferation with recent litigation involving student-athlete’s names, images, or likeness (O’Bannon vs. NCAA, 2014) and student-athlete compensation in regard to EA Sports video games (Keller vs. NCAA, 2014). With these recent rulings, student-athletes may be compensated for use of their names, images, or likeness. While the Keller case was settled out of court, the O’Bannon case entitles student-athletes to be compensated via a trust with a cap no less than US$5,000 per year, depending on academic eligibility (O’Bannon vs. NCAA, 2014). This opens up a new dynamic whereby student-athletes are now sharing a portion of revenues. These recent rulings appeal to earlier research suggesting the exposure and exploitation of amateur student-athletes (Sack & Staurowsky, 1998; Zimbalist, 2001).
Indirect Benefits of Athletics Success
In addition to individual benefits, there may also be indirect effects to public institutions in terms of state appropriations. Using data on 570 public universities, Humphreys (2006) found that those fielding DI Football Bowl Subdivision (FBS) football teams receive about 8% more from their state legislature than otherwise comparable universities that do not participate in DI (FBS) football. Participation seems to be what matters. Success is less important. State subsidies appear to be no greater for universities with top 20 or bowl-participating football teams.
Bowen and Shulman (2001) found that among a top donor group, the top 5% of donors to universities do not, on the whole, care about athletics and instead cite more interest in supporting undergraduate education, intellectual freedom, and extracurricular activities. Donors of today are looking to support broad participation, affecting the largest number of lives possible. Most donors often identify with the many students who are leading lives similar to the ones they led while in school, which is more than likely not as one of a few star athletes. Ultimately, donors want their schools to place less, not more, emphasis on collegiate athletics (Bowen & Shulman, 2001). Although this research shows evidence of no relationship between success and giving, the pervading outcome of research on this topic reveals a positive relationship between the two.
The most notable university admissions case as it relates to athletics success originates from Boston College University and the “Flutie Factor” that resulted from Doug Flutie’s on-field heroics in 1984 (Fleming, 2007). In this case, Boston College experienced an unprecedented 30% application increase in the 2 years following the legendary Hail Mary pass (Fleming, 2007).
Since this case, there are a number of other similar situations where universities have experienced a spike in applications and have increased their enrollment due to athletics success. McEvoy (2006), in an article written for the United States Sports Academy, shows empirical support for admissions applications increases and provides a number of additional case studies and previous research on the topic, all contributing further to this fact. Athletics serve as a marketing tool and rallying point for the institution, leading to recruiting more students, not just student-athletes (McEvoy, 2006). In addition, and equally as important to higher education, empirical evidence finds that athletics prominence and success were related to increased out-of-state enrollment (McEvoy, 2006).
Recently, Butler University after their consecutive runs to the men’s Final Four experienced an increase of 41% in applications, athletics donations increased by 200% (US$1 million to US$3 million over 2 years), and alumni giving increased 10% in 1 year (DiConsiglio, 2012). Some reports also estimate the public exposure Butler received was estimated at US$500 million in publicity (DiConsiglio, 2012). Gonzaga, Virginia Commonwealth University (VCU), Texas Christian University (TCU), and Boise State have all seen similar results in applications and donations (DiConsiglio, 2012).
Toma and Cross (1998) also found athletics success relates to an increase in applications. They compared the 30 institutions that won national championships in football and men’s basketball between 1979 and 1992 with a set of peer institutions to see if an increase in admissions applications occurred after athletics success. The researchers found that under most circumstances notable increases resulted in admissions applications received, both in the year of, and over the 3 years following the championship season (Toma & Cross, 1998). Sandy and Sloane (2004) found that institutions with DI athletics programs attract more applications and enroll students with higher average SAT scores than similar institutions that do not participate in DI sports. McCormick and Tinsley (1987) discovered the same results when they examined 63 universities, each in one of the six “big-time” athletics conferences, compared with other colleges and universities.
Fleming (2007), in a report on Jaren and Devin Pope’s research around sports success and admissions, declares the empirical evidence among the top 20 football schools and top 16 basketball schools, has an increase of between 2% and 8% in admissions. Fleming noted that Pope found an increased pool of applicants across the schools with both high and low SAT scores. While the amount of applicants may increase, critics say that the yield decreases. However, Pope and Pope (2009) argue that the greater amount of applications simply allows the institution to be more selective and improve their incoming freshmen class. Tucker (2005) also found significance in the relation to football success and enhanced incoming freshmen’s SAT scores from studying years 1990 through 2002.
The most influential piece of Pope and Pope’s (2009) research is that it was conducted over a 19-year span, eliminating the chance for critics to claim that the increase in admissions was not sustainable. This time period allows the studies to show the increase as well as the stability that followed (Pope & Pope, 2009). In an interview with George Mason University’s press secretary, it was revealed that the school had a number of positive outcomes from their Final Four appearance in 2006. On top of admissions increasing, the general visibility and awareness of the institution created a genuine sense of pride in those affiliated with the university and produced a special curiosity from those who did not know about the university (Pope & Pope, 2009).
Most recently, Koo and Dittmore (2014) determined that winning football teams are related to increases in both academic and athletic donations. They ruled out the idea that athletic donations “crowd out” academic donations (Koo & Dittmore, 2012), finding rather that “there was a significant and positive causal relationship between athletic factors and academic giving.” For example, the coefficient on athletic giving implied that for every US$1 increase in athletic giving, the current dollars of voluntary support restricted to academic purposes will increase by 48 cents.
Based on this evidence showing a positive relationship between university admissions and athletics team success, institutions of higher education have a choice of how to capitalize on this phenomenon. McEvoy (2006), in his research, gives a detailed listing of options for the university. First, the university could admit more applicants of “comparable quality” resulting in increased enrollment and, thus, additional revenue. Second, the university could increase the “rigor in its admissions process,” admitting the same number of students as before, although with better qualifications, increasing the average quality of student. Third, a hybrid approach could be taken by only slightly increasing the applicant pool and increasing admissions standards (McEvoy, 2006). Regardless of the option that is chosen, the institution should benefit.
Although athletics has been viewed as an entity that primarily needs university subsidies and can contribute to the “cost disease” at many institutions nationwide, there are benefits. In select cases, programs at the highest levels generate revenue and can help alleviate financial burdens for their institutions. Anderson (2012) found a positive link between athletics success and donations, applications, and enhanced freshmen students’ academic standards. His study finds that winning reduces acceptance rates (enhancing selectivity), and increases donations, applications, academic reputation, in-state enrollment, and incoming SAT scores. Prior to this study, conflicting studies existed as to whether athletics success increases overall donations to institutions (Anderson, 2012; Bowen & Shulman, 2001; Howard & Stinson, 2007, 2008; Humphreys & Mondello, 2005; Meer & Rosen, 2008).
From his conclusions, Anderson (2012) states, Consider a school that improves its season wins by 5 games (the approximate difference between a 25th percentile season and a 75th percentile season). Changes of this magnitude occur approximately 8% of the time over a 1-year period and 13% of the time over a 2-year period. This school may expect alumni athletics donations to increase by $682,000 (28%), applications to increase by 677 (5%), the acceptance rate to drop by 1.5 percentage points (2%), in-state enrollment to increase by 76 students (3%), and incoming 25th percentile SAT scores to increase by 9 points (1%). (p. 18)
Another recent case is the first of its kind; Louisiana State University (LSU) Athletics announced in the summer of 2012 that they will begin transferring up to US$7.2 million annually to the academic side of campus from athletics revenues. This is the first case where an athletics program has pledged to help contribute to the overall university instead of receiving a subsidy (Addo, 2012). Other institutions support the academic side, but it is usually on a year-to-year basis and not pledged over a period of years. In recent years, athletic support of academic initiatives has grown at many institutions. However, the support of academics by athletics is rare; 98 of the 120 DI institutions in 2010 lost money on their athletics programs; the median deficit was US$9.4 million (National Collegiate Athletic Association [NCAA], 2010). Yet schools remain caught up in an ever-escalating “arms race”—at the expense of academic scholarships, facilities, and faculty (Benedict & Keteyian, 2013). It is a case of a “go big or go home” mentality, which can either pay off large for a small amount of schools or leave institutions “footing the bill” for their athletics programs.
Data and Method
The research questions addressed in this study were as follows:
This study was a quantitative analysis of public, secondary data obtained through the CAE’s Voluntary Support of Education (VSE) Survey, a voluntary survey of higher education institutions with standardized data pulled from their annual reports. This survey was selected because it records private support to nearly each institution of higher education and is the most comprehensive and complete annual survey on overall private contributions. The CAE has conducted survey research on the private support of education since 1957 (CAE, 2013). Over the years, this research has evolved into a large-scale annual research and dissemination program, the VSE. The survey is open to all colleges, universities, and private elementary and secondary schools in the United States. The Council for Advancement and Support of Education (CASE) co-sponsors the survey. Based on these results, CAE develops and disseminates national estimates of giving to higher education (CAE, 2013).
The VSE Survey is designed to obtain information on the amounts, sources, donor-specified purposes, forms of private gifts, grants, and bequests received by educational institutions. The 2013 VSE Survey collected data on funds raised from private sources for the fiscal year beginning July 1, 2011, and ending June 30, 2012, with a few institutions reporting on different fiscal calendars (CAE, 2013). In July 2012, CAE mailed an announcement that the survey was open to 2,700 four-year institutions and 1,184 two-year institutions. For this study, the category of “total support” was identified as the main dependent variable. Total support was defined as the total of outright giving and deferred giving, both at present value (CAE, 2013).
In the most recent survey by the CAE (2013), 1,015 higher education institutions had provided complete data, including all samples studied for this research project. A baseline of financial support in terms of difference in giving by percent was totaled for all higher education institutions utilizing these institutions from 2001 to 2012, a year before the 2002 athletics success and a year after the 2011 athletics success. This baseline was used against the sample to determine whether a statistically significant difference was found. The population as defined by athletics success was applied for the recent last 10 years (2002-2011), to determine whether there was a significant difference in the percentage of contributions to the university utilizing a one-sample t-test analysis in SPSS (19th edition). Subsequent research questions regarding differences in region were analyzed using a one-way ANOVA test; public or private affiliation, history of athletics success, and basketball versus football success were analyzed using an independent samples t test.
All higher education institutions that participated in the VSE Survey were included in the study, which ranged from 954 to 1,052 participants from 2001 to 2012 (CAE, 2002-2013). The institutions, including DI athletically successful ones, were used as a baseline for comparison with those schools that experienced athletics success. Based on the definition for athletics success, 40 institutions participated in a men’s Final Four over the last 10 years from 2002 to 2011 (NCAA, 2013). One institution did not report data in the survey and was excluded, leaving the sample size for DI basketball at 39. Also using a similar definition for athletics success applied to DI football, 91 institutions competed in a BCS Bowl Game over the last 10 years from 2002 to 2011 (Bowl Championship Series, 2013). One institution did not report data in the survey and was excluded, leaving the sample size at 90.
Adding the DI basketball athletically successful institutions (39) to the DI football athletically successful institutions (90) provided a total sample size of 129 for the study. There were 52 universities included as independent variables, as multiple schools competed in Final Four or BCS Bowl multiple times. Each year accounted for a separate sample totaling 129, and data were collected accordingly over the 10-year defined period. The years collecting data span from 2001 to 2012 compared with the period of athletics success, 2002 to 2011, to collect all previous year’s data and the year following the success, which is why 2012 athletics success is excluded (fiscal year 2013 data were not available, released in 2014 VSE Survey).
Measurements were taken the year prior to the athletics’ success, year during, and the year after, accounting for a 2-year span. These data measured the percentage of increase or decrease of private support over the 2 years compared with the baseline (all institutions of higher education listed in the survey, average N = 1,003), and whether that difference was statistically significant utilizing a one-sample t test. A one-sample t test was administered to determine significance at the .05 alpha level. Effect size was measured after the t test to determine the effect size of any significant statistical differences found. A Cohen’s d test was utilized to find the effect size of each significant result (Cohen, 1988).
The data were segmented including region, public versus private affiliation, history of athletics success, and basketball versus football success. A one-way ANOVA test was used to compare the groups in terms of regions (East, North/Midwest, South, and West). Each region was compared with the baseline via a one-sample t test. If a region was found to be significant, then that region(s) was (were) compared against the other regions in an independent samples t-test comparison. Independent samples t tests were utilized to compare the groups in terms of public versus private affiliation, history of athletics success, and basketball versus football success.
Study Demographics
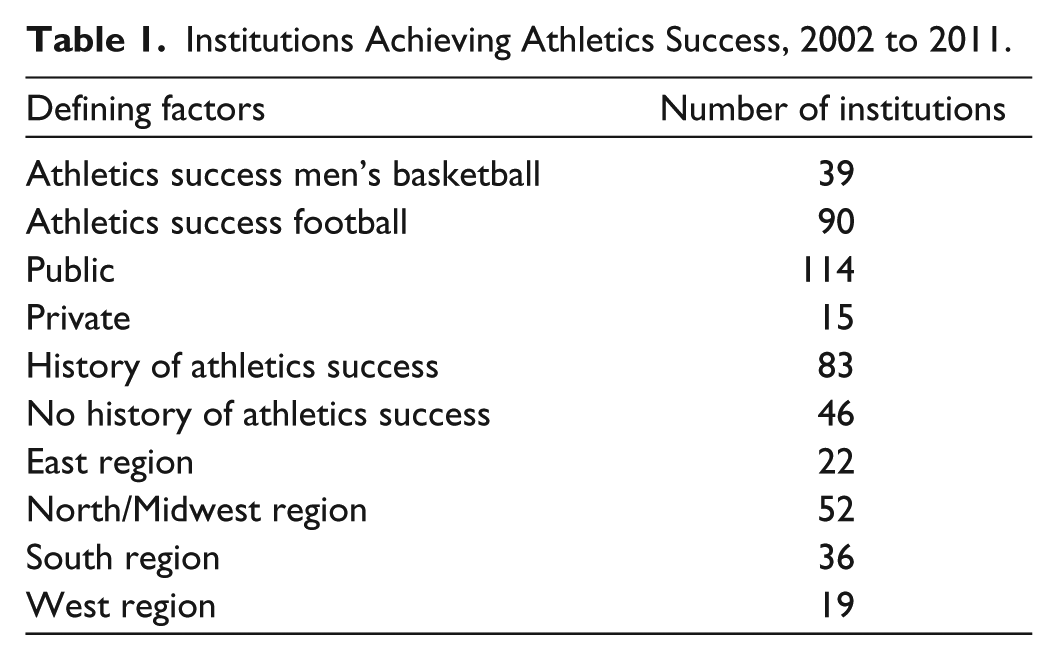
The study included 129 observations during the last 10 years, 2002 to 2011, that had achieved athletics success. As stated, athletics success was defined as participating in the men’s DI NCAA Final Four in basketball or a BCS Bowl Game in football. Ninety of these institutions studied participated in a BCS Bowl Game, while the remaining 39 participated in men’s DI NCAA Final Four. Fifteen of these institutions were private institutions, while the remaining 114 were public institutions. Eighty-three institutions were identified as having a “history of athletics success.” A history of athletics success in this study was defined as a school wining two or more national championships in that sport. Forty-six institutions were identified as no “history of athletics success” for this study. Schools were also placed into a geographical region and analyzed. Twenty-two institutions were listed in the “East” region of the country, 52 were listed as “North/Midwest” region of the country, 36 were included in the “South” region of the United States, and lastly, 19 institutions were identified in the “West” region of the country (Table 1)
Institutions Achieving Athletics Success, 2002 to 2011.
Results
Research Question 1
For Research Question 1, a one-sample t test was conducted comparing 129 DI institutions with athletics success to the baseline, which ranged from 954 to 1,052 institutions, with an average of 1,003 respondents for all higher education institutions reporting during 2001 to 2012. The mean percent change during a 2-year period for all higher education institutions was 0.0535 (5.35%) increase during the time period of 2002 to 2011, which included the athletically successful institutions as well. The athletically successful institutions mean was 12.84% during the same time period. The results of the one-sample t test were significant at the .05 level, t(128) = 3.09, p = .002, d = 0.55 (Table 2); therefore, there is a statistically significant difference between the percent change in private contributions to institutions that experience athletics success compared with all other institutions.
Comparison of Means of Percent Change in Private Contributions Over 2 Years Between Athletically Successful Division I Institutions and All Institutions.

The results show a median percent change for all higher education institutions of 5.35% over 2 years. Those institutions with athletics success exhibited a median percent change of 12.84% (Figure 1). As stated above, this difference is statistically significant (p = .002). This indicates an average increase of more than double for an institution that experiences athletics success over the baseline. The effect size or Cohen’s d for this result was 0.55. This result of .55 indicates the two groups’ means differ by more than half a standard deviation. This difference is larger than .5, which is considered a medium effect size (Cohen, 1988). The formula used to compute the Cohen’s d effect size was d = (t × 2) / (sqrt (df)), where, d = Cohen’s d value or effect size (standardized mean difference), t = t-test value, and df = degrees of freedom.

Percent increase of overall giving to institutions over 2 years (2002-2011).
Research Question 2
For the second research question, the study conducted several tests on each of the variables. For the variable private versus public, an independent samples t test was conducted between private (M = 0.2821, SD = 0.34) and public (M = 0.1081, SD = 0.26) and showed marginal statistical significance between the two groups, t(16.27) = 1.92, p = .072, d = 0.34 (Table 3). The equal variances not assumed was used because homogeneity of variance was not met (.038 < .05) in the Levene’s Test for Equality of Variances.
Comparison of Private Versus Public Division I Athletically Successful Institutions.

Private and public DI institutions were then separately studied in a one-sample t test versus the baseline. Private institutions displayed a statistical significance versus the baseline, t(14) = 2.62, p = .02, d = 1.40 (Table 4). The effect size for private institutions that experienced athletics success was above the threshold for an effect size considered large (1.40 > 0.80) in a study (Cohen, 1988). Public institutions also demonstrated statistical significance versus the baseline, t(113) = 2.24, p = .027, d = 0.42 (Table 5). The effect size for public institutions that experienced athletics success was considered between the small (0.2-0.3) to medium range (0.50) in this instance (Cohen, 1988). This could possibly show the private institutions as a driving force as an interaction effect.
Comparison of Private Athletically Successful DI Institutions Versus the Baseline.
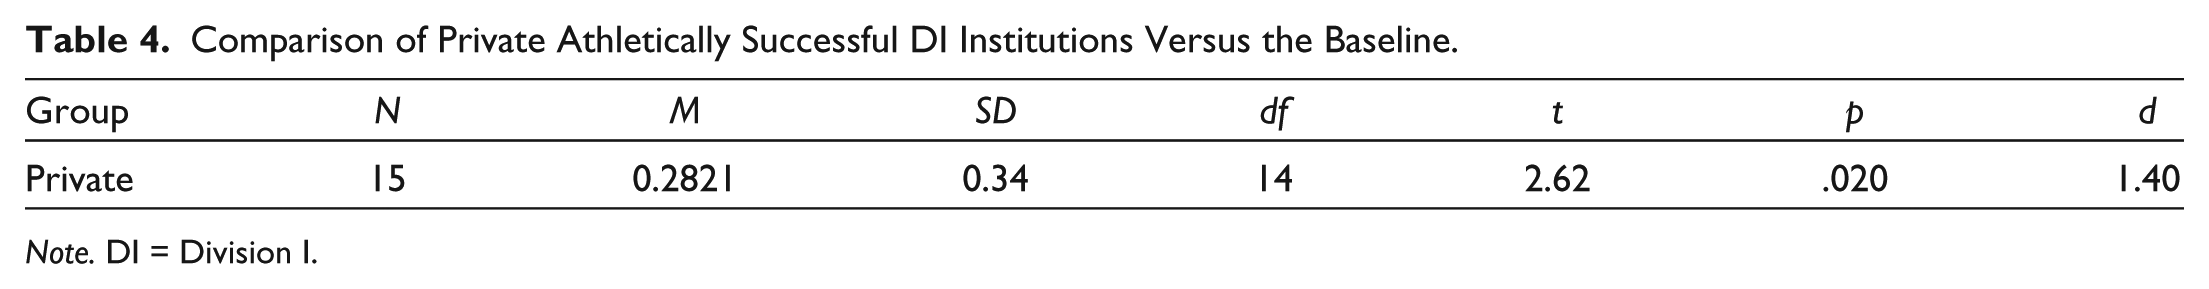
Note. DI = Division I.
Comparison of Public Athletically Successful DI Institutions Versus the Baseline.

Note. DI = Division I.
Next, the study conducted an independent samples t test between institutions with a history of athletics success, which experienced a year of athletics success, versus institutions with no history of athletics success, which experienced a year of athletics success. The results concluded no statistical significant difference between the two groups aforementioned, t(127) = 0.46, p = .648 (Table 6).
Comparison of Athletically Successful DI Institutions With a History of Athletics Success Versus Athletically Successful DI Institutions With No History of Athletics Success.
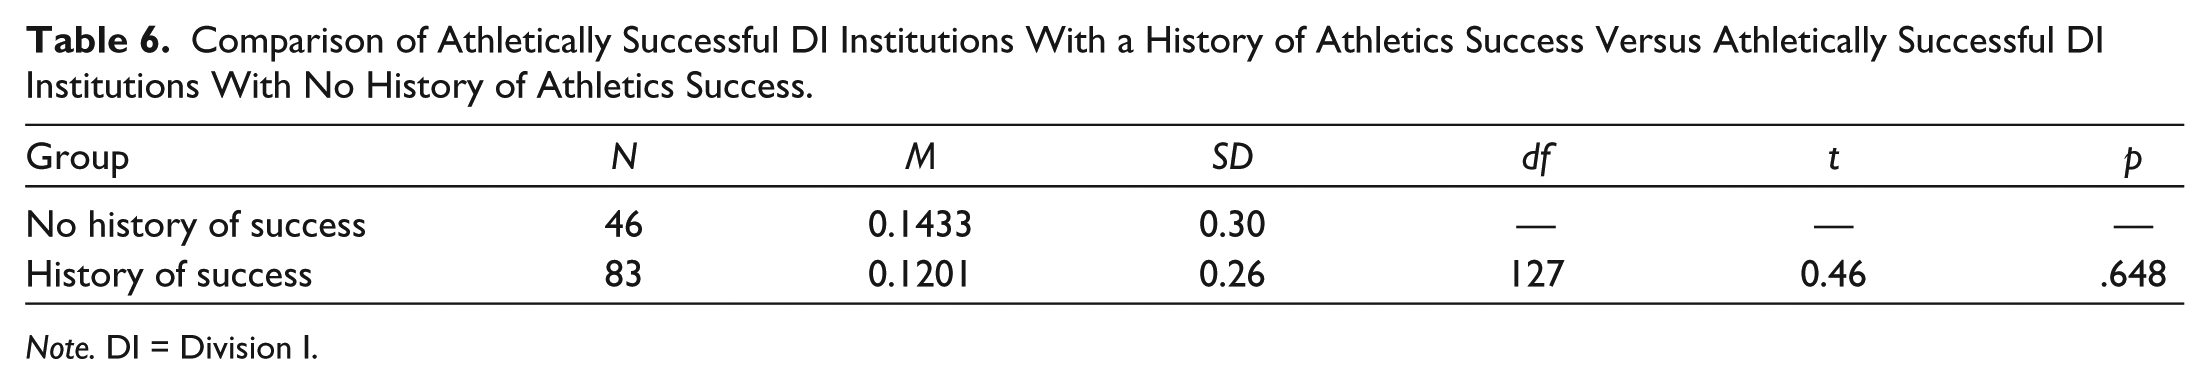
Note. DI = Division I.
The following analysis determines whether there were differences between geographical regions of the country that experienced athletics success. Each institution was segmented into one of four regions: East, North/Midwest, South, or West. Twenty-two institutions were classified as East, 52 as North/Midwest, 36 as South, and 19 as West. A one-way ANOVA test was conducted; the results showed no statistical difference between the four groups, t(3, 125) = 0.41, p = .745 (Table 7).
Comparison of Athletically Successful DI Institutions by Region of the Country (East, North/Midwest, South, and West).

Note. DI = Division I; SS = sum of squares; MS = mean squares.
After examining the difference in means between the groups (Figure 2), a one- sample t test was conducted separately utilizing each region versus the baseline. The results below illustrate only the South region exhibiting a statistically significant difference from the baseline group, t(35) = 2.36, p = .024, d = 0.80 (Table 8). The effect size is considered to be large (0.80).

Means plot for athletically successful institutions by region.
Comparison of Athletically Successfully DI Institutions by Region Versus the Baseline.

Note. DI = Division I.
Because the one-sample t test showed significance in the South region, but no other regions, a follow-up independent samples t test was conducted comparing the South region versus all other regions. The results demonstrate no statistical difference was found between the South region and all other regions combined, t(127) = −1.02, p = .311 (Table 9). Furthermore, a one-sample t test comparing the three regions, excluding the South region, still found significance compared with the baseline, t(92) = 2.14, p = .0353, d = 0.45.
Comparison of Athletically Successful DI Institutions in the South Region Versus Athletically Successful DI Institutions in All Other Regions.

Note. DI = Division I.
Finally, the study conducted an independent samples t test between institutions that experienced athletics success in basketball versus institutions that experienced athletics success in football. The results indicate no statistical significant difference between the two groups aforementioned, t(128) = 0.81, p = .418 (Table 10).
Comparison of Football Athletically Successful DI Institutions Versus Basketball Athletically Successful DI Institution.

Note. DI = Division I; BB = Basketball; FB = Football.
Discussion
The results of this study reveal a statistically significant difference in the percent increase of private contributions for institutions that experienced athletics success compared with all higher education institutions (baseline). The mean difference was 12.84% for the athletically successful institutions versus 5.35% for the baseline group. This was more than double an increase in the percent of private contributions. The increase was even more powerful because the baseline also included the athletically successful institutions, which they (the independent variable—athletically successful institutions) are being compared against. These results indicate there are indeed financial implications for institutions that are athletically successful to reap the benefits.
The study found that regardless of public or private affiliation, history of athletics success, or region, those DI institutions that experience athletics success, either in basketball or football, saw a significant increase in overall private contributions to their institution. These results are especially meaningful because the impacts on the institution are of a financial nature. These enhanced resources can facilitate desired growth for the institution in manners it deems appropriate. These resources and impact may have a long-lasting result and cultivate future financial gains in the process. These findings relate back to the resource dependence theory, in that institutions are dependent on external stakeholders for resources and, therefore, must be cognizant of motivations and influencers those stakeholders may hold, which could include athletics success (Pfeffer & Salancik, 1978).
The study also found a marginally significant difference between private institutions that experienced athletics success compared with public institutions with the same athletics success. These results show there may be a particular advantage to private institutions that experience athletics success compared with baseline institutions. In this instance, the impact is very noticeable, with a 28% increase over 2 years compared with a 5% increase for all other institutions during the same period of time. This was more than five times an increase for private institutions’ overall financial support compared with the mean percent increase for all higher education institutions.
The results regarding the second research question were evaluated by several statistical analyses. For differences by region, all four regions were found to not be different statistically from one another by way of a one-way ANOVA test. However, analyzing the data in more depth, the study found the South region to be the largest in terms of percent change in contributions over 2 years, 16.8%, while the West region had the lowest value at a 9.25% change. The only region that was significantly different versus the baseline independently was the South region, t(35) = 2.36, p = .024, d = 0.80. This represents a large effect size, indicating a possible interaction effect on the group as a whole as none of the other regions differed significantly when individually compared with the baseline using a one-sample t test. Another contributing factor may be smaller degrees of freedom for each group individually, which could account for why the other groups did not see a statistically significant difference from the baseline individually. This was ascertained to be true by subsequent tests showing the regions not differing from one another, and the three regions (excluding the South region) showing significance when compared with the baseline in a one-sample t test.
For the variables private versus public affiliation and impact on institutions with athletics success, the study found a marginal significant difference between the two in an independent samples t test, t(127) = 1.92, p = .072, d = 0.34. The effect size was considered to be relatively small. Examining the two individually compared with the baseline, the study found both to be statistically significant. The private institutions that experienced athletics success had a mean percent change over the 2 years of 28.2%, t(14) = 2.62, p = .020, d = 1.40. The effect size for the private institutions was very large. This indicates a very strong relationship between athletics success and the increase in contributions in terms of percent for private institutions. The public institutions also saw a significant difference from the baseline with a mean percent change over the 2 years of 10.8%, t(114) = 2.24, p = .027, d = 0.42. The effect size of 0.42 was close to a medium effect size (0.50), but not as significant as private institutions. This represents a significant finding for public institutions, and even more so in regard to those with a private affiliation. One thought on why this may be is the culture of philanthropy at private institutions is more deeply entrenched; thus, as a result of an athletically successful year, it motivates an already larger generous populous to contribute, compared with public institutions. This is also verified as the top 10 institutions in percentage of alumni that give back are all private institutions (The Alumni Factor, 2012).
For the variable history of athletics success, although a difference in means between the two groups existed, the study concluded no statistical difference between those institutions with a history of athletics success (M = 12%) compared with institutions without a history of athletics success (M = 14.3%). This suggests that all institutions regardless of their history of athletics success can benefit from a year of athletics success.
Testing of the last research question to determine whether a difference existed between DI institutions with basketball success versus DI football success, the study found no statistical significant difference between the two. It was, however, interesting to note that institutions with basketball success exhibited a larger mean (M = 16.1%) compared with institutions with football success (M = 11.9%).
The main result of this study, that DI institutions that experience athletics success exhibit a significant difference in private contributions, is congruent with previous studies (Anderson, 2012; Howard & Stinson, 2008; Humphreys & Mondello, 2005; Meer & Rosen, 2008). However, what is unique to this study was the definition of athletics success was more narrowly defined, and the data source utilized was the VSE Survey, which were distinctive from the studies above. Moreover, this study found significance utilizing this data set where a previous study in 2007 by Humphreys and Mondello using a similar database found no significance from the years 1976 to 1996.
These current findings may indicate a shift in the influence athletics success plays in private contributions to institutions in the current environment. This study also differed from previous studies, in that it accounted for multiple years prior to and after the athletics success, for a more accurate reflection of how the athletics success had a significant financial impact on those institutions. Accounting for a change over multiple years versus a single year after athletics success provides additional validity to the study compared with previous studies.
The results indicating private institutions benefit more than public institutions may contradict the study by Howard and Stinson (2007), which found less prestigious academic institutions are influenced more by athletics success. Howard and Stinson defined prestigious institutions as Tier I by U.S. News & World Report. During the time of this study by Howard and Stinson (2007), Tier I was defined as institutions that ranked in the top 50%, currently institutions are classified as Tier I if they rank in the top 75% (U.S. News & World Report, 2012). Although the two studies’ definitions do not align, and a majority of the private institutions are classified as Tier I, the findings are interesting to note and surprising given the study’s hypothesis. The difference in means over 2 years was marginally significant between the private and public institutions (28.2% vs. 10.8%). Furthermore, Humphreys and Mondello (2007), in their study ranging from 1976 to 1996, found basketball success was linked to an increase in restricted contributions at both private and public institutions; however, football success was linked to an increase at only public institutions. In an earlier study, Humphreys and Mondello (2005) defined restricted donations as those earmarked for athletics, suggesting that academic departments do not benefit from athletics success at public institutions, although similar to Howard and Stinson’s (2008) findings, private institutions did see an increase in academic giving.
This study found a relationship at both private and public institutions and giving overall, which may be evidence that there may be a shift in the donor’s perception nationwide regarding athletics and private contributions. One could hypothesize back to the culture and environment discussed in the “Theoretical Framework” section that relates to giving; stated that the mission, image, identity, and expectations of the institution affect perceptions and, therefore, emphasis placed on athletics success and giving. Organizational image and identity theory relates to the identity and image portray by the university as a result of the athletics success (Dutton & Dukerich, 1991).
Next, the results comparing variables by region and history of athletics success are unique, in and of themselves because these variables have either been lightly researched or never been studied previously in this context and definition of athletics success. Particularly of interest, are the results for the South region being significant when compared with the baseline. This may represent an influential variable on the data set as a whole.
Lastly, the findings on private contributions for basketball success versus football success observed no statistical difference between the two. This was similar to the findings by Humphreys and Mondello (2007) that found restricted giving appeared to rise at both public and private universities in response to success of the basketball team, and at public institutions when the football team is invited to a bowl game.
Implications for Operational Policy
There are 347 institutions that compete at the NCAA DI level in basketball and 124 institutions that field an NCAA DI (FBS) football program (NCAA, 2013); for these schools, the implications from these results are vast. The results from this study help to quantify the return on investment in athletics programs in terms of overall private contributions to the institution. This also does not take into account other intangibles and possible indirect results from this athletics success, such as increased applications, enrollment, improved SAT/ACT scores of incoming freshman, enhanced national attention/marketing/exposure, royalties from sales of merchandise, community economic impact, television revenue, and possibly enhanced image of the institution.
These findings may help justify and encourage those institutions to invest in their athletics programs strategically to reap these financial benefits. Administrators should have a strategic plan in place well before the success occurs to take full advantage of the benefits, much like institutions have an emergency preparedness plan. By having a strategic plan, universities will be able to capitalize on the marketing, exposure, donations, and image to the fullest extent during and immediately after athletics success. This thought relates to institutional theory in which institutions should understand external expectations and strategically align themselves with the external environmental conditions, such as the impact athletics success may create for their university (DiMaggio & Powell, 1983). Each institution should prepare for as many extreme instances as possible, both positive and negative. This is especially true in communities that place an enhanced emphasis on athletics success such as the southern region of the United States as indicated in the results of this study.
This is especially true because the study found no statistical difference between schools with a history of athletics success compared with institutions without a history of athletics success. Excellent examples come from the recent and surprising success of such teams including VCU, George Mason, Butler, Boise State, and TCU. However, even institutions with a long history of success may benefit from recent athletics success. In April of 2013, after Michigan made a deep run in the men’s basketball NCAA Final Four, Charles Munger committed US$110 million to the University of Michigan, the largest gift to the institution (University of Michigan News Service, 2013). Furthermore, the gift was made after he was an invited guest of the university to the Final Four, and his gift was designated for the academic side of the institution to build a new graduate student hall. This recent gift speaks to the power and influence athletics may hold in donor motivations, even to gifts toward academic initiatives.
Recommendations for Future Research
Although this study provided substantial and unique results, not to mention added to continuing research on this subject, several future studies should be conducted on topics related to athletics success and the financial impact on universities to expand on this relationship. To further this research, one could examine in detail where the increase in contributions was allotted within the institution. However, because most athletics departments are subsidized, even if all the increase went specifically toward athletics, the institution itself would benefit by providing less of a subsidy, thereby saving resources that could be allocated elsewhere based on priority and needs of the university.
The relationship between private and public affiliation in regard to athletics success should be researched further to determine if a strong relationship exists. The sample size of 15 in this study for private institutions was rather small and a stronger relationship may be found with an expanded study of private institutions that experience athletics success.
In regard to region, there were no statistically significant differences between regions that experienced athletics success. However, the Southern region exhibited the largest mean among the groups and was the only region to exhibit significance on its own compared with the baseline. In the future, conducting a two-way ANOVA accounting for athletics success in basketball and football by region would be suggested. There may be an influential pattern found by sport and region if further research is completed.
There are also several other direct and indirect financial impacts of athletics success on institutions. Several recommendations for future studies may include analyzing television revenue and royalties universities receive and how they may fluctuate based on athletics success. Also, the economic impact of the athletics success may be examined in the community which the institution resides in, which associates with systems theory, in that institutions have an interdependent relationship with their external environment (Berrien, 1968; Bertalanffy, 1968). Athletics success in relation to donations relates to systems theory and how that success has a direct and indirect impact across the entire institution in regard to financial and perception values.
Finally, the ability to quantify the marketing, exposure, and possibly enhanced perception or rankings an institution gains from their athletics success would be of particular interest because these variables are often difficult to measure but can be very valuable financially in the long term. Simply enhancing the alumni giving percentage can increase an institution’s ranking in the U.S. News & World Report marginally, which accounts for 5% of the rankings (U.S. News & World Report, 2012).
Footnotes
Declaration of Conflicting Interests
The author(s) declared no potential conflicts of interest with respect to the research, authorship, and/or publication of this article.
Funding
The author(s) received no financial support for the research and/or authorship of this article.