
Abstract
This article aims at determining the impact of various components of fiscal policy on the Nigerian economy. We simply used descriptive statistics to show contribution of government fiscal policy to economic growth, and to ascertain and explain growth rates, and an ordinary least square (OLS) in a multiple form to ascertain the relationship between economic growth and government expenditure components after ensuring data stationarity. Findings revealed that total government expenditures have tended to increase with government revenue, with expenditures peaking faster than revenue. Investment expenditures were much lower than recurrent expenditures evidencing the poor growth in the country’s economy. Hence, there is some evidence of positive correlation between government expenditure on economic services and economic growth. Therefore, in public spending, it is important to note that the effectiveness of the private sector depends on the stability and predictability of the public incentive framework, which promotes or crowds out private investment.
Introduction
Fiscal policy is the means by which a government adjusts its level of spending to monitor and influence a nation’s economy. It is used along with the monetary policy, which the central bank uses to influence money supply in a nation. These two policies are used to achieve macroeconomic goals in a nation. These goals include price stability, full employment, reduction of poverty levels, high and sustainable economic growth, favorable balance of payment, and reduction in a nation’s debt.
Nigeria’s potential for growth and poverty reduction is yet to be realized. A key constraint has been the recent conduct of macroeconomics, particularly fiscal and monetary policies. This has led to rising inflation and decline in real incomes. National economic management became a Herculean task as the economy has to contend with volatility of revenue and expenditure. The widespread lack of fiscal discipline was further exacerbated by poor co-ordination of fiscal policy among the three tiers of government. Also, there is a weak revenue base arising from high-marginal tax rate with very narrow tax base, resulting in low tax compliance. As a result of these and other factors, serious macroeconomic imbalances have emerged in Nigeria. A review of these macroeconomic indices shows that inflation has accelerated to double-digit levels in 2000 and 2001. It increased from 6.94 to 18.87, respectively. This double-digit inflation continued up to 2005, and decreased to single digit in 2006 and 2007. In 2008, the inflation rate reverted to double digit (11.58) and continued to increase, and in 2010, it was 13.72% (International Monetary Fund [IMF], 2011). Unemployment is a major political and economic issue in most countries. In Nigeria, the years of corruption, civil war, military rule, and mismanagement have hindered economic growth of the country. Nigeria is endowed with diverse and huge resources both human and material. However, years of negligence and adverse policies have led to the under-utilization of these resources (Economic Watch, 2010), and this has contributed to the increasing unemployment rate in Nigeria. In 2000, the unemployment rate was 13.1%, and 21.10% in 2010. On the average, there has been an upward trend (CBN, 2005, 2006, 2009; Nigerian Bureau of Statistics, 2010).
Poverty reduction has been a major goal of various governments. This is evidenced by the fact that various governments have introduced different programs to reduce poverty levels. Examples are Nigerian Directorate of Employment (NDE) introduced in 1989 and the National Poverty Eradication Programme (NAPEP) introduced in 2001. Per capita income is the major index for measuring poverty level. Per capita income in Nigeria has been increasing steadily from year 2000 when it was N39,657 to year 2010 when it reached N71,131 (IMF, 2011). This increase in per capital income has not led to an increase in the standard of living of the citizens because of the increase in the cost of goods and services.
The rising profile of Nigeria’s indebtedness is a sour point in the public finance management and speaks volumes of the fiscal discipline of political actors’ attitude to the sovereignty of Nigeria. According to Nwankwo (2010), Nigeria debt profile was US$32.5 billion by September 2010, that is, N5,241,667 million by September 2010. In year 2000, the total outstanding debt of Nigeria was N3,995,638 million. There continued to be an upward trend until in 2006 when it came down to N3,177,409 million because of debt cancelation agreement between Nigeria and Paris Club (Okwo, 2010). Thereafter, it started rising again and reached N5,241,667 million in 2010. The expenditure pattern of Nigeria has been on the increase. In 2000, the total expenditure was N701,059 million. It has increased steadily, and in 2010, it was N4,199,429 million.
Generally, increase in expenditure should lead to reduced unemployment rate but in Nigeria, the reverse is the case—As total expenditure increases, rate of unemployment increases. This is because a greater percentage of the total expenditure is channeled to recurrent expenditure, and the proportion is worsening. In 2000, the percentage of the total expenditure spent on recurrent was 66% and has increased to 79% in 2010. The implication is that unemployment rate soars because less percentage of the total expenditure is spent on capital project which creates job in an economy.
One of the major issues raised against Nigeria’s 2012 budget was the high rate of recurrent expenditure. Based on the budget, government proposed spending most of its money on running the administration rather than in the badly needed infrastructure projects to create jobs and boost growth in the continent’s second largest economy (Olajide & Adekoya, 2012). This article aims at determining the extent to which Nigeria’s fiscal policy has affected the economy with emphasis on the impact of various components of public expenditure on the economy.
Theoretical Framework and Literature Review
Various researchers have written on different aspects of fiscal policy especially as it relates and affects the macroeconomics of the economy. Fiscal policy is defined as the means by which a government adjusts its levels of spending to monitor and influence a nation’s economy (Reem, 2009). The policy is used along with monetary policy in different combinations to direct a country’s goals. According to Reem (2009), fiscal policy is based on the theories of British economist John Maynard Keynes whose theory basically states that governments can influence macroeconomic productivity levels by increasing or decreasing tax levels and public spending. This influence, in turn, curbs inflation, increases employment, and maintains a healthy value of money. Various researchers have written on different aspects of fiscal policy especially as it relates to macroeconomic productivity levels.
The studies of the effect of public expenditure on the economy has shown a positive relationship according to Ram (1986); Barro (1991); Easterly and Rebelo (1993); Otani and Villanueva (1990) Komain and Brahmasrene (2007); Ranjan and Sharma (2008); Cooray (2009); Wu, Tang, and Lin (2010); and Nworji, Okwu, Obiwuru, and Nworji (2012) while others such as Abu-Bader and Abu-Qarn (2003), and Laudau (1986) found negative relationship. However, Kormendi and Meguire (1995) could not find any relationship.
Adefeso and Mobalaji (2010) wrote on the fiscal-monetary policy and economic growth in Nigeria. Their major objective was to re-estimate and re-examine the relative effectiveness of fiscal and monetary policies on economic growth in Nigeria using annual data from 1970 to 2007. The error correction mechanism and co-integration technique were used to analyze the data and draw policy inferences. Their result showed that the effect of monetary policy is much stronger than fiscal policy. They suggested that there should be more emphasis and reliance on monetary policy for the purpose of economic stabilization in Nigeria.
In the same vein, Olawunmi and Ayinla (2007) examined the contribution of fiscal policy in the achievement of sustainable economic growth in Nigeria using slow growth model estimated with the use of ordinary least square (OLS) method. It was found that fiscal policy has not been effective in the area of promoting sustainable economic growth in Nigeria. They, however, stated that factors such as wasteful spending, poor policy implementation, and lack of feedback mechanism for implemented policy evident in Nigeria, which are indeed capable of hampering the effectiveness of fiscal policy have made it impossible to come up with such a conclusion. Victor and Marcos (2011) investigated economic, political, and institutional constraints to fiscal policy implementation in sub-Saharan Africa. It was found that planned fiscal adjustments or expansions are less likely to be implemented. The larger they are, the more inaccurate the growth forecasts they are based on. The finding supports ongoing efforts in the region to improve the quality and timeliness of economic data, enhance forecasting capacity, adopt realistic fiscal plans, and strengthen governance, budgetary institutions, and public financial management procedures.
Ogbole, Amadi, and Essi (2011) wrote on fiscal policy and its impact on economic growth in Nigeria (1970-2006). The study involves comparative analysis of the impact of fiscal policy on economic growth in Nigeria during regulation and deregulation periods. Econometric analysis of time series data from Central Bank of Nigeria was conducted. Results showed that there is difference in the effectiveness of fiscal policy in stimulating economic growth during and after regulation period. Appropriate policy mix, prudent public spending, setting of achievable fiscal policy targets, and diversification of the nation’s economic base, among others, were recommended.
In the same vein but covering a shorter period, Adeoye (2006) analyzed the impact of fiscal policy on economic growth in Nigeria in 1970 to 2002. The finding shows that public investment negatively affects output growth implying that public expenditure has a crowding out effect on private investment.
Chuku (2010) used quarterly data to explore the monetary and fiscal policy interactions in Nigeria between 1970 and 2008. The article examines the nature of fiscal policies in Nigeria using vector auto-regression (VAR) model. The evidence indicates that monetary and fiscal policies in Nigeria have interacted in a counteractive manner for most of the sample period (1980-1994), while at other periods, no symmetric pattern of interaction between the two policy variables was observed.
Huang and Padilla (2002) wrote on fiscal policy and implementation of the Walsh Contract for Central Bankers. They developed a simple macroeconomic model where the time inconsistency of optimal monetary policy is due to tax distortions. They concluded that implementing the optimal policy mix requires either that central bank enjoy primacy over the fiscal authority or that fiscal policy be also delegated to an independent authority.
Omitogun and Ayinla (2007) examined empirically the contribution of fiscal policy in the achievement of sustainable economic growth in Nigeria. They used Solow growth model estimated with the use of OLS method and found out that fiscal policy has not been effective in the area of promoting sustainable economic growth in Nigeria. They suggested that Nigerian government should put a stop to the incessant unproductive foreign borrowing, wasteful spending and uncontrolled money supply, and embark on specific policies aimed at achieving increased and sustainable productivity in all sectors of the economy.
Amin (1999) analyzed the relationship between public and private investment stressing the crowding in or crowding out of private investment by public expenditures in Cameroon. Based on secondary data from the public sector, the results of a growth model show that the relevant factors have positive effects on growth, while those of the investment model show the crowding in of infrastructures and social sector. The study concluded by recommending the relocation of more resources to productive sectors and increasing and sustaining of spending on those productive sectors or those components of public expenditures that crowd in the private sector.
Njoku and Ihugba (2011) looked at the relationship between unemployment and growth in Nigeria (1985-2009). One major finding of the study is that the economy grew by 55.5% between 1991 and 2006 and the population increased by 36.4%. This should ordinarily have resulted to a decrease in the rate of unemployment but rather unemployment increased by 74.8%.
Davis, Ossowski, and Fedelino (2003) looked at fiscal policy formulation and implementation in oil-producing countries. Their study showed that resource-dependent economies tend to grow more slowly than non-resource-dependent ones at comparable levels of development. Poverty is still widespread in a number of oil-producing countries. They concluded that a pattern of fluctuating fiscal expenditures associated with oil volatility has entailed significant economic and social costs for a number of oil producers. Auerbach (2009) suggested that for fiscal discretionary policy to be practiced on a large scale, attention must be paid to policy design.
Cardoso and Domencho (2010) examined the role of structural reform. He noted that financial markets have been putting more emphasis in government capacities for achieving fiscal consolidation and also the ability of their economies to sustain high gross domestic product (GDP) growth rates in the medium term without the support of the fiscal and monetary policies. One major observation of the study is that those financial markets might actually bring forward the benefit of reforms through the assessment of country-risk premiums. Hilderbrand (2013) stressed the value and interaction of both fiscal austerity and structural reforms. But the perception remains that structural reform process does not yield immediate benefits but fiscal austerity does. If this is the case, then, the argument that structural reforms take too long to reap its benefits is overstated
Method
To gain better insight into the contribution of government fiscal policy to Nigeria’s economic growth, we examine the growth effects of public income and spending via budget surplus or deficit. To motivate our discussion initially, we examined the contribution of public income and expenditure to economic growth in Nigeria. More so, we tried to disaggregate the public expenditures into the different components and examined each component growth rates and the share of each component in total expenditure. We then find how each component correlates with economic growth (GDP).
We simply used descriptive statistics to show contribution of government fiscal policy to economic growth to ascertain and explain growth rates, and an OLS in a multiple form to ascertain the relationship between economic growth and government expenditure components after ensuring data stationarity.
In this study, annual data, spanning a period of 49 years, from 1961 to 2010 were used. Data were obtained from the Central Bank of Nigeria statistical bulletin. To measure the relationship between GDP and other explanatory variables, we adopt a generic regression equation specified in the following form:

where Yt = GDP, GOVC = Government consumption.
where Yt = GDP, Admint = Administration, SCS = Social and Community Services, Econs = Economic Services.
Expressing the relation in linear form using the variables in natural log to minimize the scale effect of numbers, we arrive at the following estimating equations:


where GA = General Administration expenditure, Def = Defense expenditure, Edu = Education expenditure, Health = Health expenditure, Agric = Agriculture expenditure, Const = Construction expenditure, Trans&Com = Transport and Communication.
Description of Variables
GDP is the naira value of goods and services produced in Nigeria during a time period irrespective of the nationality of the individuals who produced the goods or services. It is calculated without making deductions for depreciations. GDP at current basic prices is simply nominal GDP equals GDP less indirect taxes net of subsidies (CBN Statistical Bulletin, 2007). The GDP is a widely acknowledged measure of economic growth and is used in this article as a proxy for Nigerian economic growth.
The size of government (GOVC): We use government consumption measured by recurrent expenditure and capital expenditure for the size of the government. This may have either a negative or positive impact depending on the magnitude of the negative effects caused by the financing effects of this consumption. Empirical studies (Blejer & Khan, 1984; Ekpo, 1994; Gramlich, 1994; Kelly, 1997 as cited by Aloysius, 1998) have shown that public spending on such components as infrastructure is complementary with private investment. Government expenditures would have both direct and indirect effects on long-run growth. Direct capital spending would improve physical infrastructure, while spending on education and health contribute to human capital formation, thus increasing productive capacity.
The subscript t represents the time period whereas Logn indicates natural log - the parameters to be estimated and ut is an error term. The variables are transformed into logarithmic form to minimize the scale effect of numbers.
Data testing procedure
Stationary properties of the time series data before the first stage of the model were estimated. Therefore, stationary statuses of the variables were investigated by the Augmented Dickey Fuller (ADF) unit root test to guard against spurious regression results.
The expected signs of social and community services expenditure component as well as economic services expenditure component coefficients are positive while that of administration are expected to be negative. The data are time series with an annual observation and covers the period 1961 to 2010. The bounds testing procedure is the OLS. The test is done in two stages. First, we test for data stationary. Second, we test for relationships and magnitude.
Discussion of Findings
Given total public expenditure and revenue composition in Nigeria, government expenditures have tended to increase with government revenue, with expenditures peaking faster than revenue and crowding out revenue (Figure 1).
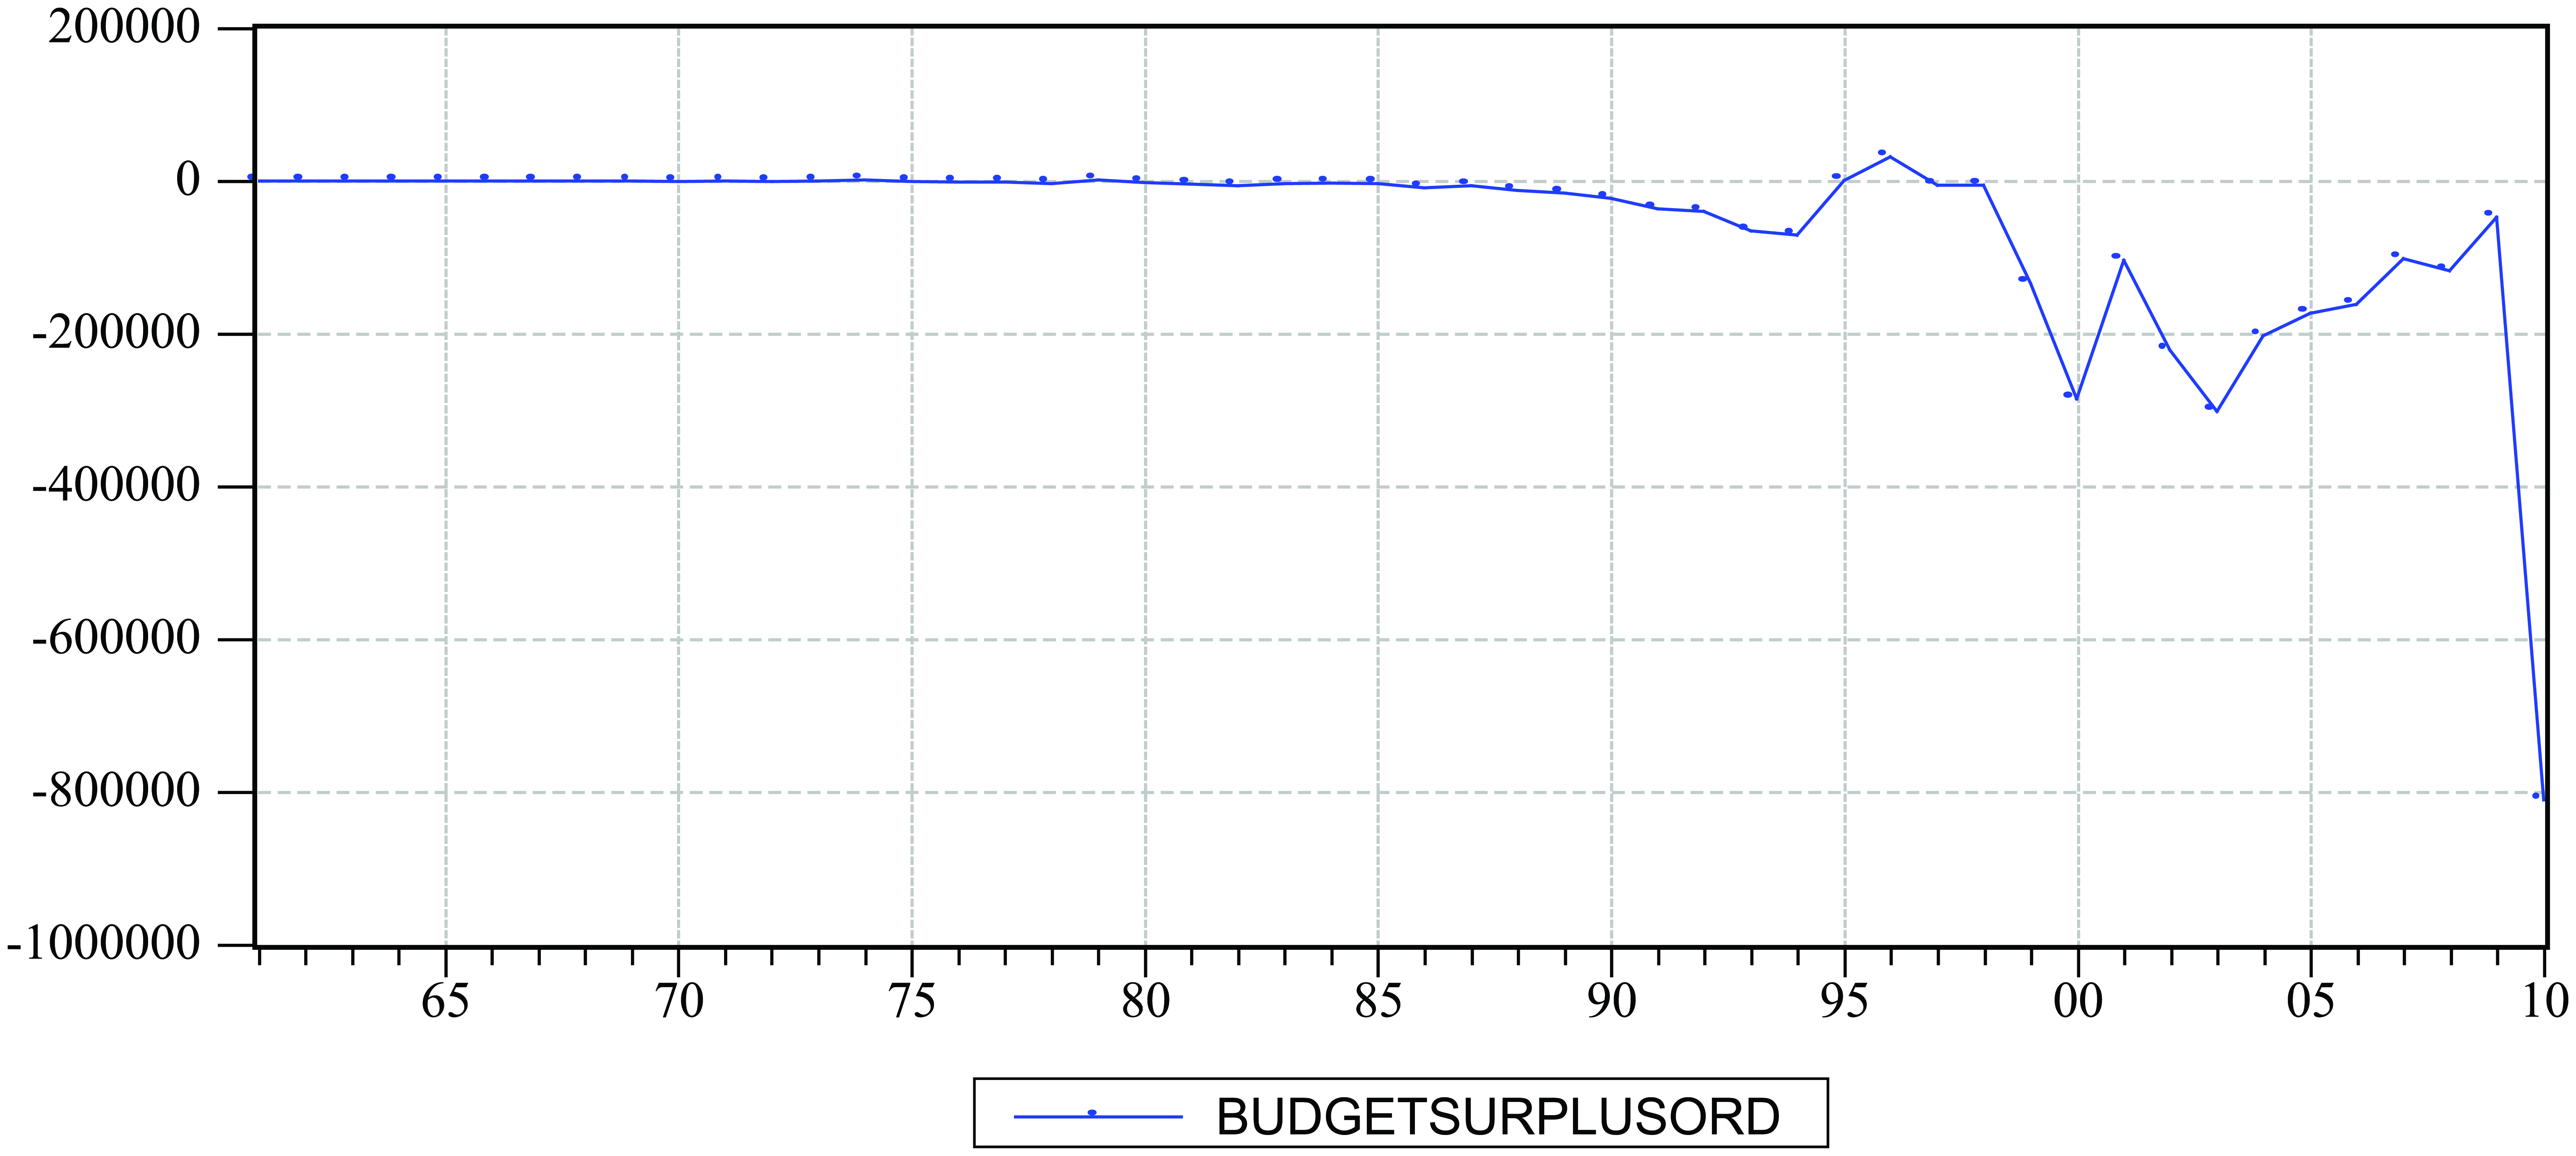
Nigeria government overall budget surplus (+) or deficit (−) in billion naira.
Public expenditures have been increasing. The trend shows that the country started in 1961 with a surplus budget until 1970 when it recorded its first deficit of N455.10 billion. Afterward, the country recorded a surplus of N171.60 billion, N166.10 billion, N1,796.40 billion, N1,461.70 billion, N1,000.00 billion, and N32,049.40 billion in years 1971, 1973, 1974, 1979, 1995, and 1996, respectively. The rest of the period was marked with deficit financing as the years progressed and reached its peak at the end of the period, year 2010, with N1,105,439.78 billion deficit.
Government’s Expenditure
The size of the government sector in the economy could be measured in terms of employment, economic activities, or expenditure (Aloysius, 1998). Usually, the importance of the public sector is in the expenditures (Aloysius, 1998). Total public expenditure in Nigeria can be classified into four main categories:
Administration (General administration, Defense, Internal Security, National Assembly).
Social and Community Services (Education, Health, and other social and community services).
Economic Services (Agriculture, Construction, Transport and Communication, and other economic services).
Transfers (Public debt servicing, Pensions and gratuities, Contingencies/subventions, and Other/Other cost and freight [CFR] charges).
Nigeria’s expenditures are actually in two main accounts: current and investment accounts. Usually, investment, development, or capital spending is separated from public consumption or current budget with revenues earmarked for consumption expenditures, and any surplus may be allocated to the investment budget. Because of demands and pressures on the government, it has not been easy to apply this system of budgeting.
Given the growth rates and shares of different components of public expenditures since the 1960s, there have been two major periods of economic performance in Nigeria pre- and post-structural adjustment program (SAP) in 1986. The Nigerian Government in June 1986 adopted a comprehensive SAP that signaled a radical departure from previous reform efforts. It emphasized reliance on market forces and the private sector in dealing with the fundamental problems of the economy. The objectives of the SAP were, among others, to
restructure and diversify the productive base of the economy so as to reduce dependency on the oil sector and imports,
achieve fiscal and balance of payments viability over the medium term, and
promote non-inflationary economic growth (see Table 1).
Growth Rates of Different Government Expenditure in Percentages Pre-SAP.
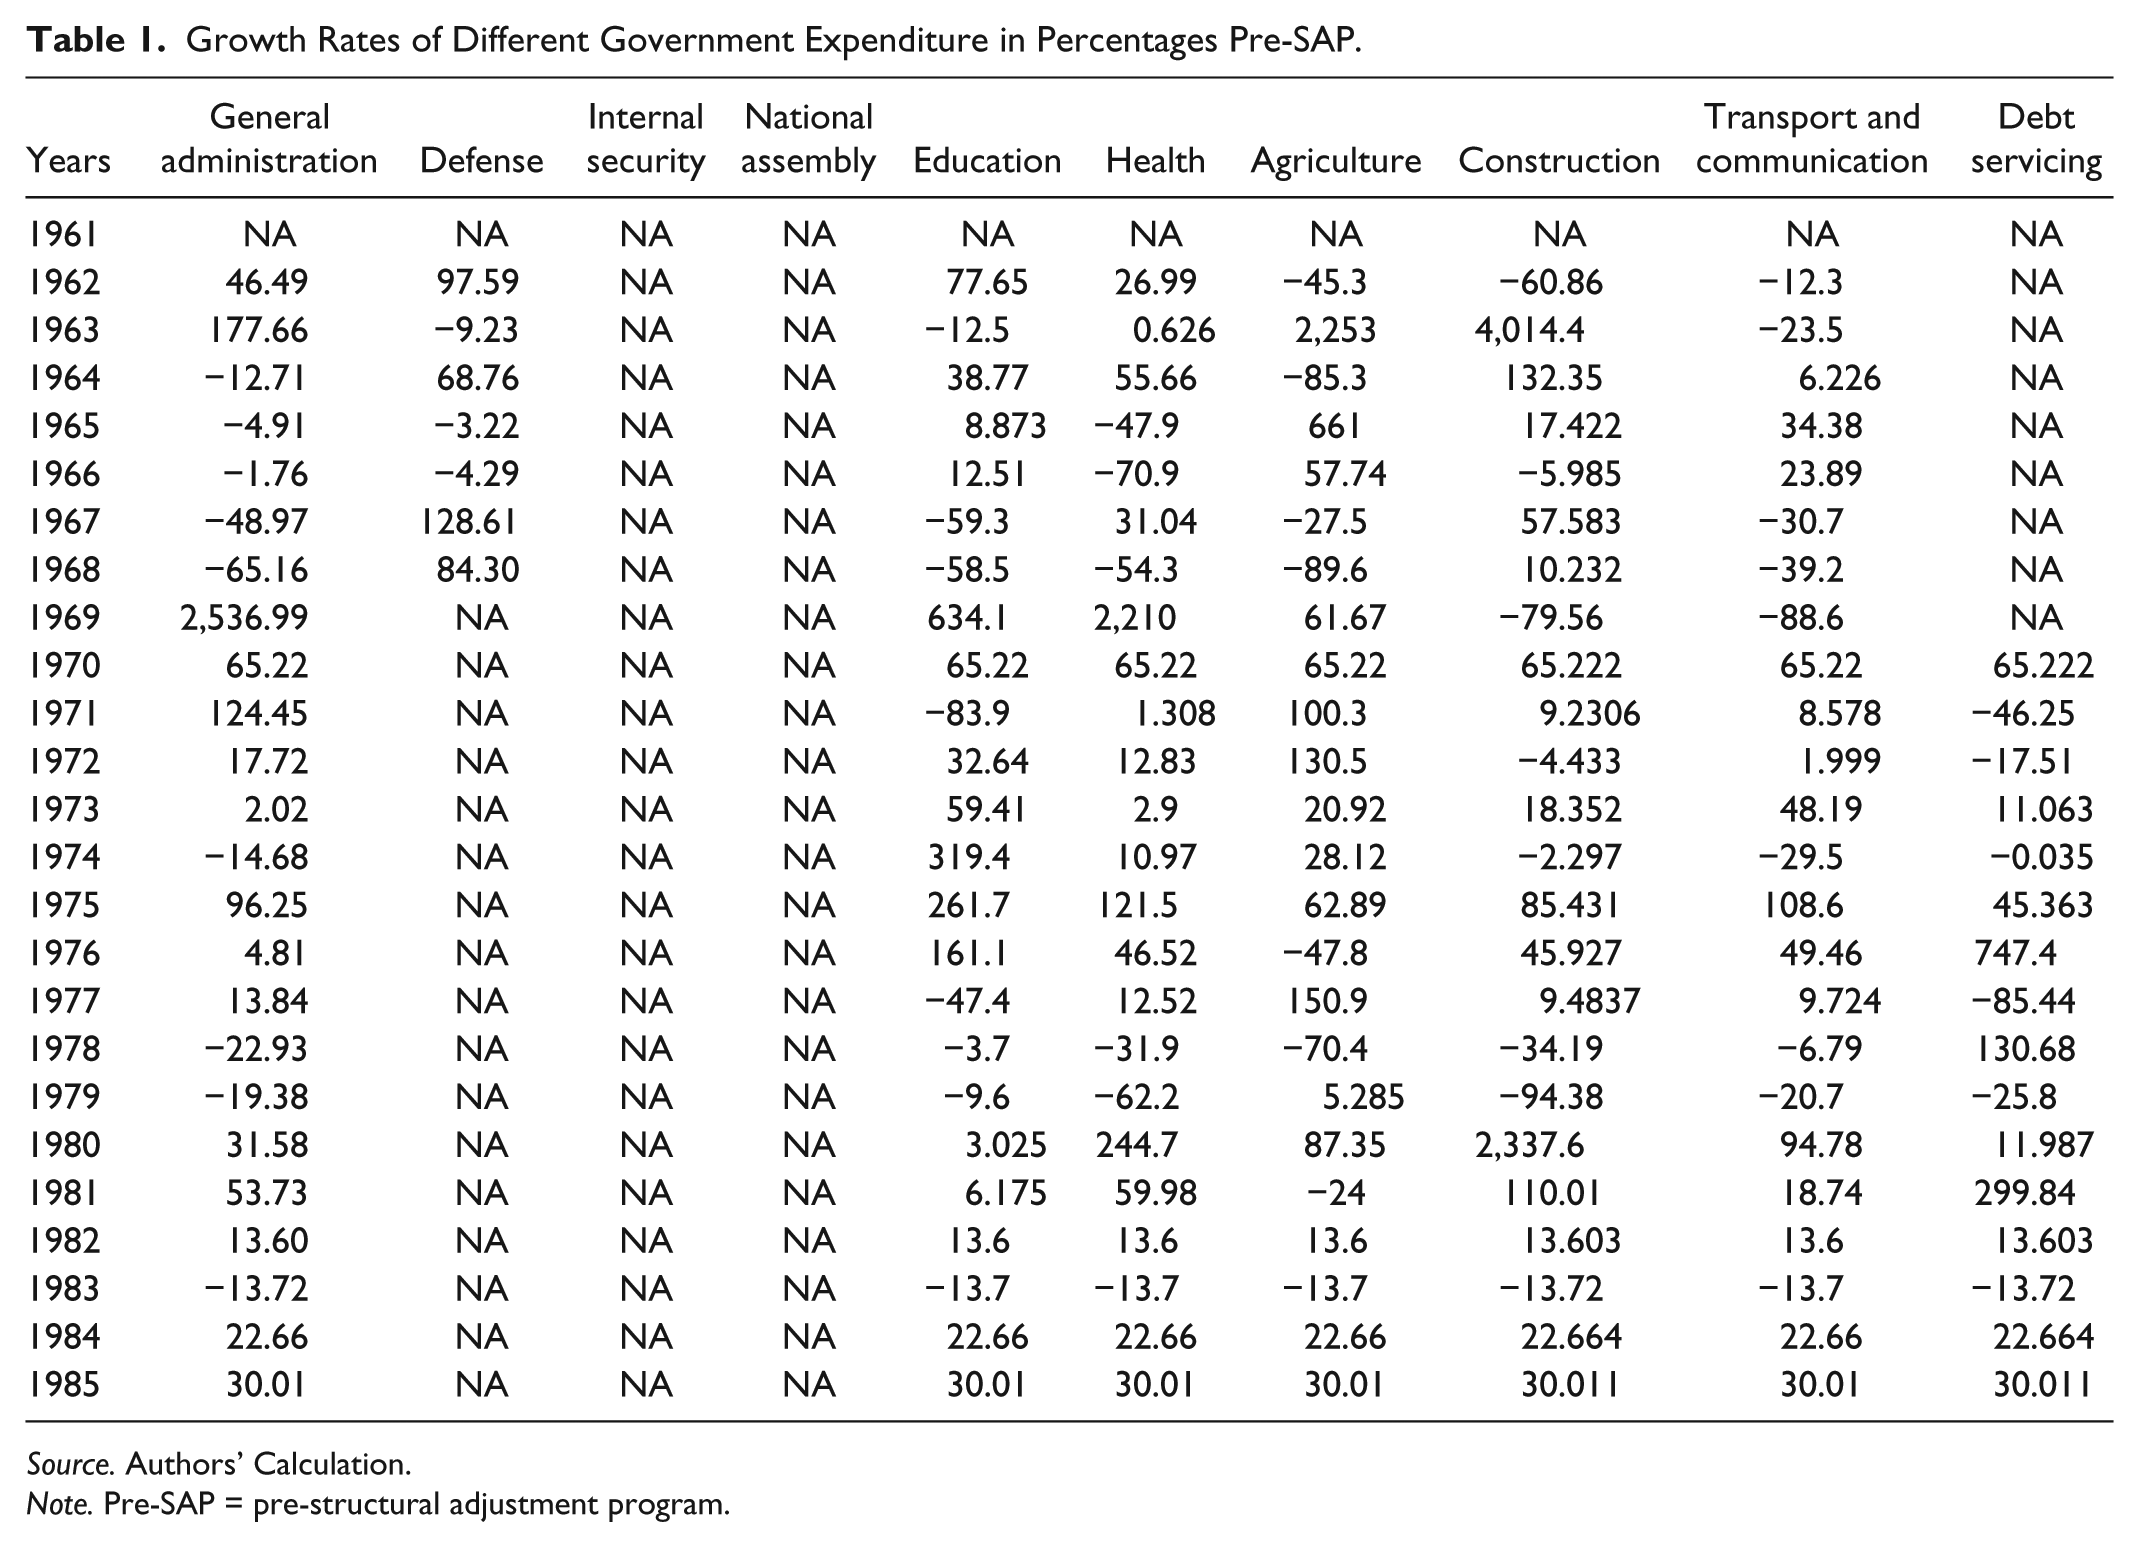
Source. Authors’ Calculation.
Note. Pre-SAP = pre-structural adjustment program.
The period before the introduction of SAP witnessed varying degrees of percentage increases and decreases. Internal security and National Assembly did not have budgetary allocation during this period, while there was no public debt to service until 1970. In 1962, the percentage increases in agriculture, construction, transport, and communication recorded sharp decreases of −45.3%, −60.86%, and −12.3%, respectively.
General administration expenditure after rising to 177.66% in 1963 recorded steady negative growth rates until 1968 while recording an increase of 2,536.99% in 1969. The expenditure for general administration ended the pre-SAP period on a positive growth rate of 30.01%. Defense had the highest growth rate of 128.61% in 1967 while not having allocation data for the rest of the period. Also in 1969, education and health recorded outstanding 634.1% and 22.10% growth rates in budgetary allocations.
Expenditure on agriculture received the highest expenditure of 2,253% in 1963 alongside construction, which rose to an all-time high of 4,014.4% in 1963. Transport and communication received the highest budgetary allocation of 108.6% in 1975 while the highest expenditure on debt servicing was recorded in 1976 at 747.4%.
In 1983, in a bid to reverse the worsening economic fortunes in terms of declining growth, increasing unemployment, galloping inflation, high incidence of poverty, worsening balance of payment conditions, debilitating debt burden, and increasing unsustainable fiscal deficits, among others, government embarked on austerity measures in 1982 by slashing government expenditure across components. This resulted in a decline of expenditure across the government expenditure components by 13.65% approximately in 1982 and 1983 (see Table 2).
Growth Rates of Different Government Expenditure in Percentages Post-SAP.
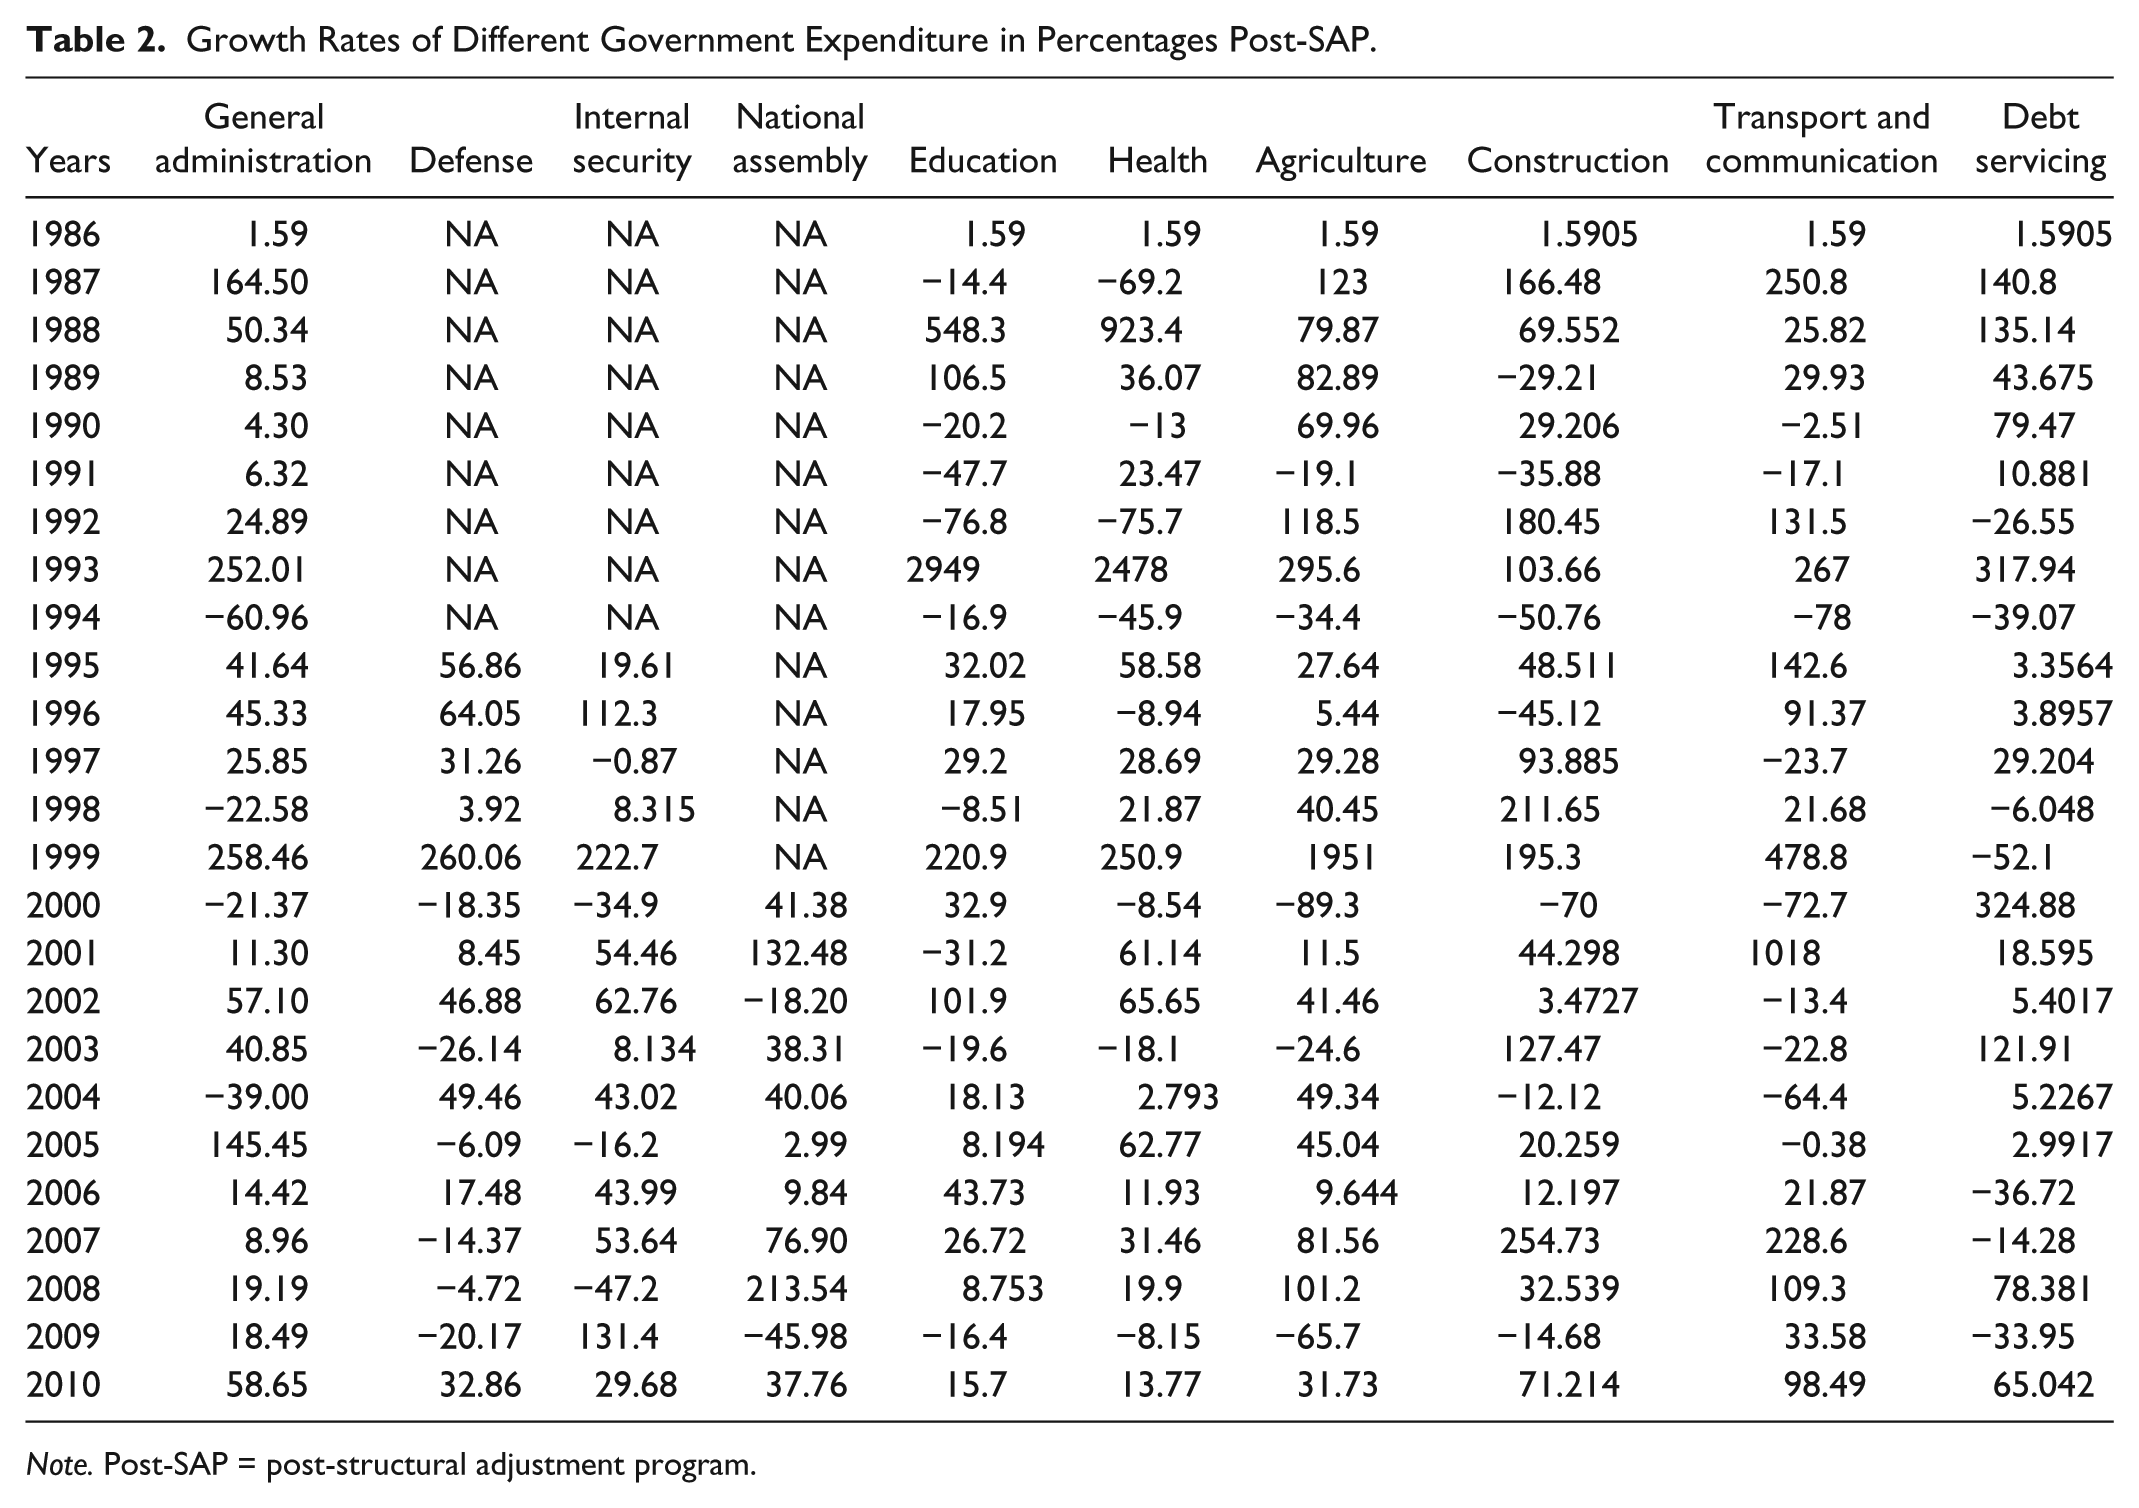
Note. Post-SAP = post-structural adjustment program.
Arising from the minimal impacts of the 1982 austerity measures, an extensive SAP was put in place in 1986 with emphasis on expenditure reducing and expenditure switching policies as well as using the private sector as the engine of growth of the economy via commercialization and privatization of government-owned enterprises. With the introduction of SAP, government expenditure growth rate fell from 30.01% in 1985 to 1.59% in 1986. In 1995, defense and internal security came on stream on government expenditure, while national assembly came on stream with the return to civilian rule in 1999. The rest of the period recorded varying degree of percentage growth rates as well as suffering from negative growth rates for different components.
In 2009, during the peak of the world financial crises, defense, national assembly, health, education, agriculture, transfers, and construction suffered from negative expenditure growth rates while the end of the period ended in positive growth rates for the different components.
We disaggregated the basic government expenditure components and examined the share of different components in total government expenditure (Table 3).
Share of Different Components in Total expenditure.

Source. Authors’ Calculation.
A look at the evolution of the Nigeria governments’ share of individual component expenditure on total expenditure revealed some interesting features. First, from the 1960s, transport and communication expenditure has the highest share of 30.87% in 1961 but decreased steadily afterward while picking up in 1965 to 20.49% to 23.52% in 1966 but decreased and dropped to below 1% from 1969 until 1993 when it increased to 1.06% while closing the period at 5.17% in 2010. This evidenced the high cost of doing business in the country even with the introduction of the global system for mobile communication (GSM) in 2001. With the outbreak of the Nigerian civil war in 1966, defense received a boost in budgetary allocation with the highest share of 31.96% in 1968 as all government effort was shifted to the execution of the war while the community, social, and economic sectors suffered negatively.
In 1971, general administration received the highest share of 30.43% while education, health, agriculture, construction, transport, and communication received meager 0.39%, 1.26%, 0.38%, 1.56%, and 0.52%, respectively.
In 1969, public debt servicing received the highest share of 16.51%, dropped to 1.82% in 1975, increased to 11.71% in 1977, dropped to 1.71% in 1980, picked up in 1981, and rose steadily to 10.05% in 1986, 17.84% in 1987, 33.29% in 1988, 39.67% in 1991, and 42.4% in 1993, the highest during the period. However, in the year 2003, debt servicing received 35.70% and dropped to 7.76% in 2009 while ending the period at 12.03% in 2010.
The implication of the above was that public debt servicing on the average constituted a good part of Nigerian government expenditure since 1969 with so little to show for the debts while the health, education, agriculture, and economic sectors that actually grow the economy were left to suffer.
Interactions between the recurrent expenditure and capital expenditure as a percentage of total expenditure of the Nigerian government are as depicted in Figure 2 below with the recurrent expenditures taking the lead averagely and reaching their peak in 1971 at 82.59% and investment/capital expenditures reaching their peak in 1980 at 67.89%.

Graphical representation of share of different components in total expenditure.
Second, investment expenditures were much lower than current expenditures evidencing the poor growth in the country’s economy. This is because investment expenditures are supposed to provide the infrastructural facilities for trade, manufacturing, and human capital development. According to some empirical studies, public spending on transport and communication is positive, given the case of crowding in of public expenditure on transport and communication, which is an important component at the smooth functioning of the private sector (see Figure 3).

Interactions between government recurrent and capital expenditures.
Third, the government has been reluctant to curb recurrent expenditures or increase allocation to the investment/capital expenditure as recurrent expenditure between year 2000 and 2010 constituted above 55% of government total expenditure.
Further Analysis
Unit root test result
To guard against spurious regression and correlation result, this study took caution by checking the properties of the variables via the ADF test. The result is presented below:
Without Constant and Trend

The hypothesis is as follows:

Decision rule:
If t* > ADF critical value, ==> do not reject null hypothesis, that is, unit root exists.
If t* < ADF critical value, ==> reject null hypothesis, that is, unit root does not exist (see Table 4).
ADF Unit Root Test Result.

Source. Author’s Eview Output.
Note. ADF = Augmented Dickey Fuller; GDP = Gross Domestic Product.
A non-stationary time series can be converted into a stationary time series by differencing (Johannes, Njong, & Cletus, 2011). The above table reports that none of the time series data of general administration, defense, education, health, agriculture, construction, transport, and communication were stationary at level as their t* > ADF statistics indicating unit root and hence the application of the differencing technique. During the differencing, general administration, agriculture, construction, education, health, transport, and communication variables became stationary at first difference as their t* < ADF statistics while defense and GDP became stationary at second difference, and hence the generation of first and second difference data for the analysis. Given that the ADF test statistic of the variables at first difference and second differences < critical values at 1%, we conclude that there is no unit root with the time series. Therefore, the time series are stationary (see Table 5).
Estimation of

Note. DGDP = differenced data for gross domestic product.
Source. Authors’ Eviews Output, 2013.
OLS results
As expected, expenditure on defense has a negative relationship on economic growth in Nigeria, while administration expenditure though positive does not have a significant effect on economic growth. The R2 and adjusted R2 are quite low (see Tables 6 and 7 for Durbin–Watson suggesting autocorrelation).
Estimating Equation 4

Note. DGDP = differenced data for gross domestic product; DEDUCATION = differenced data for education expenditure; DHEALTH = differenced data for health education.
Source. Authors’ Eviews Output, 2013.
Estimating Equation 5

Note. DGDP = differenced data for gross domestic product; DTRANSANDCOM = differenced data for transport and communication expenditure; CONSTRUCTION = construction data expenditure; DAGRICULTURE = differenced data for agriculture expenditure.
Source. Authors’ Eviews Output, 2013.
In the above table, education has a positive relationship with economic growth (GDP) as expected while health has a negative relationship.
As expected, all the economic services expenditure has positive relationships with economic growth suggesting that a growth in budgetary allocations to this sector will certainly drive economic growth. The result strongly suggests that such government expenditures are supposed to provide an enabling environment for economic growth and strengthen economic growth.
Concluding Remarks
Public expenditures have been increasing in Nigeria. The trend shows that the country started in 1961 with a surplus budget until 1970 when it recorded its first deficit of N455.10 billion, which reached its peak at the end of the period, year 2010, with N1,105,439.78 billion.
Studies that relate government spending to growth have not clearly brought out the nature and type of government expenditures. Furthermore, the studies have been on highly aggregated data mainly cross-country or cross-sectional studies. In this study, we attempted to differentiate the data in a single country’s public expenditures. This study identifies those components of public expenditure that could be protected and sustained. In fact, our results show that public expenditures on economic services (agriculture, construction, transport, and communication) have enormous returns to economic stability and growth. Our results suggest that these expenditures crowd in private investment. Hence, there is some evidence of positive correlation between government expenditure on economic services and economic growth. An increase in budgetary allocation to economic services will lead to an enhancement in economic stability. Therefore, in public spending, it is important to note that the effectiveness of the private sector depends on the stability and predictability of the public incentive framework, which promotes or crowds in private investment. Productive government spending or the quality of government spending is significant in enhancing the efficiency and productivity of the private sector, as the level and quality of public expenditures seems to determine the rate of growth.
Hence, in setting the targets for government expenditures, the growth objective should be seriously considered. Capital expenditure cuts may conflict with the growth objective, especially when targets are set without properly examining the composition of the total expenditure. Government should not find it difficult to cut its recurrent expenditures especially national assembly and internal security, and reduce borrowing as to reduce transfers on public debt servicing expenditures. There appears to be a lot of padding of government expenditures with acronyms such as other social and community services, other economic services, and other CFR charges. These should be disallowed or duly classified into significant expenditure components. More so, the composition of public expenditures could be carefully restructured and scrutinized so as to enhance growth and promote an enabling environment for private sector development.
Footnotes
Declaration of Conflicting Interests
The author(s) declared no potential conflicts of interest with respect to the research, authorship, and/or publication of this article.
Funding
The author(s) received no financial support for the research and/or authorship of this article.