
Abstract
There are limited data from long-term prospective studies on the association between television (TV) viewing and obesity. We investigated this association between TV viewing and body mass index (BMI) and waist circumference (WST) over 15 years on 3,269 participants from the Coronary Artery Risk Development in Young Adults (CARDIA) study. We used cross-lagged panel models at exam Years 5, 10, 15, and 20 over 15 years to assess the association between TV viewing and obesity. The cross-lagged effects of TV viewing on anthropometry were significant from exam Year 5 to Year 10 (B = 0.034 for BMI and 0.036 for WST). However, the cross-lagged effects of TV viewing at Years 10 and 15 on obesity at Years 15 and 20, respectively, were nonsignificant. The findings indicate that higher levels of TV viewing predicted higher BMI and WC in young adulthood, but this association was not observed as individuals aged over the following decade.
Introduction
Obesity remains a significant public health threat and is linked to numerous adverse chronic conditions, including hypertension, hypercholesterolemia, diabetes, and coronary heart disease (Bogers et al., 2007; Field et al., 2001; Haarbo, Hassager, Riis, & Christiansen, 1989; Haarbo, Hassager, Schlemmer, & Christiansen, 1990; Howard et al., 2008; Wilson, D’Agostino, Sullivan, Parise, & Kannel, 2002). The prevalence of adult obesity in the United States has consistently increased (U.S. Department of Health and Human Services, 2012). Emerging data suggest that prolonged television (TV) watching is a risk factor for weight gain and obesity among different populations (Bowman, 2006; Cleland, Schmidt, Dwyer, & Venn, 2008; Dietz & Gortmaker, 1985; F. B. Hu, Li, Colditz, Willett, & Manson, 2003; Jakes et al., 2003; Vioque, Torres, & Quiles, 2000). TV viewing is one of the most prevalent leisure-time sedentary activity in the United States, in which people spend, on average, 5 hr per day watching TV (Harrill, 2004; The Nielson Company, 2010). The theoretical mechanisms include reduced overall energy expenditure due to lower energy required for TV viewing and increased overall energy intake due to the influence of food advertising and food references in TV programs (Dietz & Gortmaker, 1985). Indeed, studies have shown a positive association between TV viewing and obesity in adults cross-sectionally (Bowman, 2006; Dietz & Gortmaker, 1985; Fitzgerald, Kriska, Pereira, & de Courten, 1997; Vioque et al., 2000) and prospectively (Ching et al., 1996; F. B. Hu et al., 2003; Parsons, Manor, & Power, 2008; Tucker & Tucker, 2011; Viner & Cole, 2005). However, most of the prospective studies of TV viewing and obesity in adults were of short duration, examined frequency rather than daily amount, and did not account for how the association may be moderated by an individual’s body weight. In addition, no research has examined the mutual or reciprocal influence of TV viewing and body mass index (BMI) and waist circumference (WST).
To address these gaps in the literature, we assessed duration of TV viewing per day with BMI and WST in young adults 15 years using cross-lagged panel models, which include the reciprocal association between TV viewing and these anthropometric measures. In addition, cross-lagged panel models with multiple repeated measures allowed us to observe whether the association between TV viewing and obesity was consistent over time.
Method
Participants—Coronary Artery Risk Development in Young Adults (CARDIA)
The CARDIA study, which began in 1985-1986, is a prospective study designed to investigate the development and risk factors of cardiovascular disease in young adults. At baseline, 5,115 Black and White adults who were between the ages of 18 and 30 years were recruited (Friedman et al., 1988). The same participants were followed up during 1987/1988 (Year 2), 1990/1991 (Year 5), 1992/1993 (Year 7), 1995/1996 (Year 10), 2000/2001 (Year 15), and 2005/2006 (Year 20). Because measurements of TV viewing were collected at Year 5, Year 10, Year 15, and Year 20, this study used data at these four follow-up examinations. Participants were excluded based on the following conditions: (a) pregnant women at any exam years; (b) medication use or history of hypertension, hypercholesterolemia, or diabetes at Year 5; and (c) missing data of covariates at Year 5. The analysis included 3,269 adults.
Measures
TV viewing
Number of daily TV viewing hours was assessed by a self-administered questionnaire asked at Years 5, 10, 15, and 20. Participants were asked, “On average, about how many hours per day do you watch television?” This was recorded to the nearest hour.
Anthropometry
Participants were standing and dressed in light clothing without shoes. Body weight was measured to the nearest 0.2 kg with a calibrated balance beam scale. Height was measured with a vertical ruler to the nearest 0.5 cm. BMI was calculated as weight in kilograms divided by height in meters squared. Waist was measured with a tape measure in duplicate to the nearest 0.5 cm around the minimal abdominal girth.
Covariates
The demographic and behavioral covariates included highest level of education completed, family income, alcohol use, and smoking status. The continuous physical activity score was measured by intensity level and the number of months spent in 13 different activities of heavy (≥5 metabolic equivalents [METS]) and moderate (3-4 METS) intensity during the past year (Sidney et al., 1991). Diet was assessed at Years 0, 7, and 20 using the CARDIA Diet History questionnaire (McDonald et al., 1991). A continuous dietary pattern score was assessed by types and amounts of food consumed over the past month. According to comparable nutrient characteristics and biological effects, foods were assigned into 46 groups which, in turn, were categorized as beneficial (Sijtsma et al., 2012). Each participant was assigned scores 0 to 4 for beneficial foods plus scores in reverse order 4 to 0 for adverse foods. The dietary pattern score was the sum of scores for the 46 food groups so the maximum dietary pattern score was 132. A higher dietary pattern score represented better diet quality (Sijtsma et al., 2012). Assessment of diet at Year 7 was a surrogate for Year 5 of this study. There are several reasons to support that diet at Year 7 is a more appropriate surrogate compared with diet at Year 0. The dietary pattern at Year 5 should be closer to Year 7 than Year 0. In addition, longitudinal trends in diet for the CARDIA study indicated similar dietary patterns by matching age group at exam Years 0, 7, and 20, especially from Year 7 to Year 20 (Sijtsma et al., 2012). Older people generally maintained higher diet quality compared with younger people over time.
Statistical Analyses
SAS version 9.2 was used to conduct a number of descriptive run Spearman correlation matrices. Specifically, chi-square test was used to assess the significance of bivariate associations for categorical outcomes. One-way ANOVA tests were used to compare subgroups on continuous outcomes. Wilcoxon signed rank sum tests were used to examine the difference between Year 20 and Year 5 on TV viewing, BMI, WST, and physical activity.
A cross-lagged panel model was specified to examine the prospective relationships between TV viewing and continuous values of BMI and WST over a total of four 5-year intervals (Figures 1 and 2). The cross-lagged panel model was assessed using structural equation modeling (SEM) in MPlus version 6.

A cross-lagged panel model showing the effects of duration of TV viewing on BMI.

A cross-lagged panel model showing the effects of duration of TV viewing on waist circumference.
For consistency with previous publications, we refer to Year 5 of CARDIA as baseline in the current manuscript. Our model adjusted for baseline values of a number of time-invariance variables at baseline (e.g., age, gender, race, education) and time-specific values of a number of time-varying variables (e.g., family income, smoking behavior) at each exam year. The model included lag-1 autoregressive effects (for both TV viewing and BMI), lag-1 cross-lagged effects from TV viewing to later obesity and obesity to later TV viewing, and adjustment for covariates. This model allowed us to examine each of the cross-lagged paths individually while adjusting for important covariates. Several goodness of fit measures were used in the SEM analyses to assess model fit. Comparative Fit Index (CFI) ≥ .95, Tucker–Lewis Index (TLI) ≥ .95, and root mean squared error of approximation (RMSEA) ≤ .06 are usually considered “good” fit (L. Hu & Bentler, 1999). Modification indices were used to identify a model with good fit to the data.
Results
Participant Characteristics
Table 1 shows the demographic and behavioral distribution of the 3,269 participants by TV viewing time at baseline (Year 5). At Year 5, mean age in the analysis sample was 29.9 ± 3.6 years. Younger people spent more time watching TV at baseline. People who watched more TV had lower diet scores (M = 59.7 for the ≥4 hr group; M = 72.8 for the 0 hr group) and physical activity scores (M = 389.4 for the ≥4 hr group; M = 428.9 for the 0-hr group). Males were more likely to spend more time watching TV compared with females (23% of males vs. 20.6% of females in the ≥4 hr group). Blacks spent more time viewing TV than Whites (35.9% of Blacks vs. 8.6% of Whites in the ≥4 hr group). Most participants (81.1%) completed some education beyond high school during the CARDIA study. People who had education beyond high school spent less time on TV viewing than those who had less education (40.8% of people who had less education vs. 17.4% of those who had further education than high school in the ≥4 hr group). People whose annual family income was ≥50,000 watched less TV than those whose family income was <50,000. People who smoked or drank alcohol ≥7 drinks/week were more likely to engage in TV viewing compared with those who never smoked or drank alcohol.
Demographic and Behavioral Distribution of Participants by TV Viewing Time at Baseline (Year 5).

M ± SD (all such values).
Results were tested by one-way ANOVA.
n (%; all such values).
Results were tested by χ2 test.
Means of TV Viewing, BMI, WST, and Physical Activity Score by Year
As Table 2 shows, TV viewing time decreased slightly (though not statistically significantly) over the 15-year span (M in hours ± SD =2.5 ± 2.2, 2.4 ± 2.0, 2.3 ± 1.9, and 2.4 ± 2.3 at Years 5, 10, 15, and 20, respectively). Physical activity also decreased over time. In contrast, BMI and WST increased from baseline to Year 20.
Means of TV Viewing, Body Mass Index, Waist Circumference, and Physical Activity Score by Year.
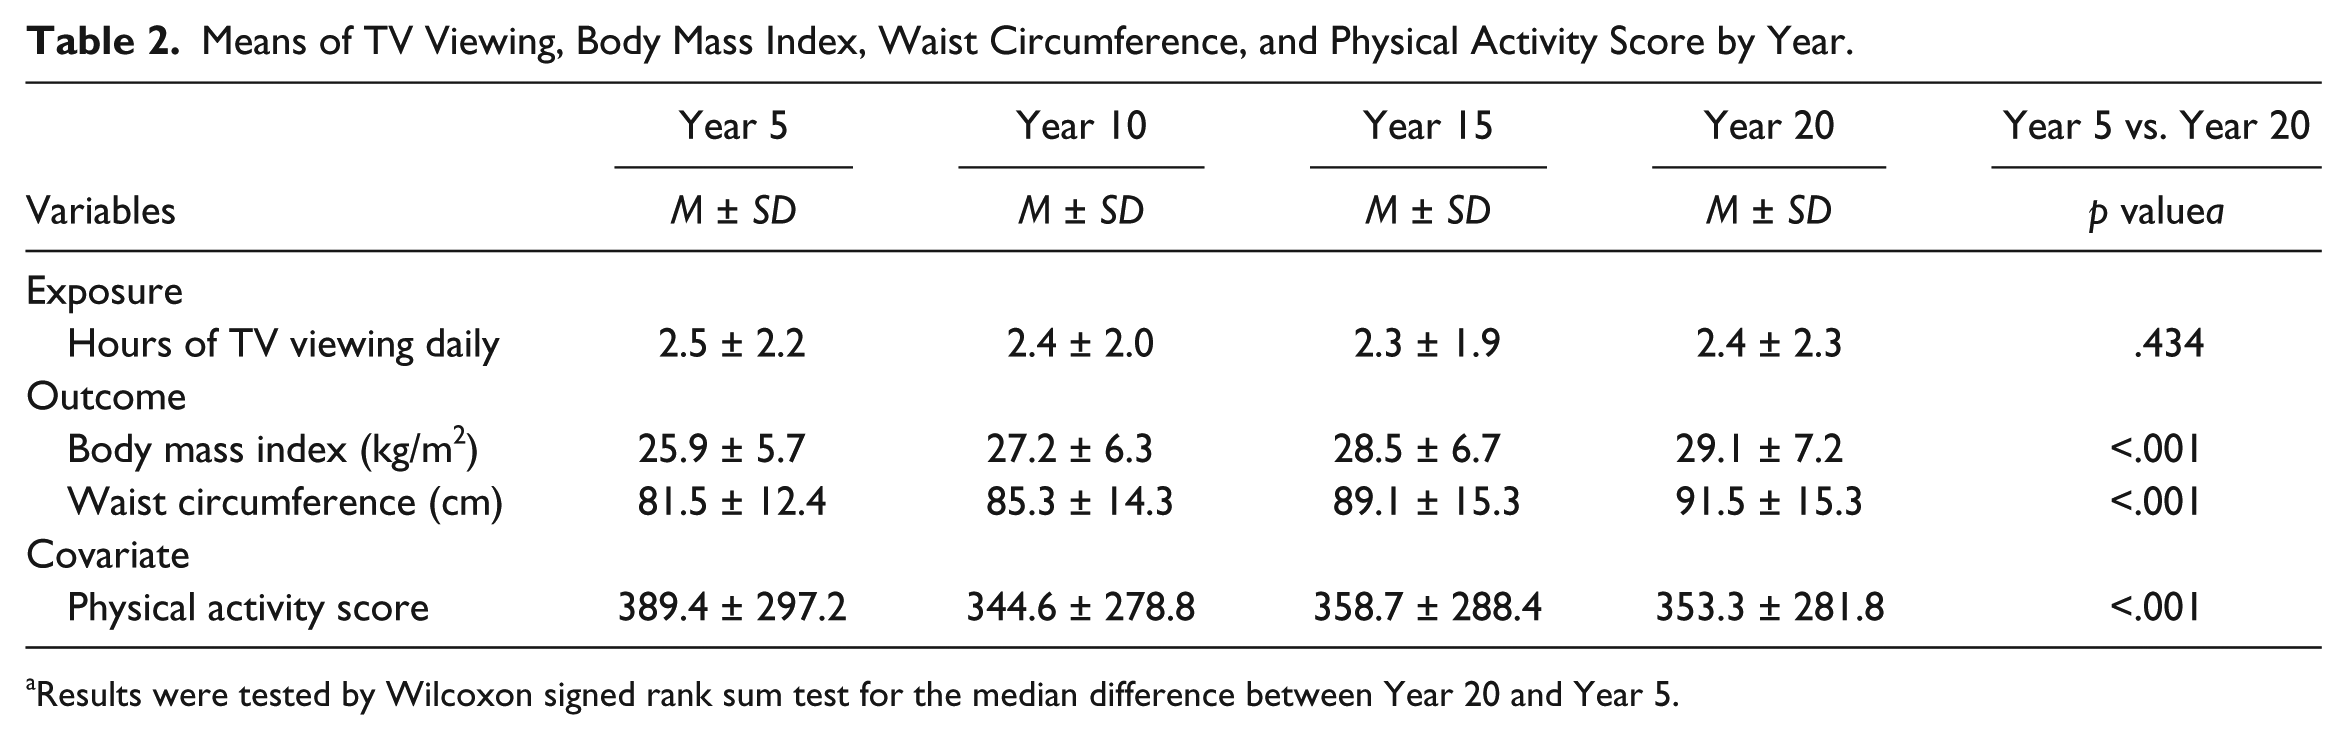
Results were tested by Wilcoxon signed rank sum test for the median difference between Year 20 and Year 5.
Correlations Among TV Viewing and BMI and WST
Table 3 shows the correlations of prospective effects of TV viewing on BMI and WST 5 years later. Throughout the study, there were significant and positive correlations between TV viewing and BMI and WST (r = .18, .20, and .22 for BMI; r = .16, .19, and .20 for WST). The correlations among TV viewing and BMI and WST slightly increased over time.
Correlations Between TV Viewing and BMI and Waist Circumference.

Note. BMI = body mass index; WST = waist circumference.
Results were tested by Spearman’s rank correlation test.
p < .05. **p < .01. ***p < .001.
Cross-Lagged Panel Model Between TV Viewing and Obesity (BMI and WST)
The results for the BMI and WST models are summarized separately in Figures 1 and 2. The R2 represents the estimated proportion of the assumed underlying continuous variable explained by the model and the arrows represent the direction of the associations tested. These data support the prospective association of the TV viewing to obesity hypothesis and fit the data well: CFI = .964, TLI = .954, RMSEA = .050 for BMI and CFI = .963, TLI = .952, RMSEA = .050 for WST. TV viewing exhibited significant temporal stability (Bs = 0.637, 0.782, and 0.720 for BMI; Bs = 0.628, 0.803, and 0.718 for WST), as did anthropometry (Bs = 1.012, 0.940, and 0.871 for BMI; Bs = 0.952, 0.914, and 0.908 for WST). In addition, the 5-year lagged association of TV viewing at Year 5 on BMI and WST at Year 10 were significant (Bs = 0.034 and 0.036, individually) but were no longer significant after Year 10. In other words, an increase of 1 standardized unit of TV viewing at Year 5 was associated with an increase of .034 standardized unit of BMI at Year 10. An increase of 1 standardized unit of TV viewing at Year 5 was associated with an increase of .036 standardized unit of WST at Year 10. The 5-year lagged effect of anthropometry on TV viewing was significant but showed two directions (Bs =−0.087, 0.151, and −0.061 for BMI; Bs = −0.147, 0.210, and −0.072 for WST). These results hold even when included TV at each time point in this model.
Discussion
Our study found a positive association between TV viewing at baseline and BMI and WST 5 years later, whereas this association was not observed at the next two observation periods. The direction of influence of BMI and WST on TV viewing also varied through time. The stable relationship within TV viewing indicated that people continued this sedentary behavior over time. Our data suggest that TV viewing is predictive of risk of obesity for young adults independent of several possible factors including dietary pattern and physical activity. This finding is consistent with previous studies of the association between TV viewing and obesity using measures of BMI (Bowman, 2006; F. B. Hu et al., 2003; Kronenberg et al., 2000; Sidney et al., 1996) and WST (Cleland et al., 2008; Kronenberg et al., 2000; Stamatakis, Hamer, & Mishra, 2012; Wijndaele et al., 2010). In addition, the prospective association of TV viewing on obesity appears to diminish as people age.
The magnitude of the increases in obesity risk varied across studies depending on the covariates studied and by the way in which TV viewing and obesity were measured and categorized. A 6-year prospective study conducted by F. B. Hu et al. (2003) reported that the positive association between TV viewing and obesity was independent of physical activity and dietary factors. In addition, TV viewing showed a stronger significant effect compared with other sedentary behaviors including sitting at work, standing at work or home, and brisk walking. This could be explained by a lower relative energy expenditure for TV viewing compared with other sedentary behaviors such as sewing, reading, writing, and driving a car (Ainsworth et al., 1993).
TV viewing was positively associated with subsequent obesity for young adults but not for those middle-aged. This finding was unexpected and suggests that middle-aged adults may differ from young adults in how they respond to the influence of TV viewing. Although studies in young (Cleland et al., 2008) and middle-aged adults (F. B. Hu et al., 2003) indicate that TV watching is positively associated with obesity, it is plausible that young adults may be more susceptible to TV viewing on energy intake and expenditure than middle-aged adults. In the aspect of energy intake, it is possible that younger people are more likely to snack during TV viewing and consume unhealthy food due to the seduction of TV advertising. One CARDIA study examining the longitudinal trends in diet found that diet quality of our CARDIA population increased with age at each exam year (Sijtsma et al., 2012). In addition, dietary recommendations have become more prevalent and practical for the public to follow since 1985. Compared with the 1985 U.S. Dietary Guidelines (“Report of the Dietary Guidelines Advisory Committee on the Dietary Guidelines for Americans, to the Secretary of Agriculture and the Secretary of Health and Human Services,” 1985) only encouraging more fruit and vegetables intake, the 2010 U.S. Dietary Guidelines (“Report of the Dietary Guidelines Advisory Committee on the Dietary Guidelines for Americans, 2010,” 2010) provide more specific dietary advice such as increasing consumption of fruit, vegetables, whole grains, nuts, and seeds, seafood and low-fat dairy and controlling intake of meats, poultry, and eggs. The CARDIA study also found an improved dietary quality over 20 years of observation from 1985-1986 to 2005-2006. These hypotheses and studies may explain our unexpected finding, suggesting that aging or secular trends may play a role in the associations between TV viewing and obesity. As these effects are average group effects as opposed to individual trajectories, this specific pattern may not be produced at the individual level. Moreover, these effects are occurring against the backdrop of much stronger positive autoregressive correlations that produce consistent (as opposed to changing) levels of TV and cardiometabolic risk over time.
With regard to energy expenditure, our data suggest that people decreased their levels of physical activity over time; however, we had no measure of light-intensity activity. Healy et al. (2008) found that sedentary behavior had a strong and negative correlation with light-intensity exercise. In addition, light-intensity exercise was a contributor to a reduction in obesity. It is possible that middle-aged people substitute light-intensity activity for TV viewing given that the mean TV viewing time slightly declined throughout the study. Rooted in these possibilities, TV viewing would become too minor a factor in middle-aged adults relative to other risk factors for obesity. Of course, we cannot rule out the possibility that a 5-year interval is not appropriate to detect the prospective effect of TV viewing on obesity in middle-aged adults. In addition, we cannot rule out the role of attrition over time. Dudley et al. (1995) indicated that Blacks, those who are younger, less educated and smoke are more likely to drop out of cohort studies. Our findings showed that those people are often susceptible to a less healthy lifestyle such as prolonged TV viewing. Therefore, the association between TV viewing and obesity could be biased toward the null by differential follow-up loss of those spending more time watching TV.
Most prospective studies of the prospective association between TV viewing and obesity in adults were of short duration, while this study followed up participants over 15 years. However, a long-term prospective study, the 1970 British birth cohort study, found no association between TV viewing habits in childhood (at age 5 and 10 years) and obesity in adulthood (at age 30 years; Viner & Cole, 2005). TV viewing as a child may not be as critical as TV viewing as an adolescent, young adult, or adult. In addition, the 1958 British birth cohort suggested that frequency of TV viewing influenced BMI gains from adolescence (at age 11 and 16 years) to adulthood (at age 23, 33, and 45 years), but the frequency of TV viewing may not be an appropriate indicator of the effect (Parsons et al., 2008). The present study addresses limitations of existing research by prospectively examining the association at shorter intervals (i.e., 5 years) over 15 years, and examining hours of daily TV viewing rather than frequency of TV viewing.
Other studies suggest that the positive relationship between TV viewing and obesity may be mutually influenced, and moderated by an individual’s body weight. For example, TV viewing may increase obesity risk, while overweight and obese people may have a propensity for sedentary behaviors like TV viewing and consumption of high caloric food compared with normal-weight people. Specifically, a Spanish cross-sectional study showed a significant interaction effect of TV viewing and weight status on abdominal obesity (Martinez-Gomez et al., 2010). In the overweight group, there was a significant positive association between TV viewing and WST, but there was no association in the normal-weight group. As expected, there were important and significant associations from BMI and WST to TV viewing stressing the need to understand this complex relationship. However, in our model, we were able to show that adjusting for this association does not remove the significant association for the youngest age group. The high levels of stability within BMI and WST implied that previous obesity was strongly contributing to subsequent risk of obesity.
This study potentially has very important public health implications. The exposure of interest, TV viewing, and the outcome, obesity, are highly prevalent in many populations around the world. Reducing sedentary time should be addressed in lifestyle guidelines forth public. The time-varying effect of TV viewing on obesity may imply that young adulthood is an important time for intervention for reducing TV viewing time. Moreover, our study implies that an increasing number of individuals may have accepted healthy lifestyle concepts over time. Our findings showed that previous obesity was a stronger predictor of subsequent obesity than TV viewing. Hence, healthy lifestyle behaviors should start at early ages.
Strengths of our study include repeated measurement in a population-based cohort and detailed measures of dietary quality and physical activity. This is the first prospective study to examine the autoregressive and cross-lagged effects of TV viewing and obesity with regular time interval. Our study also reported dose-response relationships. The follow-up time from 1990 to 2005 is appropriate for examining the association between TV viewing and obesity given current societal norms. However, our study has limitations. The lack of a light activity measure may underestimate the effect of TV viewing and obesity. It is possible that measurement error occurred due to the self-reported behavioral variables including hours of TV viewing. Our population only included Black and White non-Hispanic individuals; therefore, the results cannot be generalized to other populations. In addition, data on activity and diet were only collected at Year 5. We therefore cannot account for any change in diet or activity as a contributing factor and cannot rule out this effect on later obesity. Further studies are needed to examine the association in different populations and age groups.
In conclusion, our data provided longitudinal evidence that higher levels of TV viewing may lead to greater risk of obesity independent of baseline levels physical activity and diet. However, this prospective relationship varies with age or time period, with a stronger association in young adulthood. Our findings support the importance of reducing sedentary behaviors, especially TV viewing among young adults, for the prevention of obesity.
Footnotes
Declaration of Conflicting Interests
The author(s) declared no potential conflicts of interest with respect to the research, authorship, and/or publication of this article.
Funding
The author(s) disclosed receipt of the following financial support for the research and/or authorship of this article: This study was supported in part by research grants from the National Institute on Aging (R03AG028504), Centers for Disease Control and Prevention (U49-CE000764), and CARDIA contract (N01-HC-48047–N01-HC-48050 and N01-HC-95095).