
Abstract
The present article describes the development of a Japanese version of the Early Childhood Behavior Questionnaire (ECBQ). The influence of social desirability on the Japanese ECBQ was investigated using a cross-sectional sample (N = 318). The effects of gender and developmental changes in temperament were investigated in a longitudinal sample (N = 191). A three-factor structure was found in the instrument, the three factors being Surgency/Extraversion, Negative Affectivity, and Effortful Control. These factors were the same as those found in the original ECBQ. Social desirability showed less influence on the Japanese ECBQ, indicating the instrument was free from culture-based construct bias. This longitudinal study highlighted that Japanese toddlers have quieter, more withdrawn, and more passive temperaments, a finding that supports that of previous research comparing temperament-scale means between Japanese and U.S. children.
Keywords
In cross-cultural research measuring toddlers’ temperaments, it is necessary to have a culture-free psychometric tool. A culture-free tool must also minimize construct, method, and item bias (He & van de Vijver, 2012; Van de Vijver & Tanzer, 2004). If these sources of bias are eliminated, the instrument used to measure cultural differences in temperament can be considered equivalent across cultures. If bias is not eliminated, the tool cannot be considered equivalent and the differences in the measurement scores may stem from contamination by evaluators’ cultural beliefs and/or expectations of children rather than reflecting differences in the toddlers’ temperaments.
The present study sought to eliminate method bias using the same sample attributes and the same form of questionnaire as the original Early Childhood Behavior Questionnaire (ECBQ). The issue of item bias was addressed by using an appropriate translation method. However, as it was not clear if construct bias existed, this bias will be evaluated using social desirability described below.
Even after these biases are eliminated, the mean score level and the factor structure (possible interrelationship of the 18 temperament scales) of the ECBQ could be influenced by cultural differences. The effect of cultural influence on the mean score was investigated using a level-oriented study, while that on interrelationship used a structure-oriented study (Van de Vijver & Leung, 1997; Van de Vijver & Tanzer, 2004).
Caudill and Weinstein (1969) conducted a study comparing toddlers’ temperaments in the United States and Japan. This study found that Japanese mothers expect their babies to be quiet and content, while U.S. mothers expect babies to be vocal and active (Caudill & Weinstein, 1969). Bornstein (1989), in a later review of the literature, also found that infants in the United States had higher levels of motor activity than those in Japan. Therefore, the present study expected that scores on the temperament scales on the Japanese ECBQ representing toddlers’ activity, such as Activity Level and High-Intensity Pleasure (HIP), would be lower in Japan than those reported in the original ECBQ (Putnam, Gartstein, & Rothbart, 2006). In a study using a Japanese version of the Infant Behavior Questionnaire–Revised (IBQ-R), Nakagawa and Sukigara (2005) found that the differences in gender and age in the scale means were almost the same as those in the original IBQ-R. Therefore, the present study also expected to find similar age and gender effects as found in the original ECBQ.
The factor structure of temperaments in the ECBQ may be influenced by cultural differences. In the Japanese IBQ-R, three factors were determined: Negative Affectivity, Surgency/Extraversion, and Orienting/Regulation (Nakagawa & Sukigara, 2005). These three factors were also found in the original IBQ-R (Gartstein & Rothbart, 2003), the original ECBQ (Putnam et al., 2006), and the original Child Behavior Questionnaire (CBQ; Rothbart, Ahadi, Hershey, & Fisher, 2001). The three-factor structure in the Japanese IBQ-R includes some different temperament scales for the Surgency/Extraversion and Orienting/Regulation factors, but the temperament scales comprising Negative Affectivity are the same as in the original IBQ-R. For example, Gartstein and Rothbart (2003) considered Soothability to be an Orienting/Regulation factor, while Nakagawa and Sukigara (2005) found it to be a Surgency/Extraversion factor. However, in the Japanese CBQ, Kusanagi, Hoshi, and Chen (1999) found the same three-factor structure and the same scales comprising in each factor as in the original CBQ. The Japanese ECBQ is situated between the IBQ-R and the CBQ in terms of the age of children measured, and the present authors expected to find a similar three-factor structure as well as some differences in the scales comprising each factor with those found in the Japanese
Differences in the factor structures of the Japanese and original ECBQ raise the question of why cultural differences result in a difference in the scales comprising each factor. Differences in the patterns of inter-correlations of the 18 ECBQ temperament scales can be expected across cultures, but the reasons for these differences are unclear. Caprara, Barbaranelli, Bermudez, Maslach, and Ruch (2000) compared the factor structure of the Big Five questionnaire across cultures. They suggested that the Big Five factors were broad, general dimensions that encompass different, but overlapping domains (Caprara et al., 2000). Therefore, it may be that the temperament concept dimensions (factors) in the ECBQ also have behavioral domains that overlap, and these overlapping behaviors might differ between cultures. These differences in overlapping behaviors may also arise from differences in cultural beliefs and expectations for children and/or temperament concepts. In turn, these differences produce factor structure differences and differences in the scales comprising each factor.
The ECBQ comprises a list of children’s behaviors within a cultural context, with the frequencies of those behaviors rated by evaluators. It may be that when evaluators (in the present study, caregivers) consider a particular behavior appropriate or desirable for their culture, that behavior may be rated as occurring more frequently. If two behaviors are interpreted as meeting the same cultural expectations for children, both behaviors may be rated as occurring more frequently at the same time and within different contexts, and the high correlation between them will be shown whether or not these behaviors stem from temperament factors. This means that the differences in overlapping behaviors can appear as cultural differences in the factor structure and/or the scales comprising the factors. For example, if Japanese caregivers believe that both a low Activity Level behavior and a high Inhibitory Control behavior are desirable and expected for children, they will consider both behaviors to occur more frequently in many cultural contexts, and the resulting high correlation between them is attributed to the same factor. However, Putnam et al. (2006) highlighted that these behaviors stem from different temperament factors (e.g., Activity Level from Surgency/Extraversion and Inhibitory Control from Effortful Control).
An index of cultural differences in caregivers’ beliefs and expectations for children was necessary to provide clarity. Social desirability differs between cultures and is considered to be a manifestation of evaluators’ cultural beliefs about and/or expectations for their children. This makes the social desirability of constructs, namely, 18 temperaments, a candidate for a cultural differences index.
To assess the impact of social desirability (an index of construct bias) on the ECBQ scores, caregivers in the present study were asked to directly evaluate their impression of their child on 18 temperament dimensions; this rating was called “caregiver rating of their children’s temperament” (CGR). As the ECBQ required caregivers to rate their children’s behavior in specific situations (Putnam, Ellis, & Rothbart, 2001), the CGR was likely to show more caregiver bias. Social desirability was therefore expected to influence the CGR rating more strongly than the behavioral frequency ratings in the ECBQ. However, if both the Japanese ECBQ and the CGR ratings show the same influence by social desirability, then the temperament-scale scores on the ECBQ were contaminated by social desirability. Caregivers in the present study were asked to complete both the CGR and the Japanese ECBQ.
Social desirability tends to additively influence rating frequencies of toddler behavior for each component item of the temperament scale. This means that social desirability needed to be determined independently from the ECBQ and the CGR ratings to accurately determine the causal relationship.
It is noticed that the CGR has another purpose. In Japan, little research on toddler temperament using the ECBQ or other similar tests is available, meaning the results of the present study cannot be compared with those of other Japanese studies. Other tools were needed to investigate the validity of the Japanese ECBQ. The CGR would be a candidate of the other tool. The Japanese ECBQ and the CGR were assumed to measure the same constructs, but they were different in the measurement method. Thus, to verify the validity of the Japanese ECBQ, we will evaluate the correlations between the scores of the Japanese ECBQ and the CGR and will confirm whether the gender and age differences in the CGR are like as in the Japanese ECBQ.
The present study is divided into two parts: Sutdy 1 focuses on the development of a Japanese ECBQ and seeks to verify cultural differences in the Japanese ECBQ by evaluating how social desirability of each temperament scale affects these scores. Study 2 examines longitudinal shifts in the temperament dimensions of 18- to 36-month-old infants in the Japanese ECBQ.
It was expected that toddlers in Japan would be rated as quieter, more content, and having lower levels of motor activity than those reported in the original ECBQ study. The Japanese tool was also expected to have the same three-factor structure, and show similar age and gender differences and developmental changes. This would indicate that the Japanese ECBQ was compatible with the original tool. To demonstrate that the tool was free from culture effects, correlations between social desirability, or construct bias, and the ECBQ should be lower than correlations between social desirability and the CGR.
Method
Instrument Construction
Japanese ECBQ
The ECBQ (Putnam et al., 2006) was translated into Japanese by a professional Japanese translator and by a graduate student who is a child care worker. These two forward translations were then reviewed by the present authors and synthesized into a single translation. This Japanese translation was back-translated into English and the translation quality examined by a bilingual Japanese U.S. resident. A pilot study was conducted with 12 caregivers who had a child aged 18 to 36 months. Participants were asked to check the item readability in the Japanese ECBQ. The pilot study recommended culturally appropriate modifications to questions referring to water sprinklers, nursery rhymes, and beeping sounds.
To complete the Japanese ECBQ, caregivers were asked to report the frequency of specific child behaviors on a 7-point Likert-type scale ranging from never to always. Table 1 sets out the number of items on each scale.
Cross-Sectional Age and Gender Effects on Temperament Dimension at the First Study Period.
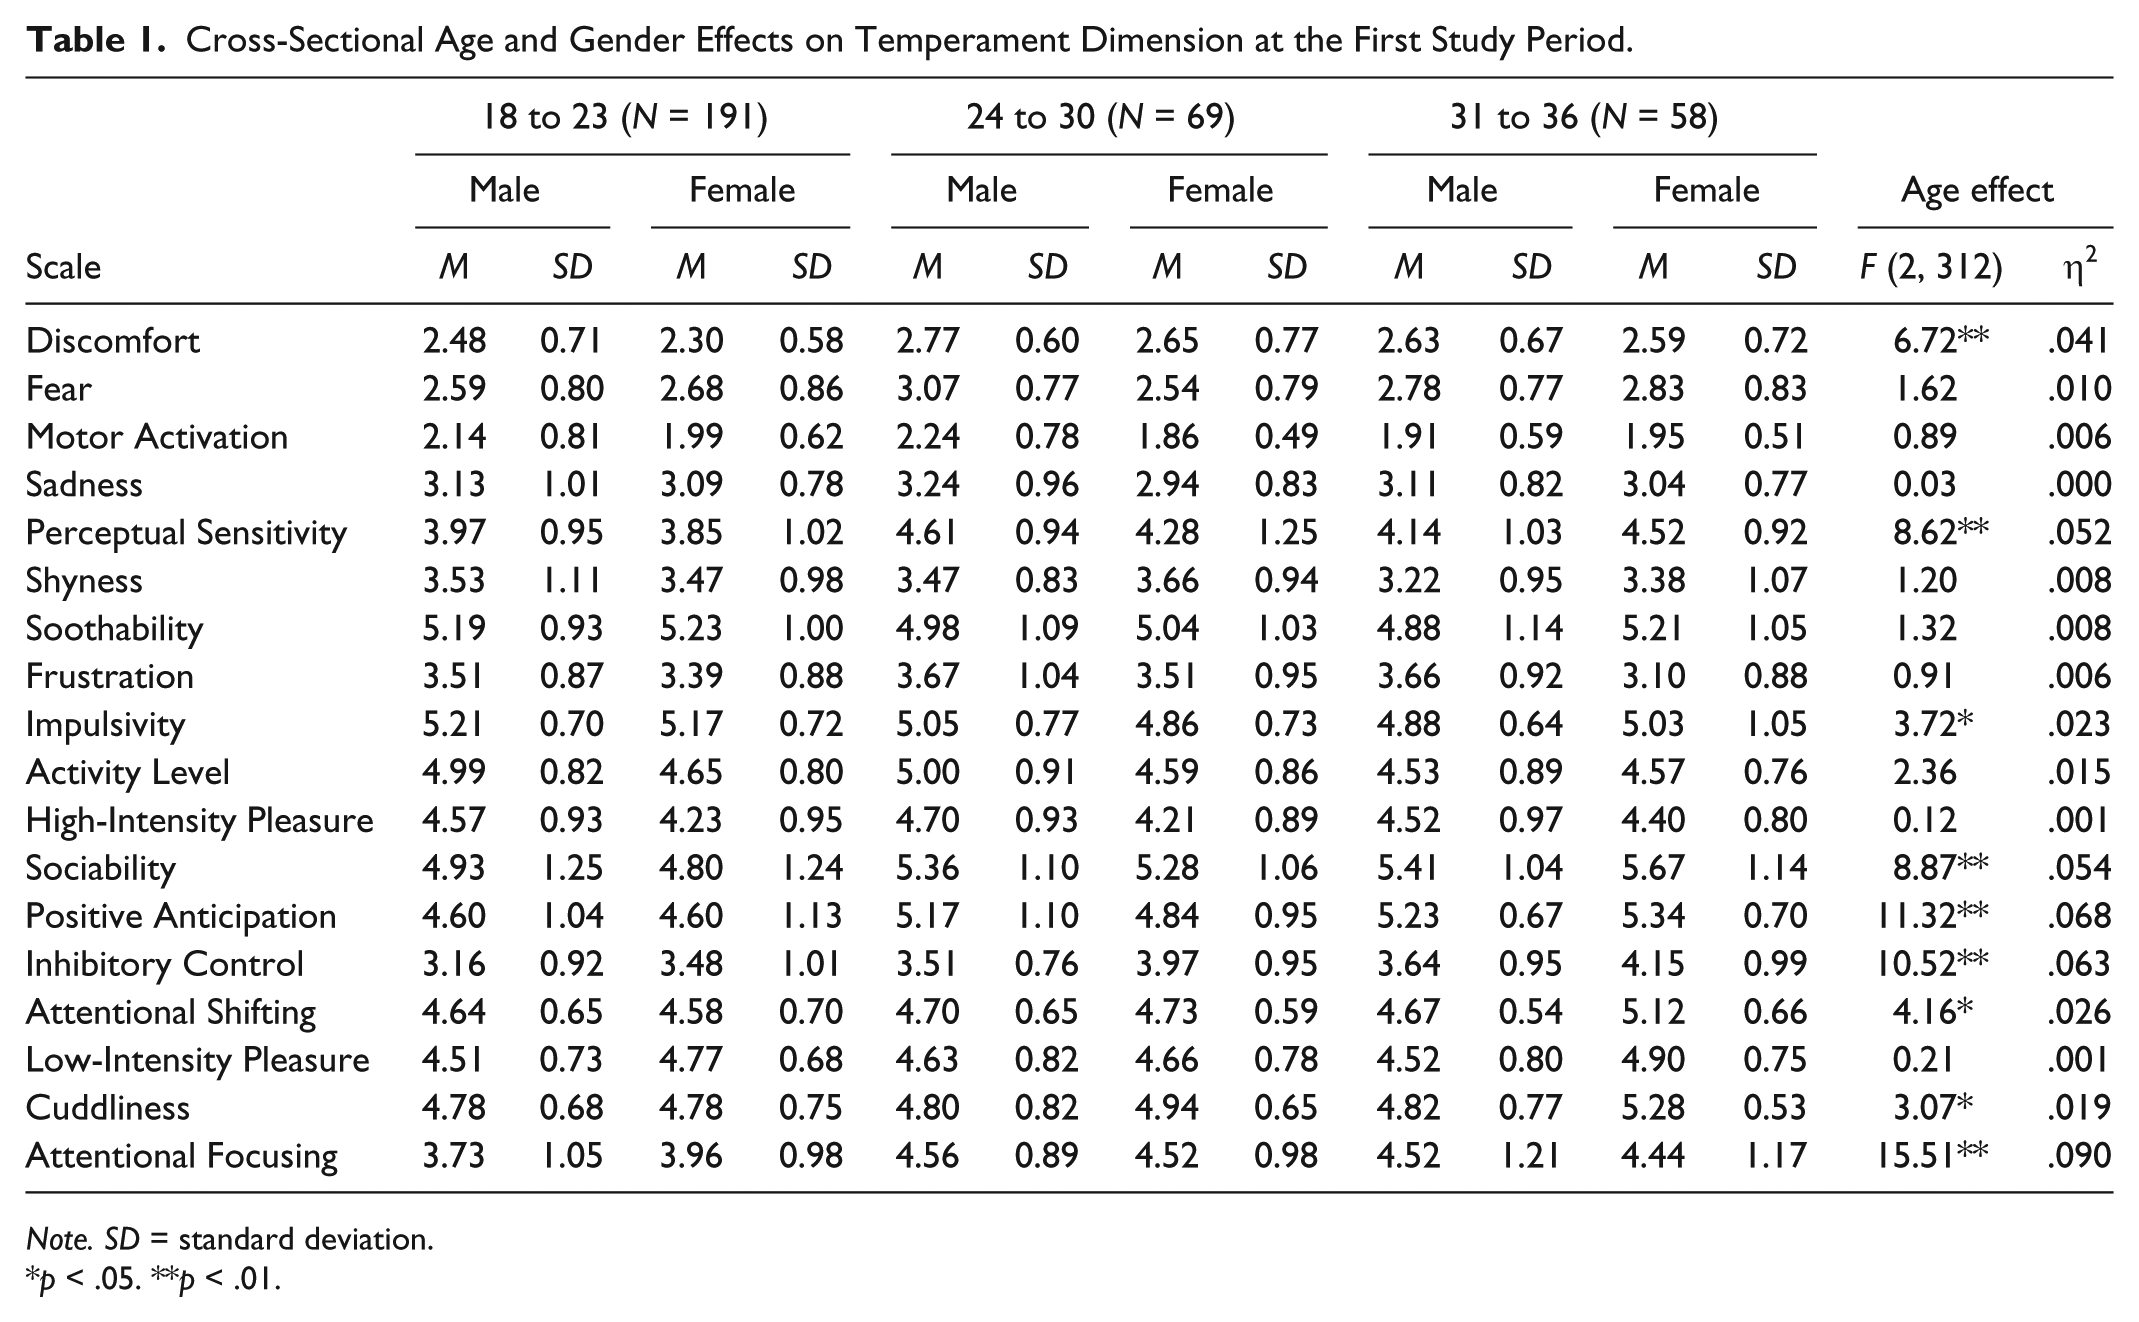
Note. SD = standard deviation.
p < .05. **p < .01.
CGR
A short, clear definition of the 18 temperament dimensions was prepared as an item in Japanese (see the appendix). Caregivers were asked to rate how applicable a given temperament dimension was to their child on a 6-point Likert-type scale ranging from least to most. It was emphasized that these ratings were to be according to global judgments and/or impressions, and not the frequency of their children’s behaviors.
Social desirability
To observe the social desirability of the temperament dimensions independently from the ECBQ scores, a different adult sample was needed. This sample rated the social desirability of definitions (constructs) of the 18 temperaments on a 6-point Likert-type scale ranging from undesirable to desirable. The 18 items were the same as on the CGR. Participants were instructed on the definition of social desirability before providing ratings, and it was emphasized that they should rate whether the temperament dimension is popularly acceptable and/or desirable in Japan and not rate the desirability of the temperaments for their own children.
Participants and Sampling Methods
Sample 1
Caregivers who attended a medical check-up for an 18-month-old child at public health centers in Nagoya and Konan in Aichi Prefecture, and Fukui in Fukui Prefecture were invited to participate in the study. This gave a study sample of 318 toddlers (49% female). The average age of caregivers was 33.69 years (standard deviation [SD] = 4.18 years); they were primarily female, except for one male and three unknown, and 97% were mothers. The exclusion criteria were a birth weight of less than 2,500 g or more than 4,000 g; a gestation period of less than 38 weeks or more than 43 weeks; a birth defect; and those who attended a nursery school (caregivers needed to observe their children’s behavior all day to answer the ECBQ).
The majority of the data were collected in metropolitan Nagoya (75%), 14% in Konan, 8% in the provincial town of Fukui, and a further 2% in other locations. The Japanese ECBQ and the CGR were distributed to caregivers, providing data for a first time-point.
To allow for a cross-sectional analysis, toddlers were divided in three groups according to age as in Putnam et al. (2006). A young group (Y) aged 18 to 23 months (N = 191, 98 female and 93 male), a middle group (M) aged 24 to 29 months (N = 69, 36 female and 33 male), and an older group (O) aged 30 to 36 months (N = 58, 23 female and 35 male). Because both Nagoya and Konan did not have any 0% values, we constructed an Age (3) × Location (Nagoya and Konan) frequency table and tested this using a chi-square test. We found no significant difference in the age proportion of participants from urban and rural settings (χ2 = 2.29, df = 3, n.s.).
Six months later, the Japanese ECBQ was administered for a second time to 194 participants. At the first time-point, 48 of the 318 participants who belonged to the older age group were out of the ECBQ’s coverage age by the second time-point. So, at second time, those 48 were not requested to respond to the Japanese ECBQ. Because 76 did not return the questionnaire, 194 participants were analyzed. Responses could be matched to first-time participants through the birthdays of child and mother, child’s gender, and residential area (Nagoya: 76%, Konan: 10%, Fukui: 11%, Other: 1%). This provided data for a second time-point, and Cronbach’s alphas were calculated for the 194 data sets.
Twelve months later, 128 participants with children aged 24 to 29 months were administered the ECBQ by mail. This provided data for a third time-point. A total of 127 participants (Nagoya: 74%, Konan: 12%, Fukui: 14%) returned the ECBQ. Cronbach’s alphas were conducted for the 127 data sets.
Sample 2
Adults (N = 368; 301 female, 23 male, and 44 of unknown gender) ages ranging 22 to 55 years (M = 34.7 years, SD = 4.37 years, and median = 35 years) were recruited from kindergartens and nursery schools in Nagoya (25%), Konan (62%), and Kokubunji (13%). These groups of participants were asked to rate the social desirability of constructs of the 18 temperament scales on a 6-point Likert-type scale.
Results
The results of the present study are presented in two parts. First, the factor structures of the Japanese ECBQ, CGR, and social desirability are reported, along with the relationships between these indices, and the mean scale scores of the cross-sectional data (318 participants). Second, the findings of the investigation of the longitudinal shift in temperament scales (127 participants) are reported.
Study 1: Cross-Sectional Data
Distributions, means, and SDs
The means and SDs for each age by gender on each temperament scale are set out in Table 1. In Sample 1 (N = 318), the normality of distribution was examined with a Shapiro-Wilk test. Activity Level, Attentional Focusing, Attentional Shifting, Cuddliness, Frustration (FR), HIP, Inhibitory Control, and Perceptual Sensitivity were normally distributed, while the remaining 10 scales were not. However, distributions for all scales had one peak and were nearly symmetrical at the peak.
Internal consistency
Alpha coefficients of temperament scales for the first time-point are shown in Table 2. Of the 18 alphas, 14 were more than .70, indicating substantial internal consistency. Four alphas were below .70: Attentional Shifting (α = .66), Discomfort (α = .65), Impulsivity (α = .63), and Motor Activation (α = .69). These alphas were similar to those in Putnam et al. (2006), and changes of alpha coefficient by age group also followed the same trends. Therefore, the Japanese ECBQ was show to have internal consistency corresponding to that of the original ECBQ.
Reliability and Age Comparisons on Each ECBQ Scale at the First Study Period.

Note. ECBQ = Early Childhood Behavior Questionnaire.
Factor structure (Japanese ECBQ)
A principal component analysis of the 18 temperament scales was conducted without rotation. The eigenvalues were 3.634, 2.847, 2.438, and 1.114, in descending order; the fourth eigenvalue was less than half of the third, and these three components accounted for 49.6% of the total variance. A factor analysis with procrustes rotation was conducted to confirm whether the pattern matrix replicated the original ECBQ. The factor patterns obtained had good consistency with the target pattern, using both a factor congruent coefficient and a variable congruent coefficient (Table 3). These congruent coefficients are the correlation coefficients between the factor loadings in the target pattern and those in the pattern obtained for each factor and on each variable. This indicates sufficient comparability between the two-factor patterns of more than .90 (McCrae, Zonderman, Costa, Bond, & Paunonen, 1996). However, less compatible between the Japanese and the original ECBQ for Perceptual Sensitivity, with a variable congruent coefficient of .775, was found. This means that almost the same factor structure (with a first factor of Negative Affectivity, a second of Effortful Control, and a third of Surgency/Extraversion) was found in both versions.
Factor Patterns in Factor Analysis With Procrustes Rotation of the Japanese ECBQ and the CGR and Congruency Indices.

Note. ECBQ = Early Childhood Behavior Questionnaire; CGR = caregiver rating of their children’s temperament.
CGR
Principal component and factor analyses were conducted for the CGR as for the ECBQ. The eigenvalues were 2.957, 2.521, 2.107, and 1.088, in descending order; the fourth eigenvalue was less than half of the third, and these three components accounted for 42.1% of the total variance. Therefore, the three-factor solution was also adopted for the CGR.
A factor analysis with procrustes rotation was conducted to confirm whether the pattern matrix of the CGR was same as the original ECBQ we conducted. The factor congruent coefficients were slightly less than .90, indicating factor patterns obtained had almost as good consistency with the target pattern (Table 3). Some incongruent variables were found on the Surgency/Extraversion factor (Positive Anticipation −.393, Impulsivity .782, Sociability .857, and Activity Level .890) and on the Effortful Control factor (Attentional Shifting .818, and Low-Intensity Pleasure .649), while the temperament scales of the Negative Affectivity were congruent with the original. As the factor structure of the Japanese ECBQ replicated the original ECBQ, the temperament scales of two factors for the CGR were affected by something other than the temperaments measured with the ECBQ. These results align with those of Nakagawa and Sukigara (2005), where the Japanese IBQ-R did not replicate the temperament scales of the original Surgency and the Effortful Control factors, but the Negative Affectivity temperament scales were congruent.
Social desirability
An exploratory factor analysis with varimax rotation was conducted on social desirability in Sample 2 (N = 368). A two-factor solution was found (Table 4), with λ values of 2.685 (14.9%) and 2.206 (12.2%). The temperament scales with high first-factor loading had high social desirability, but those with high second-factor loading had low social desirability (Tables 4 and 5). Therefore, the measurement of social desirability measured the social desirability of temperament constructs, but not temperament constructs per se.
Factor Loadings of Social Desirability Through Principal Factor Analysis With Varimax Rotation.

Means and SDs on CGR Scales for Each Age Group and on Social Desirability and Correlations Between ECBQ and CGR.
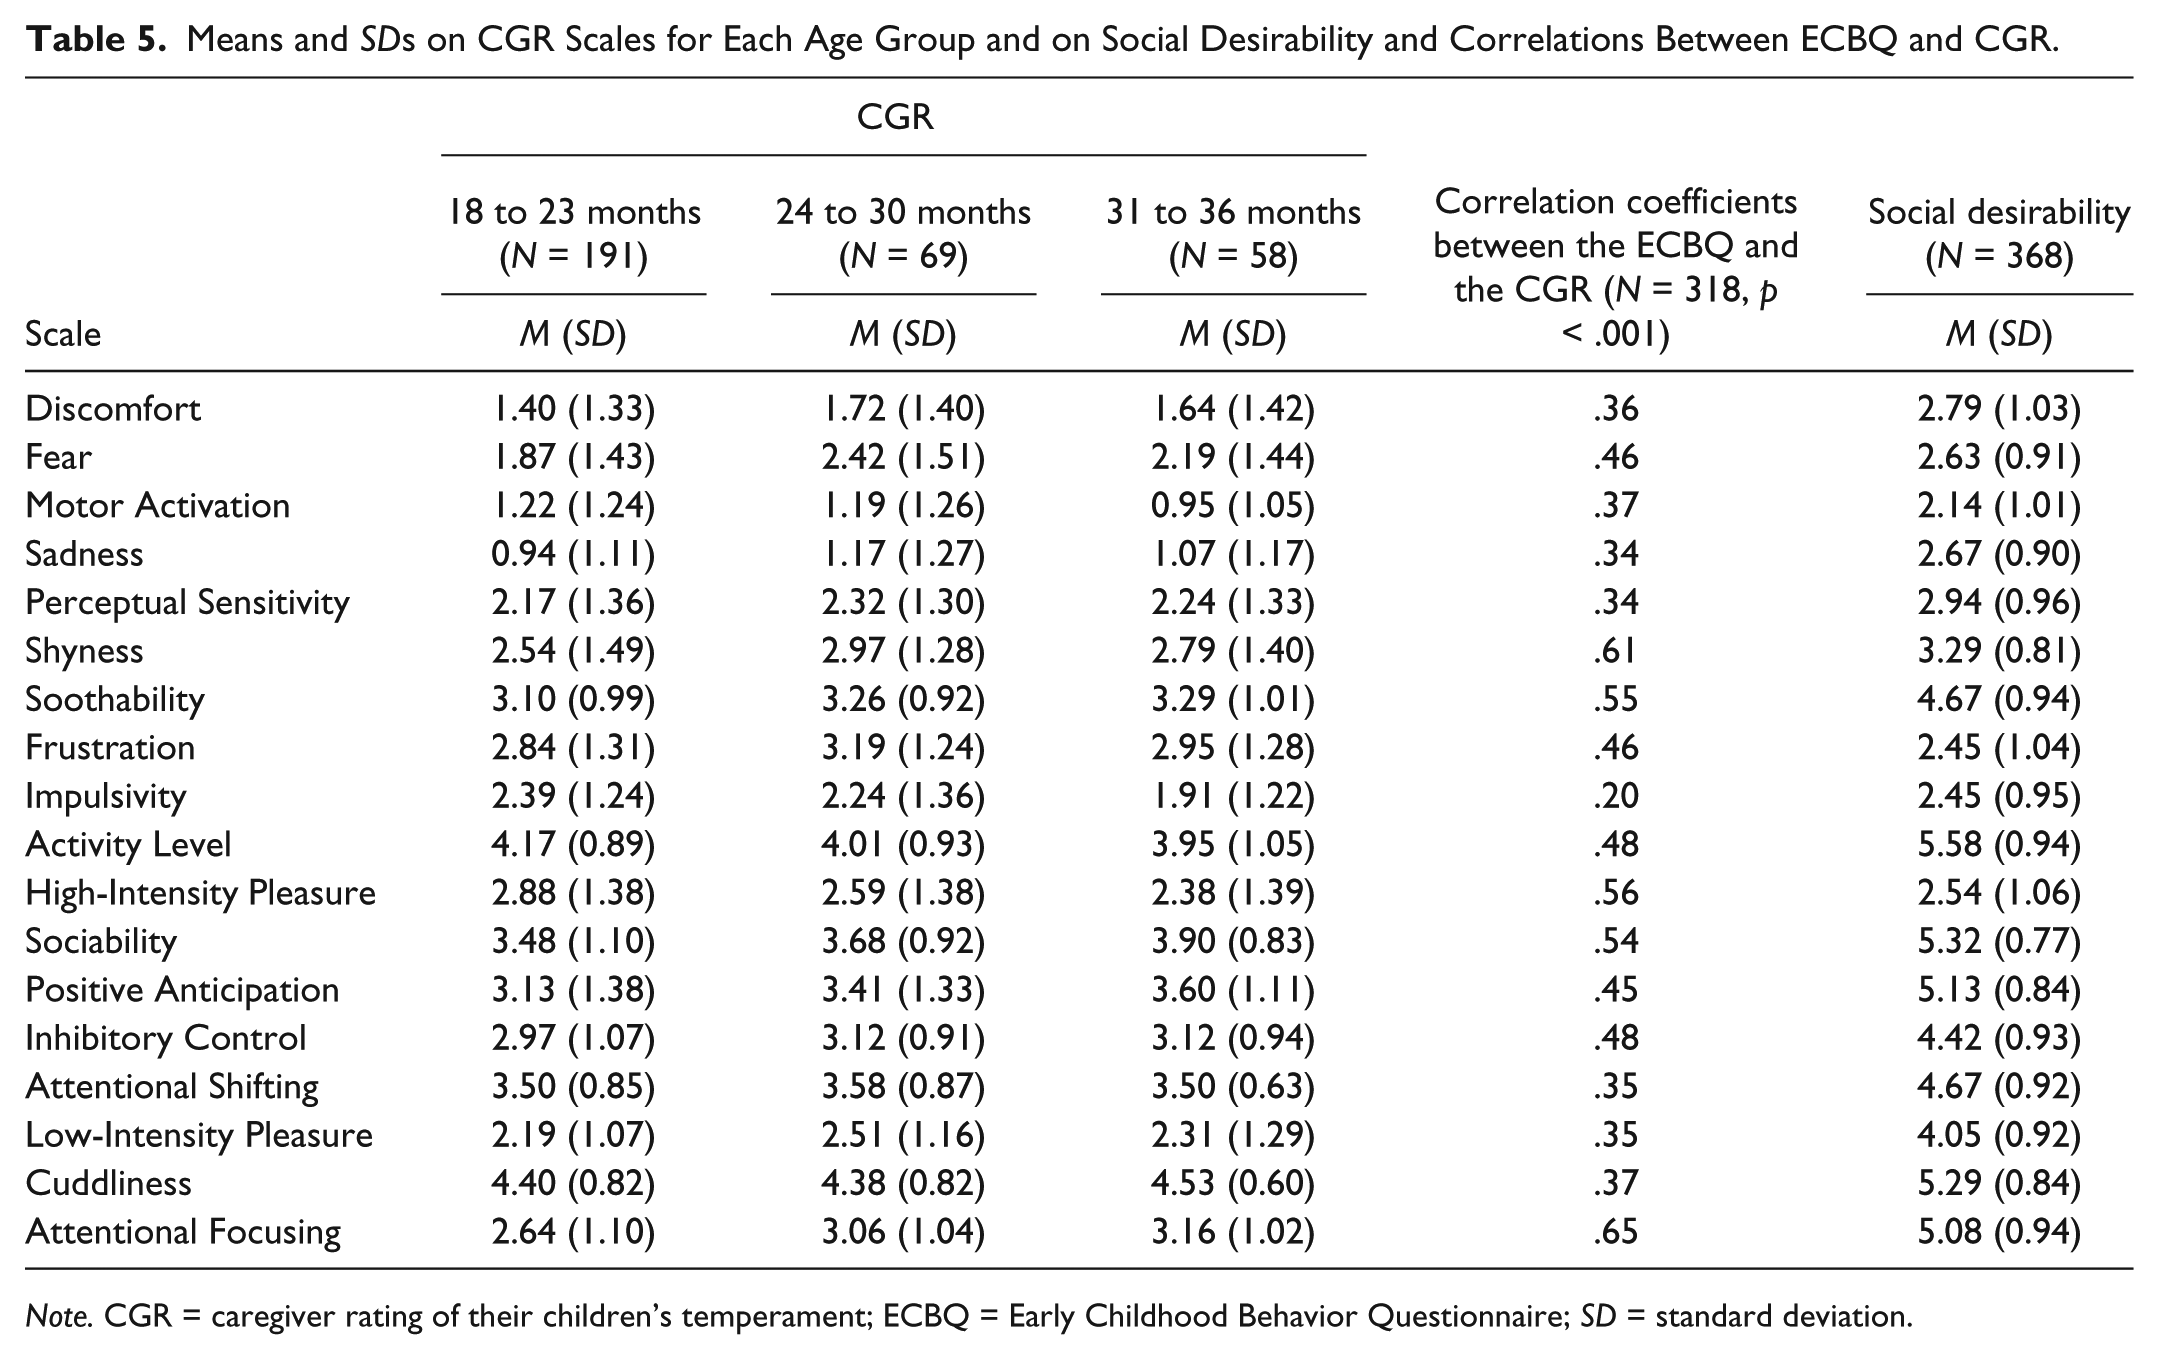
Note. CGR = caregiver rating of their children’s temperament; ECBQ = Early Childhood Behavior Questionnaire; SD = standard deviation.
Social desirability, ECBQ, and CGR
The means and SDs for social desirability on each temperament scale are shown in Table 5. The effects of social desirability were considered to add to the mean scores of each scale in the ECBQ and the CGR by constant amount, meaning the correlation coefficients between the social desirability and the ECBQ, and between the social desirability and the CGR were an index of the amount of the social desirability effect. Correlation coefficients for the mean scale scores of the social desirability, the ECBQ, and the CGR were calculated over the 18 temperament scales (Figure 1). The correlation between social desirability and the ECBQ was r = .646 (N = 18, p < .01); for social desirability and the CGR, r = .803 (N = 18, p < .01); and for the ECBQ and the CGR, r = .725 (N = 18, p < .01). However, Fisher’s z test showed that the correlation coefficient between social desirability and the CGR was not statistically higher than the correlation between social desirability and the ECBQ (z = .927, n.s.).

Scatter diagram of ECBQ (open circles) and CGR (triangles) scales in terms of their social desirability.
Figure 1 presents a scatter diagram of the ECBQ and the CGR temperament dimensions in terms of social desirability. For the relationship of the ECBQ to social desirability, all temperament dimensions, excluding Impulsivity (I) and HIP, lined up linearly (r2 = .417) in the relationship of the CGR to social desirability; all but FR lined up linearly (r2 = .645). Social desirability accounted for a greater proportion of variance in the CGR than in the ECBQ, suggesting that the CGR was influenced more by social desirability than the ECBQ.
To evaluate the contribution of social desirability, the partial correlation between the CGR and social desirability excluding the effect of the ECBQ (r = .636, N = 18, p < .01), and the partial correlation between the ECBQ and social desirability excluding the effect of the CGR (r = .155, N = 18, n.s.) were calculated. This indicates that although caregivers rate global impression of toddler temperament according to social desirability, their reports of the frequency of specific child behaviors were relatively independent of social desirability.
Gender and age effects in Japanese ECBQ
Gender and age effects were assessed using a 2 × 3 (Gender × Age Group) ANOVA. The effects of age were significant for Discomfort, Perceptual Sensitivity, Impulsivity, Sociability, Positive Anticipation, Inhibitory Control, Attentional Shifting, Cuddliness, and Attentional Focusing (Table 1). A contrast analysis indicated that Impulsivity linearly declined with age at the .05 significance level, and Attentional Shifting linearly increased with age at the .01 significance level. Other significant scales also increased linearly with age at a 1% level. These trends were similar to those found in Putnam et al. (2006).
The effects of gender were significant for FR, Activity Level, HIP, Inhibitory Control, Low-Intensity Pleasure, and Cuddliness: Fs(1, 312) = 5.81, 4.95, 6.86, 12.33, 5.51, and 4.35; η2s = .018, .016, .022, .038, .017, and .014 (Table 1). Males had significantly a higher mean score on FR and Activity Level than females (p < .05). Caregivers rated males significantly higher than females for HIP, while for Inhibitory Control, females were rated significantly higher than males (p < .01). Females also had higher mean scores on Cuddliness and Low-Intensity Pleasure than males (p < .05).
The gender effect significantly interacted with age on Fear and Attention Shifting, Fs(2, 312) = 3.64 and 3.32, ps < .05 (η2s = .023 and .021). A post hoc test using the Bonferroni method found that male Fear scores were significantly higher than female scores at age 24 to 30 months (p < .01). For Attention Shifting, the same test clarified that female scores were significantly higher at 30 to 36 months (p < .01), although this was not significant at 24 to 30 months. This suggests that the female Attention Shifting scores increased as they grew older, while male scores remained the same regardless of age.
CGR
Table 5 shows the mean score on each temperament scale. Age and gender effects were assessed using a 2 × 3 (Gender × Age Group) ANOVA. Age was found to have a significant effect on Sociability, Positive Anticipation, and Attention Focusing, Fs(2, 312) = 4.08, 3.52, 6.86, ps < .05, .05, .001 (η2s = .025, .022, .043). A contrast analysis indicated that caregivers’ ratings on these scales significantly increased linearly with age (at 1%, 5%, and 1% significance levels). For Impulsivity and HIP, however, the rates significantly decreased with age, Fs(2, 312) = 3.54, 3.49, ps < .05 (η2s = .023, .022; the linear trends on the contrast analysis were significant at 1% and 5%). Age also had a significant effect on Fear, F(2, 312) = 4.14, p < .05 (η2s = .026), and a contrast analysis showed marginal significance on the quadratic trend (p = .055) that was highest for the M group.
Gender effects were found for Sadness, Impulsivity, Activity Level, and Inhibitory Control, Fs(1, 312) = 4.65, 4.49, 8.32, 5.70, ps < .05, .05, .005, .05 (η2s = .015, .014, .023, .018). Caregivers rated females higher than males for Inhibitory Control, whereas for the other three scales (Activity Level, Impulsivity, and Sadness), males scored higher than females. No interaction of age with gender was found.
Age-related effects in the CGR differed from those in the Japanese ECBQ on dimensions of Attention Shifting, Fear, HIP, Low-Intensity Pleasure, Perceptual Sensitivity, and Soothability. The age-related changes in the mean rates were the same in both the ECBQ and CGR. However, only the Activity Level temperament had the same main effect in both the ECBQ and CGR.
Relationships between the Japanese ECBQ and the CGR
Correlation coefficients between the scale score of the ECBQ and CGR ranged from .20 (Impulsivity) to .65 (Attentional Focusing; Table 5). All correlations were significantly greater than zero at p < .001, but the correlation coefficients were at a medium level. The CGR was assumed to measure the same constructs (temperaments) as the ECBQ with a different measuring method, meaning the correlations on each scale between the CGR and the ECBQ would be slightly lower than each scale’s reliability coefficient. From the alpha coefficients of temperament scales in Table 2 and the correlation coefficients in Table 5, it appears that the higher the alpha, the higher the correlation. The highest alpha and correlation were .89 and .65 (Attentional Focusing), and the lowest alpha and correlation were .63 and .20 (Impulsivity). As all correlations were low, the CGR may have been contaminated by something other than the toddlers’ temperaments and the effect of differences in methods (e.g., caregivers’ expectations of their child and/or social desirability).
Study 2: Longitudinal Shifts
Attrition effects
At the first time-point, 48 of the 318 participants who belonged to the older age group were out of the ECBQ’s coverage age by the second time-point. This means these participants were not asked to respond to the Japanese ECBQ a second time. Of the remaining participants, 204 returned the questionnaire, but only 194 were analyzed. This gave an attrition size of 76 from the first to the second time-points. At the third time-point 12 months later, only 128 participants were requested to answer the Japanese ECBQ. A total of 127 participants returned the questionnaire, giving an attrition size from the second to the third time-points of one.
To investigate the attrition effect of the 76 dropout participants from the first to the second time-points (an attrition rate of 24.2%; male: 23.2%, female: 31.9%), a comparison of the temperament-scale means of the attrition sample and the sample at the second time-point was conducted using t tests. No significant differences in any scales between the two samples were found. The samples at the first, second, and third time-points and the attrition group had the same composition of recruitment area, indicating attrition did not bias the results.
Internal consistency and inter-time correlations (test–retest correlations)
The alpha coefficients of the temperament scales for the second and third time-points, are shown in Table 6. These alphas were almost the same as from the first time-point indicating that the Japanese ECBQ had sufficient internal consistency when it was repeatedly administered.
Correlation Coefficients Between Age Ranges in Longitudinal Data.

18 to 23 months old at first time.
24 to 30 months old at second time.
31 to 36 months old at third time.
To investigate the inter-time correlation for each temperament scale, a correlation coefficient between time-points was calculated (Table 6). Of the 18 correlations between the young (Y) and middle (M) age groups (i.e., between the first and second time-points), Positive Anticipation had the lowest correlation (r = .27) as Putnam et al. (2006). This dimension was also lowest between the M and older (O) age groups (i.e., between the second and third time-points; r = .51) and between the first and third time-points (r = .30). The highest correlation was for Perceptual Sensitivity, from the Y to M groups (r = .77) and from the Y to the O groups (r = .67). The correlation for Motor Activation was the highest between the M and O groups (r = .79). Table 6 also shows the average correlation of the 18 temperament dimensions obtained by calculating the mean of the Fisher z transformation of rs. This means r represents overall inter-time consistency among the 18 temperament dimensions.
Some items for which consistency is lowest (e.g., Positive Anticipation) describe situations less relevant for 18-month-old toddlers but more relevant for older toddlers: for example, “When hearing about a future family outing (such as a trip to the playground).” This may explain the lower correlations across time-points.
The inter-time correlation can be interpreted as test–retest reliability. However, the correlations were influenced by both developmental changes and individual differences, meaning developmental changes may have attenuated the intrinsic test–retest reliability. No explanation has been offered for the correlation across time-points for the Y and M groups, as methods to differentiate the two effects are not available at present.
Longitudinal shifts of temperament dimension and gender effect
Longitudinal shifts and gender effects were assessed using a 2 × 3 (Gender × Time) ANOVA. Table 7 shows the longitudinal shifts for each gender. The main effects of time (age) were significant on all but three temperament dimensions: Low-Intensity Pleasure, Motor Activation, and Shyness (Table 7). Soothability decreased linearly with time (age), Activity Level had the highest mean score at the second time-point, and the other temperament dimensions increased linearly with time (age).
Longitudinal Age and Gender Effects on Temperament Scale.

Note. SD = standard deviation.
p < .05. **p < .01.
The effects of gender were significant for Activity Level, HIP, Inhibitory Control, and Low-Intensity Pleasure (Table 7). For Activity Level and HIP, males had higher mean scores than females, while females had higher mean scores than males for Inhibitory Control and Low-Intensity Pleasure.
The gender effect significantly interacted with age only on Shyness, F(2, 250) = 4.00, p < .05. Shyness scores for females increased as the toddlers grew older, whereas the male scores increased from the first to the second time-points and decreased until the third time-point.
Discussion
The present study concluded that the Japanese ECBQ was not contaminated by social desirability and is a well-developed, culture-free tool. The findings showed that the 18 scales were internally consistent and consistent across time. The factor structure of the instrument was the same as that of the original ECBQ (Putnam et al., 2006) and was similar to that of fine-grained measures of temperament dimension currently in use with younger (IBQ-R) and older children (CBQ). The age and gender differences and developmental changes that emerged in the cross-sectional and longitudinal studies were also consistent with the original ECBQ.
Assuming that social desirability is a manifestation of the raters’ cultural beliefs and/or expectations (construct bias) for their toddlers, the correlations between the ECBQ, the CGR, and social desirability were evaluated (Figure 1). The partial correlations suggested that caregivers’ global impression ratings of temperament were contaminated by social desirability, but their reports on the frequency of specific child behaviors were affected by few social desirability. As the CGR factor structure differed from the original ECBQ, and the factor structure of the Japanese ECBQ was the same as the original, social desirability was suggested to produce differences in the factor structure.
Both the CGR and the Japanese ECBQ have the same three-factor structure, but the scales comprising each factor differ from the original ECBQ. The factor patterns of the Surgency/Extraversion factor (Positive Anticipation, Impulsivity, Sociability, and Activity Level) and that of the Effortful Control factor (Attentional Shifting and Low-Intensity Pleasure) were incongruent with the factor pattern of the original ECBQ. The results of the Japanese IBQ-R were similar to those found in the CGR in the present study particularly as the children’s behavioral frequency ratings in the IBQ-R were also affected by social desirability. This suggests that social desirability has more influence on both global impressions rated by the CGR and infants’ behaviors rated by the IBQ-R, but less influence on the toddlers rated by the ECBQ. It may be inferred that the influence of social desirability on the behavior ratings decreases as the children grow older (i.e., from infant to toddler) but that the influence on global impression ratings are longer lasting.
However, the present results contradict the common belief that effects of culture through rearing styles and education increase as children grow older. It may be that as infants or neonates are relatively immobile, and some behaviors do not occur until the child is older, raters’ beliefs or expectation for children may be more strongly projected and contaminate the behavioral frequency ratings. This would be less likely to occur as children grew older, as older children are more mobile and their behavior is often more apparent to raters (caregivers) and therefore more likely to be rated accurately. This means that construct bias may be more likely to influence rating frequency of infant behavior than that of older children. This may explain why the effect of social desirability on the CGR continued after the effect of social desirability on the ECBQ ceased. However, this suggestion should be investigated in more detail in future.
Cultural differences were also found in scale score levels. First, the mean scale scores for the Negative Affectivity factor (Discomfort, Fear, Sadness, and Shyness) were higher in the Japanese ECBQ and Soothability scores were lower than in the original ECBQ (Putnam et al., 2006). Second, for HIP and Sociability (Surgency/Extraversion factor), Japanese toddlers had significantly lower mean scores. This aligns with previous findings that toddlers in Japan are quieter, more content, and have a lower level of motor activity than those in the United States (Bornstein, 1989; Caudill & Weinstein, 1969).
These well-known cultural differences were replicated in the present study and suggest that the Japanese ECBQ parallels many former Japanese tests of temperament and/or personality (Caudill & Weinstein, 1969; Nakagawa & Sukigara, 2005; Shoji, Soeda, Tsunetsugu, & Maekawa, 1995; Sugawara, Aoki, Kitamura, & Shima, 1988).
It is remarkable that the present study replicated the cultural differences in the temperament scores found by Caudill and Weinstein (1969), particularly as that study is 45 years old. The age difference between their sample (3- to 4-month-old U.S. and Japanese infants) and the present study sample (18-36 months) means that finding the same cultural differences is surprising. This indicates that children’s temperaments and/or caregivers’ expectations for their children do not change so easily over a 45-year period.
Footnotes
Appendix
Scale Definitions: Early Childhood Behavior Questionnaire (Putnam, Gartstein, & Rothbart, 2006).
| Scale label | Definition |
|---|---|
| Activity Level | Level (rate and intensity) of gross motor activity, including rate and extent of locomotion |
| Attentional Focusing | Sustained duration of orienting on an object of attention; resisting distraction |
| Attentional Shifting | The ability to transfer attentional focus from one activity/task to another |
| Cuddliness | Child’s expression of enjoyment in and molding of the body to being held by a caregiver |
| Discomfort | Amount of negative affect related to sensory qualities of stimulation |
| Fear | Negative affect related to anticipated pain, distress, sudden events, and/or potentially threatening situations |
| Frustration | Negative affect related to interruption of ongoing tasks or goal blocking |
| High-Intensity Pleasure | Pleasure or enjoyment related to situations involving high intensity, rate, complexity, novelty, and incongruity |
| Impulsivity | Speed of response initiation |
| Inhibitory Control | The capacity to stop, moderate, or refrain from a behavior under instruction |
| Low-Intensity Pleasure | Pleasure or enjoyment related to situations involving low intensity, rate, complexity, novelty, and incongruity |
| Motor Activation | Repetitive small-motor movements; fidgeting |
| Perceptual Sensitivity | Detection of slight, low-intensity stimuli from the external environment |
| Positive Anticipation | Excitement about expected pleasurable activities |
| Sadness | Tearfulness or lowered mood related to suffering, disappointment, or loss |
| Shyness | Slow or inhibited approach and/or discomfort in social situations involving novelty or uncertainty |
| Sociability | Seeking and taking pleasure in interactions with others |
| Soothability | Rate of recovery from peak distress, excitement, or general arousal |

Declaration of Conflicting Interests
The author(s) declared no potential conflicts of interest with respect to the research, authorship, and/or publication of this article.
Funding
The present study was supported by a Grant-in-Aid (No. 17330143) for Scientific Research from the Ministry of Education, Culture, Sports, Science and Technology of Japan. We are also supported by The Foundation For Children's Future.