
Abstract
Self-report studies often call for assessment of socially desirable responding. Many researchers use the Marlowe–Crowne Scale for its brief versions; however, this scale is outdated, and contemporary models of social desirability emphasize its multi-dimensional nature. The 40-item Balanced Inventory of Desirable Responding (BIDR) incorporates Self-Deceptive Enhancement (honest but overly positive responding) and Impression Management (bias toward pleasing others). However, its length limits its practicality. This article introduces the BIDR-16. In four studies, we shorten the BIDR from 40 items to 16 items, while retaining its two-factor structure, reliability, and validity. This short form will be invaluable to researchers wanting to assess social desirability when time is limited.
Keywords
Socially desirable responding (SDR) in self-reports is a key concern for survey researchers. A critical assumption of self-report surveys is that respondents accurately bring to mind-relevant information and attempt to provide honest responses (McIntire & Miller, 2000). To the extent that individuals instead provide socially desirable responses (over-reporting positive behavior or under-reporting negative behavior), the validity of survey scores could be compromised.
Social desirability concerns are pervasive across disciplines where self-report questionnaires play an integral role in data collection. As such, attempts to control desirable responding have been made in psychology (Crowne & Marlowe, 1964), management and personnel selection (Goffin & Christiansen, 2003; Thompson & Phua, 2005), marketing (Steenkamp, de Jong, & Baumgartner, 2010), and medicine (Herbert, Clemow, Pbert, Ockene, & Ockene, 1995; Klesges et al., 2004).
Accordingly, social desirability scales are widely used to assess the extent to which individuals bias responses in a self-favoring manner and control for such distortions (Paulhus, 2002). Typically, such response biases are identified by administering an SDR scale alongside scales of interest. A non-significant association between SDR and focal scales implies the scale in question is free from response bias. In the case of a significant association, partialling out effects of SDR shows whether the scale predicts external criteria after variance attributed to social desirability is accounted for (Kam, 2013; Moorman & Podsakoff, 1992).
The ubiquitous problem of SDR has led to a scale proliferation (Paulhus, 1991; Uziel, 2010). The scale most commonly used in the past 60 years is the Marlowe–Crowne Social Desirability Scale (MCSDS; Beretvas, Meyers, & Leite, 2002; Crowne & Marlowe, 1964). This scale comprises 33 items that are either socially desirable but uncommon (approved behaviors) or socially undesirable but common (disapproved behaviors). Individuals scoring high on approved and low on disapproved behaviors display high SDR. According to Crowne and Marlowe (1964), SDR on their scale represents a single latent construct—need for approval.
Despite being the most frequently cited SDR scale, the MCSDS’s length, outdated wording, and low reliability limits its practicality (Ballard, Crino, & Rubenfeld, 1988; Beretvas et al., 2002; Stöber, 2001). Several 10- to 20-item short forms of the MCSDS have been developed to address the first of these concerns (Ballard, 1992; Reynolds, 1982; Stöber, 2001; Strahan & Gerbasi, 1972). However, with the exception of Stöber’s version, item wordings are unchanged and, thus, remain outdated. Moreover, the MCSDS, including its short forms, represent SDR as unidimensional; item selection was based on items’ correlations with the principal factor, need for approval. However, there is no clear evidence supporting the fit of a one-factor “need for approval” model to scores on the various MCSDS forms (Barger, 2002; Leite & Beretvas, 2005; Paulhus, 1984; Stöber, Dette, & Musch, 2002).
This issue of dimensionality in SDR has long been disputed (Crowne & Marlowe, 1964; Damarin & Messick, 1965; Sackeim & Gur, 1978). Paulhus (1984) conducted factor analyses of various SDR measures and consistently obtained two factors: impression management (IM) and self-deceptive enhancement (SDE). In Paulhus’s (1984) original conceptualization, IM, similar to Marlowe and Crowne’s need for approval, signifies a tendency to give inflated self-descriptions to an audience: a conscious dissimulation of responses to create a socially desirable image. Conversely, SDE represents a tendency to give honest but positively biased reports (Paulhus, 1984): a non-conscious inclination to perceive oneself favorably. Since his original proposal for a two-factor structure, Paulhus and Reid (1991) have argued for a three-factor structure, in which SDE can be further divided into self-deceptive enhancement and self-deceptive denial, and more recently, a two-tiered construct model crossing content (agentic vs. communal) with responsiveness to audience manipulation (public vs. private; Paulhus & Trapnell, 2009). The issue of dimensionality of SDR is ongoing (Gignac, 2013; Lanyon & Carle, 2007; Leite & Beretvas, 2005).
To operationalize the two-factor SDR model, Paulhus (1991, 1998) developed the Balanced Inventory of Desirable Responding (BIDR). The BIDR contains 40 items: 20 IM items and 20 SDE items. The BIDR is a robust measure showing satisfactory internal consistency and test–retest reliability (Paulhus, 1994). Many researchers who use the BIDR continue to calculate the two originally conceived subscales. These subscales have discriminant validity, with IM (but not SDE) showing sensitivity to variations in anonymity (higher scores in public than private), and SDE (but not IM) predicting overconfidence, hindsight, and overclaiming (Paulhus, 1994).
Paulhus (1984) highlights the implications of ignoring SDR’s multidimensionality, arguing the absence of a correlation between a focal measure and a unidimensional SDR scale (e.g., MCSDS) does not necessarily mean there is no SDR in that measure. Efforts to control SDR must address both dimensions. The BIDR affords flexibility by allowing control of either one or both components, depending on the focal scale(s) of interest.
The BIDR enjoys widespread use across varied disciplines. However, many researchers may be reluctant to use the 40-item scale. The addition of a long scale to an existing study may increase transient measurement errors, as respondents become frustrated or respond carelessly due to boredom or fatigue (Schmidt, Le, & Iles, 2003). Instead, researchers may opt to use a short form MCSDS which only captures the IM dimension of SDR. As far as we are aware, there are no English-language short forms of the BIDR (Leite & Beretvas, 2005). The validation of SDR scale short forms is a serious concern given the costs of including a long MCSDS or BIDR together with focal measures. This lack of valid yet practical scales may prevent researchers from identifying and controlling for unwanted SDR variance.
In this article, we report four studies in which we shorten the BIDR from 40 items to 16 items, retaining its two-factor structure, reliability, and validity. We hope the BIDR-16 can be implemented when a longer measure is impractical. Study 1 uses confirmatory factor analysis (CFA) on datasets containing the BIDR-40 to shorten the BIDR and provides preliminary construct validity evidence by showing comparable relationships between both BIDR forms and external correlates. Study 2 replicates the CFA findings using an independent sample with administration of the BIDR-16 only. Study 3 examines test–retest reliability of the BIDR-16. Study 4 cross-validates the BIDR-16 with external correlates.
We used the following external criteria: (a) self-enhancement measures to validate the short SDE scale, (b) a short form MCSDS to validate the short IM scale, and (c) the Big Five personality traits (John & Srivastava, 1999) to show divergent relations with SDE and IM. We expected the BIDR-16 would show correlational patterns consistent with the BIDR-40 in direction and magnitude. Concerning (a), overclaiming and overconfidence correlate positively with SDE but not IM (Paulhus, 1994). Such propensities are also characteristic of individuals high in subclinical narcissism and self-esteem (Campbell, Goodie, & Foster, 2004; Greenberger, Chen, Dmitrieva, & Farrugia, 2003). Accordingly, we anticipated (in Studies 1 and 4) that correlations of SDE with measures of self-esteem and narcissism would be positive and stronger than with IM. Concerning (b), unidimensional SDR measures typically correlate strongly with IM and weakly with SDE (Paulhus & Reid, 1991). In Study 4, we expected a short form MCSDS to correlate more strongly with IM than SDE using the BIDR-16. Concerning (c), SDE and IM show different relations with key personality traits. In a meta-analysis, Li and Bagger (2006) report that SDE correlated most strongly with emotional stability, followed by conscientiousness and extraversion, then agreeableness and openness. Conversely, IM correlated most strongly with conscientiousness and agreeableness, followed by emotional stability, extraversion, and openness. We expected to replicate these patterns with the BIDR-16 in Study 4.
Study 1
Study 1 examined datasets that included the BIDR-40 (Paulhus, 1991, 1998). We aimed to evaluate the BIDR-40 on model fit and dimensionality and to refine it into a shortened theory-grounded model consistent with the original 40-item version. A secondary aim was to provide preliminary validation for the BIDR-16 subscales by demonstrating equivalent relationships between the BIDR-40 and BIDR-16 and self-enhancement measures (self-esteem, narcissism).
Method
Participants
Eight datasets 1 contained 1,948 participants (1,479 women, four undisclosed; Mage = 23.28, SD = 8.30, range = 16-73). Of these, 854 were from the United Kingdom, 815 from the United States, and 279 from other countries, including Australia, Canada, Europe, and East Asia (one undisclosed).
Materials and procedure
Participants completed the BIDR-40 (Paulhus, 1991, 1998) 2 comprising 20 SDE items (α = .70) and 20 IM items (α = .78) rated on 7-point scales (1 = strongly disagree, 7 = strongly agree), following Stöber et al.’s (2002) and Kam’s (2013) recommendations for continuous rather than dichotomous scoring.
Participants completed one of three self-esteem measures. Participants completing the Rosenberg (1965) Self-Esteem Scale (RSES; α = .88-.90, n = 1,299) rated 10-items such as “I have a number of good qualities” (1 = strongly disagree, 4 [or 11] = strongly agree). Those completing the Single-Item Self-Esteem measure (n = 212; Robins, Hendin, & Trzesniewski, 2001) rated the item “I have high self-esteem” (1 = disagree strongly; 11 = agree strongly). Those completing the Self-Liking Self-Competence Scale–Revised (α = .91, n = 198; Tafarodi & Swann, 2001) rated 16-items such as “I feel great about who I am” (1 = disagree strongly, 7 = agree strongly). We used standardized scores from these scales to compute a self-esteem index.
Participants completed one of two versions of the Narcissistic Personality Inventory (NPI; Raskin & Terry, 1988): the NPI-40 (αs = .80-.87, n = 564), or NPI-15 (Schütz, Marcus, & Sellin, 2004; αs = .82, n = 760). In each measure, participants choose which statement is most true of them (e.g., “I like to be the center of attention” [high-narcissistic]/“I prefer to blend in with the crowd” [low-narcissistic]). We used standardized scores from these scales to compute a narcissism index.
Analytic Strategy
Because data were collected with BIDR versions 6 and 7, we removed items that differed between versions. Using the remaining 36-items, we followed three analytic strategies practiced in CFA (Jöreskog, 1993) to identify an optimal subset of items. First, we used a strictly confirmatory approach to test the fit of a 36-item, two-factor model to the entire Study 1 sample and four subsamples (divided by nation and gender). Second, we used a model generating strategy to modify and test increasingly refined models by removing weakly loading items, preserving the two-factor structure, and retaining/improving model fit. Finally, we used the alternative model strategy, to test whether the proposed two-factor model fit better than a one-factor model, consistent with SDR theory (Paulhus, 1984, 2002). All structural analyses were aimed at developing and confirming a theory-grounded model that is consistent with the BIDR-40.
We assessed goodness of fit of each CFA model using maximum likelihood chi-square (χ2), goodness-of-fit index (GFI) and comparative fit index (CFI), root mean square error approximation (RMSEA), and standardized root mean residual (SRMR). A good-fitting model is indicated by a non-significant chi-square test, GFI and CFI indices of at least .90 (Bentler & Bonett, 1980), and RMSEA and SRMR indices below .08 (Hu & Bentler, 1998). Several authors have noted that the model chi-square test, due to its sensitivity to sample size, is unacceptably conservative (e.g., Bentler & Bonett, 1980). Given our large sample sizes, it was unlikely we would obtain non-significant chi-square tests.
Results and Discussion
A priori measurement model
First, we subjected the initial 36-item, two-factor model to CFA using LISREL 8.80 (Jöreskog & Sörbom, 2006) to analyze the covariance matrix. Indicators suggested a reasonable fit to the data, χ2(593, N = 1,850) = 3,627.04, GFI = .89, CFI = .84, RMSEA = .058 (90% confidence interval [CI] = [.057, .060]), SRMR = .06. In general, the CFI shows an undesirable feature—namely, this fit index decreases with an increasing number of indicators per latent variable (Kenny & McCoach, 2003). Thus, it is not surprising that only the RMSEA and the SRMR evidence good fit in the present CFA (18 indicators per latent variable). In an attempt to refine the BIDR, we adopted a model generating strategy and tested a series of two-factor models with fewer items.
Model generating: Refining the initial factor structure
We refined the model by eliminating items with factor loadings and R2 < .30 (Brockway, Carlson, Jones, & Bryant, 2002). Although we would have preferred to maintain high reliabilities (α ≥ .70), previous research has demonstrated the internal consistency of both SDE and IM is typically below or around .70 (Li & Bagger, 2007). Our results for the BIDR-40 replicate such findings (Table 1). Nonetheless, using the model generating approach, we examined a two-factor model with 10 items per factor. This model evinced improved fit from the 36-item version, χ2(169, N = 1,850) = 1,417.00, GFI = .92, CFI = .88, RMSEA = .067 (90% CI = [.065, .071]), SRMR = .06. We further refined the model by testing eight items per factor. This model also provided acceptable fit, χ2(103, N = 1,850) = 913.92, GFI = .93, CFI = .88, RMSEA = .067 (90% CI = [.066, .074]), SRMR = .05. Table 2 displays item loadings for the resulting BIDR-16.
Descriptive Statistics and Alpha Reliabilities for Studies 1-4.

Note. SDE = self-deceptive enhancement; IM = impression management.
Factor Loadings Per Sample for the Two-Factor BIDR-16 Model in Study 1.

Note. Item numbers correspond to the BIDR version 6. The loadings are from the completely standardized solution of a maximum likelihood CFA. Missing values were deleted using LISREL 8.80 listwise procedures. BIDR = Balanced Inventory of Desirable Responding; SDE = self-deceptive enhancement; IM = impression management; CFA = confirmatory factor analysis.
n = 1,850.
n = 1,405.
n = 440.
n = 814.
n = 778.
Strictly confirmatory: Testing subsample generalizability
We assessed how well the 16-item, two-factor model fit across four subsamples: per nation (the United Kingdom, the United States) and per gender (Table 2). For each nation and gender, the refined model fit reasonably well; the United Kingdom: χ2(103, N = 814) = 471.50, GFI = .93, CFI = .84, RMSEA = .069 (90% CI = [.063, .075]), SRMR = .06; the United States: χ2(103, N = 778) = 429.30, GFI = .93, CFI = .91, RMSEA = .069 (90% CI = [.063, .075]), SRMR = .05; women: χ2(103, N =1,405) = 672.17, GFI = .92, CFI = .90, RMSEA = .067 (90% CI = [.063, .072]), SRMR = .05; men: χ2(103, N = 440) = 331.95, GFI = .92, CFI = .83, RMSEA = .070 (90% CI = [.062, .079]), SRMR = .07
Alternative model: Is the BIDR unidimensional?
We first tested a 36-item, one-factor model. This evinced a poorer fit to the data than the two-factor model: χ2(594, N = 1,850) = 4,799.26, GFI = .83, CFI = .77, RMSEA = .074 (90% CI = [.073, .076]), SRMR = .07, with a difference of 1 df, the χ2Difference = 1172.22. As the χ2Difference > 1,000, a p value cannot be computed; however, Akaike information criterion (AIC) values of the one- and two-factor models (6,798.94 and 4,489.57, respectively) suggest the two-factor solution produces a better fit to the data. We next tested the 16-item, one-factor model. This also evinced a poorer fit to the data than the two-factor model: χ2(104, N = 1,850) = 1,571.27, GFI = .88, CFI = .79, RMSEA = .099 (90% CI = [.096, .103]), SRMR = .07, with a difference of 1 df, the χ2Difference = 657.35, p < .001. The one-factor model fit the data poorly for all subgroups. 3
The two-factor BIDR-16 fit the data relatively well. Reduction of more than half the items did not weaken the structural validity of the BIDR; in fact, it reinforced it—AIC values for the short version were lower than for the full version (1,104.39 and 4,489.57, respectively).
External correlates
We garnered preliminary validity evidence for the BIDR-16 subscales (Table 3). Replicating past findings (Greenberger et al., 2003), we obtained a positive correlation between SDE and IM. SDE correlated more strongly with self-esteem than did IM, z = 15.90, p < .001. 4 SDE also correlated more strongly with narcissism than did IM, z = 5.67, p < .001. In line with previous research (Paulhus, 1998), we found evidence that SDE and IM show differential relations with self-enhancement. Furthermore, the BIDR-16’s pattern of correlations mirror those of the BIDR-40 (Table 3): SDE from each version correlated with self-esteem equally strongly, z = 1.34, ns, and IM from each version correlated with self-esteem equally strongly, z = −1.78, ns. Moreover, SDE from the BIDR-40 and BIDR-16 correlated with narcissism equally, z = 1.75, ns, and IM from each version correlated with narcissism equally, z = 0.34, ns. Thus, our item refinement preserved the meaning and utility of SDE and IM in relation to self-enhancement.
Correlations Between the BIDR-40, BIDR-16, and Existing Scales in Study 1.

Note. BIDR = Balanced Inventory of Desirable Responding; IM = impression management; SDE = self-deceptive enhancement.
p < .05. **p < .005. ***p < .001.
Study 2
Study 2 attempted to replicate the CFA findings obtained in Study 1 using an independent sample. Study 1 relied on administration of the BIDR-40; however, in Study 2, we administered the BIDR-16 alone in an attempt to validate further the brief version.
Method
Participants
Participants included 670 (487 women, one unidentified) online volunteers recruited via research websites (e.g., http://psych.hanover.edu/research/exponnet.html); Mage = 29.43, SD = 12.62, range = 16-70. They were from the United Kingdom (n = 343), the United States (n = 204), Europe (n = 44), Australasia (n = 33), Canada (n = 17), Indian subcontinent (n = 9), East Asia (n = 8), Africa (n = 5), Central/South America (n = 5), and the Middle-East (n = 2), and included students (n = 285) and non-students (n = 385).
Materials and procedure
Participants completed self-report measures via the Internet without compensation. After providing demographic information, they completed the BIDR-16 (1 = totally disagree, 8 = totally agree).
Results and Discussion
We used CFA to assess the goodness of fit of our refined 16-item, two-factor model. The results suggest a close fit to the data: χ2(103, N = 670) = 405.60, GFI = .92, CFI = .90, RMSEA = .07 (90% CI = [.06, .08]), SRMR = .06. As in Study 1, a one-factor model evidenced an unacceptable fit: χ2(104, N = 670) = 612.99, GFI = .88, CFI = .83, RMSEA = .09 (90% CI = [.08, .10]), SRMR = .07; with a difference of 1 df, the χ2Difference = 207.39, p < .001. Thus, the data suggest that the BIDR-16 more likely reflects two dimensions than a single SDR dimension.
Study 3
In Study 3, we examined the test–retest reliability of the BIDR-16 over a 2-week interval. Previous research using the BIDR-40 revealed test–retest correlations of r = .69 for SDE and r = .65 over 5 weeks (Paulhus, 1991).
Method
Participants
Participants included 352 (219 women) students from a University in the United Kingdom (Mage = 20.46, SD = 3.80, range = 20-51).
Materials and procedure
Participants completed several measures via the Internet at two time points, two weeks apart. After providing demographic information, participants completed measures in randomized order, including the BIDR-16 (1 = totally disagree, 8 = totally agree). Participants received ₤5 for participating.
Results and Discussion
Table 1 presents descriptive statistics for SDE and IM. Scores on the BIDR-16 were stable over a two week period, with test–retest reliability for SDE, r = .79, p < .001, and for IM, r = .74, p < .001, which are in the same order of magnitude as the BIDR-40 (Paulhus, 1991).
Study 4
The goal of Study 4 was to assess the construct validity of both BIDR-16 subscales using another independent sample. We examined the extent to which SDE and IM correlated with a commonly used SDR scale, self-enhancement indices, and Big Five personality traits.
Method
Participants
Participants included 708 (564 women) online volunteers, recruited via research websites as in Study 2 (Mage = 22.30, SD = 8.26, range = 16-74). Most were from the United States (n = 477) and the United Kingdom (n = 174), others from Canada (n = 17), Australasia (n = 14), Europe (n = 14), East Asia (n = 6), and other regions or undeclared (n = 7), and included students (n = 588) and non-students (n = 120).
Materials and procedure
Participants completed self-report measures via the Internet without compensation. After providing demographic information, they completed measures in randomized order. In addition to the BIDR-16 (1 = totally disagree, 8 = totally agree), participants completed scales for construct validation purposes.
We assessed SDR with a 10-item short form of the MCSDS (Strahan & Gerbasi, 1972, α = .55). 5 Items include, “I have never intensely disliked anyone” (true/false).
We assessed self-enhancement with the RSES (α = .89; 1= strongly disagree, 6 = strongly agree), the NPI-40 (α = .85), and a brief version of the How-I-See-Myself scale (B-HSM; Campbell, Rudich, & Sedikides, 2002, α = .75). Participants rated themselves (1 = much less than the average person, 6 = much more than the average person) on eight adjectives (e.g., assertive, kind).
We assessed personality traits with the Ten-Item Personality Inventory (Gosling, Rentfrow, & Swann, 2003), and report the correlation between each of the five-item pairs. Respondents rated themselves (1 = strongly disagree, 6 = strongly agree) on 10-trait pairs: Extraversion: for example, extraverted, enthusiastic, r = .47, p < .001; Emotional stability: for example, anxious, easily upset, r = .52, p < .001; Openness: for example, open to new experiences, complex, r = .22, p < .001; Conscientiousness: for example, dependable, self-disciplined, r = .39, p < .001; Agreeableness: for example, critical, quarrelsome, r = .11, p < .005.
Results and Discussion
SDR
The BIDR-16 index of SDE correlated modestly with IM (Table 4), with equal magnitude to Study 1, z = −0.51, ns. Table 4 shows that the MCSDS correlated more strongly with IM than with SDE, consistent with Paulhus and Reid (1991).
Correlations Between BIDR-16, SDE and IM, and Existing Scales in Study 4.
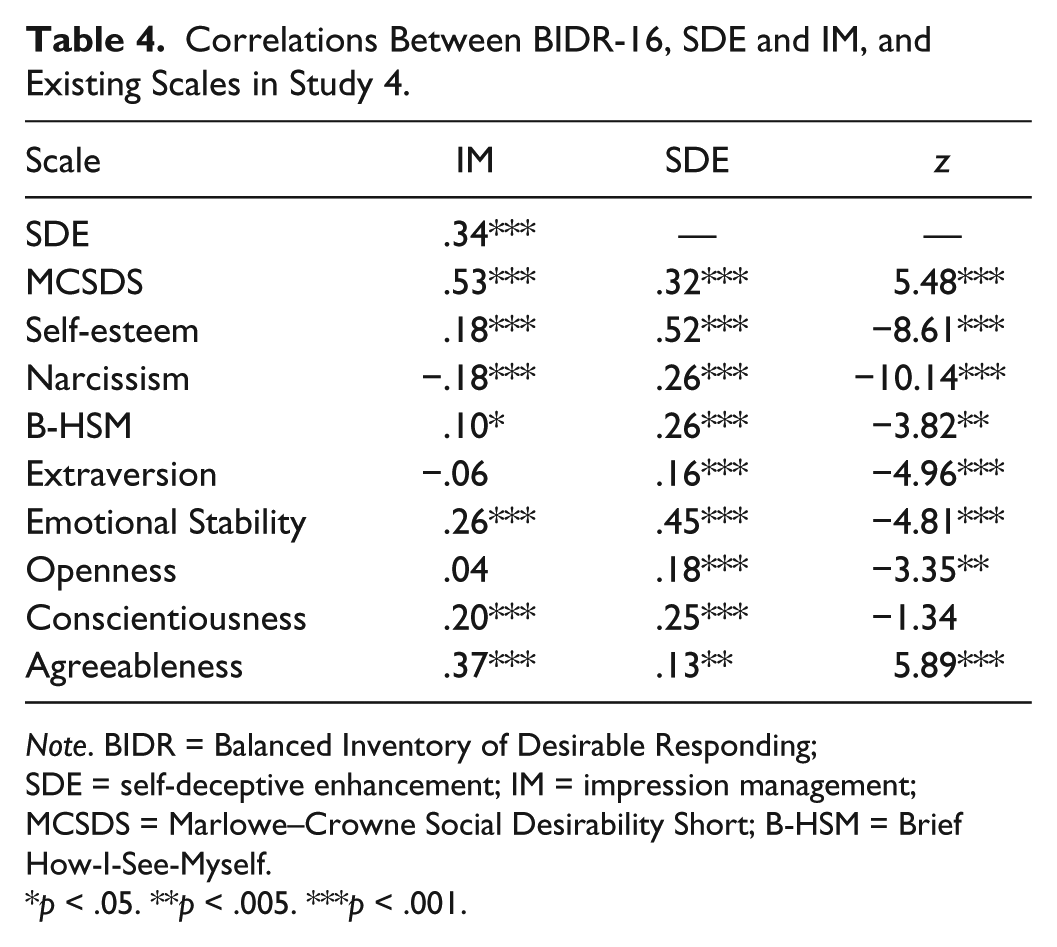
Note. BIDR = Balanced Inventory of Desirable Responding; SDE = self-deceptive enhancement; IM = impression management; MCSDS = Marlowe–Crowne Social Desirability Short; B-HSM = Brief How-I-See-Myself.
p < .05. **p < .005. ***p < .001.
Self-enhancement
The present study evidenced similar positive correlations to those in Study 1 between SDE and self-esteem, z = 0.31, ns, and IM and self-esteem, z = −1.40, ns, with SDE correlating more strongly with self-esteem than IM. SDE correlated positively with narcissism (Table 4), as in Study 1 but more strongly, z = −2.86, p = .004. IM correlated negatively with narcissism, as in Study 1 but more strongly, z = 3.46, p < .001, mirroring the pattern of results found by Borkenau and Zaltauskas (2009). Finally, the correlation between B-HSM and SDE was larger than the correlation between B-HSM and IM (Table 4). Thus, all self-enhancement indices related positively to SDE but weakly or negatively to IM.
Personality traits
SDE correlated positively and most strongly with emotional stability, followed by conscientiousness, openness, extraversion, and agreeableness (Table 4). IM correlated positively and most strongly with agreeableness, followed by emotional stability and conscientiousness, and did not correlate with extraversion or openness. Such relations are consistent with those reported by Li and Bagger (2006).
General Discussion
SDR continues to present a challenge to self-report measurement (Stöber et al., 2002). This ubiquitous problem has led to the development of many scales over the years to screen for biased responding. The most popular scale is the MCSDS (Crowne & Marlowe, 1964), despite criticisms of its low reliability, outdated wording, and unidimensional factor structure (e.g., Beretvas et al., 2002). Paulhus (1991, 1998) developed the BIDR-40, which captures the two-dimensional nature of SDR, and provides an important theoretical and empirical extension to SDR research; however, short forms of the MCSDS are often preferred because of the BIDR’s length. The aim of this research was to create a shorter version of the BIDR, which is psychometrically equivalent, that is, retains the original scale’s two-factor structure, reliability, and validity.
Accordingly, in Study 1, we evaluated the BIDR-40 on model fit and dimensionality and refined the original scale, reducing to 16-items while maintaining model fit. The resulting BIDR-16 displayed superior fit for a two-factor than a one-factor model, confirming it reflects two dimensions (SDE and IM). The two short form scales remained conceptually similar to those of the long form, as demonstrated by high correlations between the short and long form and by similar correlations of the long and short forms with external correlates. Study 2 replicated the CFA findings using an independent sample administering only the BIDR-16. Study 3 provided evidence for the temporal stability of the BIDR-16, and Study 4 provided further evidence of the validity of the BIDR-16, replicating previous relationships between the long form and measures of SDR, self-enhancement, and personality traits.
Controversy over the dimensionality of SDR is ongoing. Many researchers who use the BIDR-40 continue to calculate the two originally proposed subscales, IM and SDE, and in this respect, the BIDR-16 represents an excellent substitute for the long version. To the extent that SDR is best represented by a three-factor (Paulhus & Reid, 1991) or four-factor structure (Paulhus & Trapnell, 2009), then we can only claim to measure two of the three or four types of SDR.
In all, using large and relatively diverse samples, this research provides evidence that scores on the BIDR-16 are adequately reliable and valid; demonstrating this shortened scale is a reasonable substitute for the BIDR-40 in studies where length of assessment is a concern. With eight items per subscale, the BIDR-16 is short enough to reduce transient errors that may occur as a result of fatigue or boredom but long enough for participants to get into a suitable mind-set for responding to items. Although internal consistencies of the BIDR-16 are relatively low (i.e., not always exceeding .70), they are comparable with those of the BIDR-40 (Li & Bagger, 2007). Moreover, given that internal consistency indexes construct breadth (Clark & Watson, 1995), the BIDR’s moderate internal consistency is a reflection that SDE and IM, respectively, entail a broad range of self-enhancement and IM instantiations. Importantly, the high-test–retest correlations of SDE and IM attest to their high reliability. The studies outlined here demonstrate the validity of our shortened scale. Future research using the BIDR-16 will continue to build its nomological network.
Many nations have recently started collecting large-scale and nationally representative data. These samples often ignore the important issue of SDR, perhaps in part because of scale length. We hope the BIDR-16 proves useful in this regard. We believe the BIDR-16 offers researchers advantages over previously available scales, making it more practical to assess validly and to control for both SDR dimensions.
Footnotes
Declaration of Conflicting Interests
The author(s) declared no potential conflicts of interest with respect to the research, authorship, and/or publication of this article.
Funding
The author(s) received no financial support for the research and/or authorship of this article.