
Abstract
This study explores the relationships among indicators of overtraining in adolescent athletes. The research employed widely-accepted tools for subjective overtraining indicator detection, as identified through a systematic review. Two groups of athletes were observed, comprising 13 athletes with bi-weekly assessments and 66 athletes with assessments every 3 months over a one-year period. The study analyzed relationships between variables using repeated measures correlations. A correlation matrix was subjected to principal component analysis. Three fundamental groups of indicators, reflecting negative emotionality (accompanied by sleep problems), self-concept characteristics, and core symptoms of overtraining syndrome captured through subjective sport fitness and vigor. This research emphasizes the intrinsic link between emotional and physical aspects in the lives of elite athletes, shedding light on the complex interplay of overtraining indicators in the context of adolescent developmental period.
Plain Language Summary
This research looked into subjective signs of overtraining in young elite athletes. We examined a set of commonly used self-report methods and tried to identify their mutual relationship to be able to suggest a more efficient way of monitoring young athletes’ health in sport practice. We observed two groups of athletes over a year: one group was checked every two weeks, and the other every three months. The results showed three main groups of indicators: first group of indicators related to negative emotionality, second group connected to self-concept characteristics, and the last one based on vigor and sport fitness.
Introduction
In the highly competitive environment of elite sport, intensive training is a necessary condition for success. Young athletes who aspire to the highest goals must commit to a training program that often includes several hours of training per day. Therefore, it is understandable that such long-term training loads are a significant source of stress for athletes. In order for the athlete to successfully cope with this stress and to achieve the expected improvement and optimization of performance, training must be supplemented with adequate rest and recovery. Thus, the specific mix of training and rest (depending on the individual’s characteristics) ultimately determines the adaptive or maladaptive response to the stress experienced.
According to Meeusen et al. (2013), normal training and functional overreaching can be differentiated from non-functional overreaching (NFOR) and overtraining syndrome (OT) on the basis of the combination of training intensity and amount of rest. While normal training and functional overreaching are characterized by intense training efforts, which are, however, supplemented by adequate rest periods, the development of non-functional overreaching or even overtraining syndrome occurs when the recovery phase is inadequate over a long period of time. As noted by Goodger and Jones (2012), historically, overtraining has often been confused with athlete burnout, as they have a number of accompanying manifestations in common. Peterson (2005) claims that the key differentiating symptom is the presence or absence of loss of motivation. Whereas overtrained athletes remain highly motivated to continue with sporting activity despite a decline in performance, athletes with burnout lose the motivation to keep training. In general, the definitions of overtraining presented by different authors are in fairly close agreement and consider the presence of underperformance associated with fatigue as the key characteristic of this syndrome, emphasizing its long-term nature and the presence of negative symptoms affecting non-sporting areas of life. One of the first articulated definitions can be found in a study by Budgett (1998, p. 107), who defined overtraining syndrome as “a condition of fatigue and underperformance, often associated with frequent infections and depression, which occurs following hard training and competition. The symptoms do not resolve despite two weeks of adequate rest, and there is no other identifiable medical cause.”
Systematic Review of Subjective Indicators of NFOR/OT
In the literature, NFOR and OT are associated with a variety of indicators (Meeusen et al., 2006). In addition to biological markers (for a comprehensive review, see chapter 5 in Cadegiani, 2020), subjective indicators have received much attention from the scientific community, since they have the undeniable advantage of being easy to measure at minimal cost. These indicators have been shown to be a good tool for screening for NFOR/OT (e.g., Birrer, 2019; Coutts et al, 2007; Grant, 2012). As recommended by Saw et al. (2016), subjective measures can be employed in the implementation of athlete monitoring due to their sensitivity to both acute and chronic training stress. Concurrently, the authors emphasize that this represents a cost-effective and straightforward option, particularly when routine athlete monitoring needs to be conducted repeatedly and over an extended period. According to the literature, the phenomenon of overtraining is manifested at the individual level by a variety of different physical or psychological symptoms (see Table 4.1 in Peterson, 2005, p. 57). A number of tools are used to capture these symptoms as indirect indicators of overtraining. These may be existing methods that have been used to capture a given symptom across different areas of psychology (e.g., the Profile of Mood States in the study by Hooper et al, 1993), newly developed instruments specifically designed to capture overtraining that attempt to measure a wider range of possible manifestations (e.g., the Société Française de Médecine du Sport’s questionnaire in the study by Kargarfard et al., 2018), or ad hoc instruments constructed to target specific symptoms emphasized in a given research project (e.g., in the study by Mackinnon & Hooper, 1996). Based on a systematic search conducted as part of this study, we attempted to map the instruments used in research practice to identify indicators of overtraining.
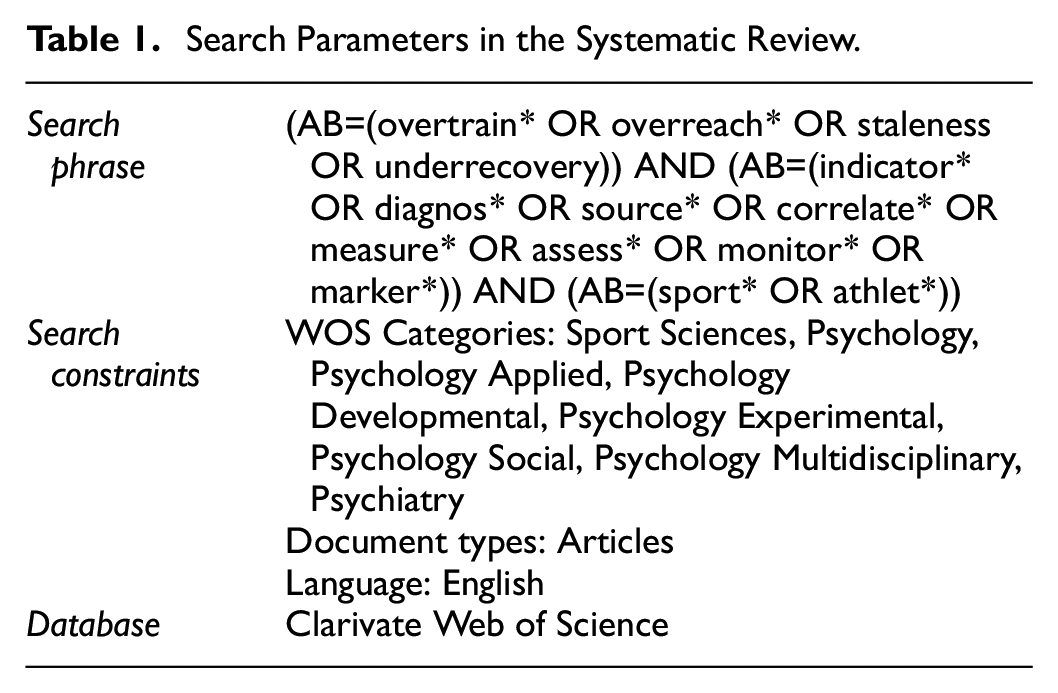
Using the search parameters specified in Table 1, we identified 256 studies. Based on a reading of titles and abstracts, we excluded 60 studies from the search which either were primarily focused on NFOR/OT, but mentioned these constructs only in relation to other phenomena or which were not empirical in nature. In the final stage of the selection of studies, after reading the full texts, we excluded those studies that did not use quantitatively assessed subjective measures of overtraining indicators (these were mostly studies that exclusively used biological markers, physiological indicators, objective measures of performance, or were studies built on qualitative methodology). The final selection of 75 studies that used various quantitative self-report methods is presented in Table 2. This summary shows that the dominant instruments used were the Recovery-Stress Questionnaire Sport (RESTQ-Sport) and the Profile of Mood States (POMS).
Search Parameters in the Systematic Review.
Overview of the Self-report Methods Used to Capture NFOR/OT.

*Including the renamed variant (Brunel Mood States; Terry & Lane, 2003) and also the abbreviated 7-item version used specifically for monitoring training-induced distress (Raglin & Morgan, 1994).
In addition to the standard instruments listed in Table 2, studies also quite frequently use ad hoc constructed methods or short scales aimed at capturing the NFOR/OT indicators described in the literature, such as mental or physical fatigue, lack of energy, muscle soreness, stress, negative mood, sleep problems, heightened illness, lack of appetite, concentration disruption, or loss of motivation (Cullen et al, 2017; Foster, 1998; Gouarné et al, 2005; Haller et al, 2019; Jurov et al, 2020; Magiera et al, 2019; Matos et al, 2011; Nicoll et al, 2018; Snyder et al, 1993; Urhausen et al, 1998).
Based on our systematic review, we can conclude that there exists a wide range of subjective measures of overtraining indicators. As emphasized by Saw et al., (2016), there is no doubt about the utility of those measures (complementary to objective measures) in athlete monitoring. However, Saw, et al. also suggest that it is essential to propose their optimal implementation practices. To establish these practices, it is necessary to delve deeper into the nuanced relationships among these subjective indicators, shedding light on their potential to refine and enhance the assessment of athlete training responses. In this regard, important indicators are not neglected while simultaneously we can prevent athletes from being burdened by redundant measurements.
The aim of our research was to investigate the relationships between subjective indicators of overtraining in an intra-individual longitudinal perspective, while also investigating the relationship of these indicators with subjectively perceived levels of sport fitness. To this end, a sample of respondents was obtained and followed for 1 year at 3-month intervals (a total of five measurements; hereafter referred to as the L5 study). In addition, in order to capture highly variable characteristics, part of the sample was monitored intensively at 14-day intervals (a total of 26 measurements; hereafter referred to as the L26 study).
Method
Procedure and Research Sample
Data was collected over the course of 1 year (November 2018 to November 2019). Initially, data were obtained from 251 respondents from a specialized sports school in Brno, 228 of whom provided a complete vector of responses in the instruments used in this study (females 50.4%, males 49.6%, age 14–19 years, mean age = 16.45, sd = 1.31; from different sports disciplines). Data from this initial measurement (which represents the baseline sample) were utilized to verify the reliability of the individual instruments and scales by assessing their internal consistency.
A total of 132 athletes were invited to participate in the L5 study (5 observations at 3-month intervals). From this pool, we selected respondents on the basis of the following inclusion criteria: a complete vector of responses in at least four waves, participation in sports competitions at regional or higher levels, and regular training more than three times per week (N = 66, females 57.6%, males 42.4%, age 14–19 years, mean age = 16.42, sd = 1.34; in different sports disciplines—most commonly athletics, swimming, and gymnastics).
From these respondents, 18 elite-level athletes were selected (i.e., those who competed at an international level and trained five times per week or more) who were willing to participate in the intensive L26 study (26 observations at 14-day intervals). Only individuals who participated in at least 20 of the 26 measurements were included in the study. The basic data on the selected group are presented in Table 3.
Characteristics of the L26 Research Sample.

The initial data collection was carried out in a school setting using pencil and paper. To ensure that there was no time pressure during the administration of the entire questionnaire battery, two class periods (equivalent to 90 min) were allocated. Subsequent data collections were conducted via an online web-based questionnaire and took approximately 40 min in L5 and 20 min in L26. Participation in the study was voluntary; all participants (and their legal representatives) provided informed consent. All the data were analyzed anonymously.
Instruments
The selection of methods in this study was guided by two essentially conflicting requirements, namely, to cover the full range of subjective NFOR/OT indicators while minimizing the demands of administration for participants. In the selection of methods for the intensive L26 study, the emphasis was understandably on reducing the size the questionnaire, which therefore led to the selection of basic methods with a relatively low number of items (see the list below). For the extensive L5 study, this set of methods was supplemented by more extensive methods and those focusing on constructs of a more enduring nature.
Methods Used in the L26 Study With 14-day Intervals
Sport fitness (SF) was calculated as the mean of three analog scales (scored between 0 and 100) complementing the overtraining questionnaire proposed by Société Française de Médecine du Sport (Varlet-Marie et al., 2004), namely the scales my physical level (great form—bad form), I feel fatigued (more slowly—more quickly), and I recover from my state of tiredness (more quickly—more slowly). Responses were recoded so that higher scores reflected higher sport fitness. The internal consistency of the scale in our sample was satisfactory (McDonald’s ω = .71).
Brunel mood states (BRUMS; earlier also referred to as POMS-A; Terry et al., 1999) is based on the Profile of Mood States (POMS; McNair et al., 1971) and captures transient, distinct mood states. This questionnaire contains 24 items evenly distributed across the following six dimensions: confusion, depression, fatigue, tension, vigor, and anger. Respondents are asked to rate how they felt in the past week on a scale of 0 (none at all) to 4 (extreme). The internal consistency of all scales was satisfactory (all McDonald’s ωs > .80).
Sleep Quality Index (SQI; Chung & Cheung, 2008) is based on the Pittsburgh Sleep Quality Index, with questionnaire items simplified for use with an adolescent population. The questionnaire consists of eight items with verbally anchored responses scored between 0 and 2 that assess various aspects of sleep quality. The internal consistency of the scale was satisfactory (McDonald’s ω = .83).
Short Overtraining Symptoms Questionnaire (SOSQ; Lemyre et al., 2007) contains five items reflecting the core clinical symptoms of overtraining with responses on a 10-point Likert scale. The internal consistency of the scale was satisfactory (McDonald’s ω = 0.79).
Training Distress Scale (TDS; Grove et al., 2014) is a 19-item instrument assessing symptoms of training-related distress. Using a 5-point Likert scale ranging from not at all (1) to an extreme amount (5), respondents were instructed to rate the severity of their training distress manifestations. The internal consistency of the scale was satisfactory (McDonald’s ω = .91).
Methods Used in the L5 Study (in Addition to the L26 Methods) With 3-month Intervals
Athlete Burnout Questionnaire (ABQ; Raedeke & Smith, 2001) is a 15-item instrument used to capture the level of athlete burnout. The questionnaire covers symptoms of psychological/emotional exhaustion, devaluation, and reduced athletic accomplishment. Respondents rated how often they experienced each symptom on a 5-point Likert scale ranging from 1 (almost never) to 5 (most of the time). The internal consistency of the scale was satisfactory (McDonald’s ω = .91).
Recovery-Stress Questionnaire for athletes (RESTQ-sport; Davis IV et al., 2007) identifies the extent to which athletes are physically or mentally stressed and able to recover. The scales used in this study focused on general well-being (WB), fitness/injury (FI), sport efficacy (SE), and sport self-regulation (SR). Each scale contains 4 items with response scales ranging from 1 (never) to 7 (always). The scale reliabilities were adequate (all McDonald’s ωs > .75).
Overtraining Questionnaire (SFMS; Varlet-Marie et al., 2004) is designed as a checklist containing 54 symptoms of overtraining. The total score obtained is the sum of the diagnostic responses (McDonald’s ω = .92).
To enhance clarity, we present basic characteristics of the scales and questionnaires used in a structured format in Table 4.
A Comprehensive List of Instruments Used in This Study.

Data Analysis
The psychometric characteristics of the methods used (i.e., internal consistency by means of McDonald’s ω) were assessed on a sample of 228 individuals who participated in the initial data collection. All subsequent analyses were conducted on the L5 and L26 samples of 66 and 13 individuals respectively, using a 1% level of significance.
The repeated measures correlation method (rmcorr package for R) was used to determine the common within-individual relationship for repeated measures for a group of individuals. This statistical procedure was chosen primarily because it provides high statistical power, as no averaging or aggregation of data is necessary to answer the research questions (Bakdash & Marusich, 2017).
To avoid interpreting spurious correlations caused by common trends in the observed pairs of variables, we performed trend corrections in the computations in the intensive L26 study. For each person and each variable, we identified the best fitting polynomial trend (from the order 0 to 5) based on the BIC index and computed the corresponding residual variables. These variables were then used to calculate a parallel set of repeated measures correlations and the two correlation matrices (raw vs. residual) were compared using Jennrich’s test of matrix equality.
In a subsequent step, the correlation matrix obtained for the L5 study data was subjected to principal component analysis (PCA) to examine the structure of relationships between the variables (Direct Oblimin rotation). Acceptance level of sampling adequacy was indicated using KMO (with cutoff 0.6 as suggested by Tabachnik & Fidell, 2019) and Bartlett’s Test of Sphericity. PCA was performed using IBM SPSS 28.0.
On the basis of the power analysis performed, we can conclude that the sample size and the number of measurements taken allowed us to (power = 80%) capture even relatively weak relationships between variables reliably (for L5: N = 13, k = 23.1, r = .20; for L26: N = 66, k = 4.6, r = .22).
Results
L26 Study
The main aim of the study was to evaluate the associations between the individual indicators of overtraining and also the relationships of these indicators to subjectively perceived performance (Sport Fitness). Given the longitudinal nature of the data and the relatively high number of individual measures, we decided to use repeated measures correlations to estimate the degree of within-subjects associations that allows for the capture of the relationships of the variables over the course of time. The corresponding correlation coefficients are shown in the lower diagonal of Table 5. Since the resulting correlation coefficient represents a generalized trend, it is interesting to show the relationships for each individual. Figure 1 shows the regression lines for each athlete and each pair of variables.
Interrelationships of the Observed Variables in the L26 Study.

Note. SF = Sport Fitness, SQI = Sleep Quality Index, SOSQ = Short Overtraining Symptoms Questionnaire, TDS = Training Distress Scale, BRUMS = Brunel Mood States (T = Tension, V = Vigor, C = Confusion, F = Fatigue, D = Depression, A = Anger). Below the diagonal are the correlation coefficients for the raw scores, above the diagonal are the correlations for the residual scores (df = 286). On the diagonal are coefficients of determination for the relationship between the raw score and the residual score. Correlation coefficients >.15 are statistically significant at the 1% level.
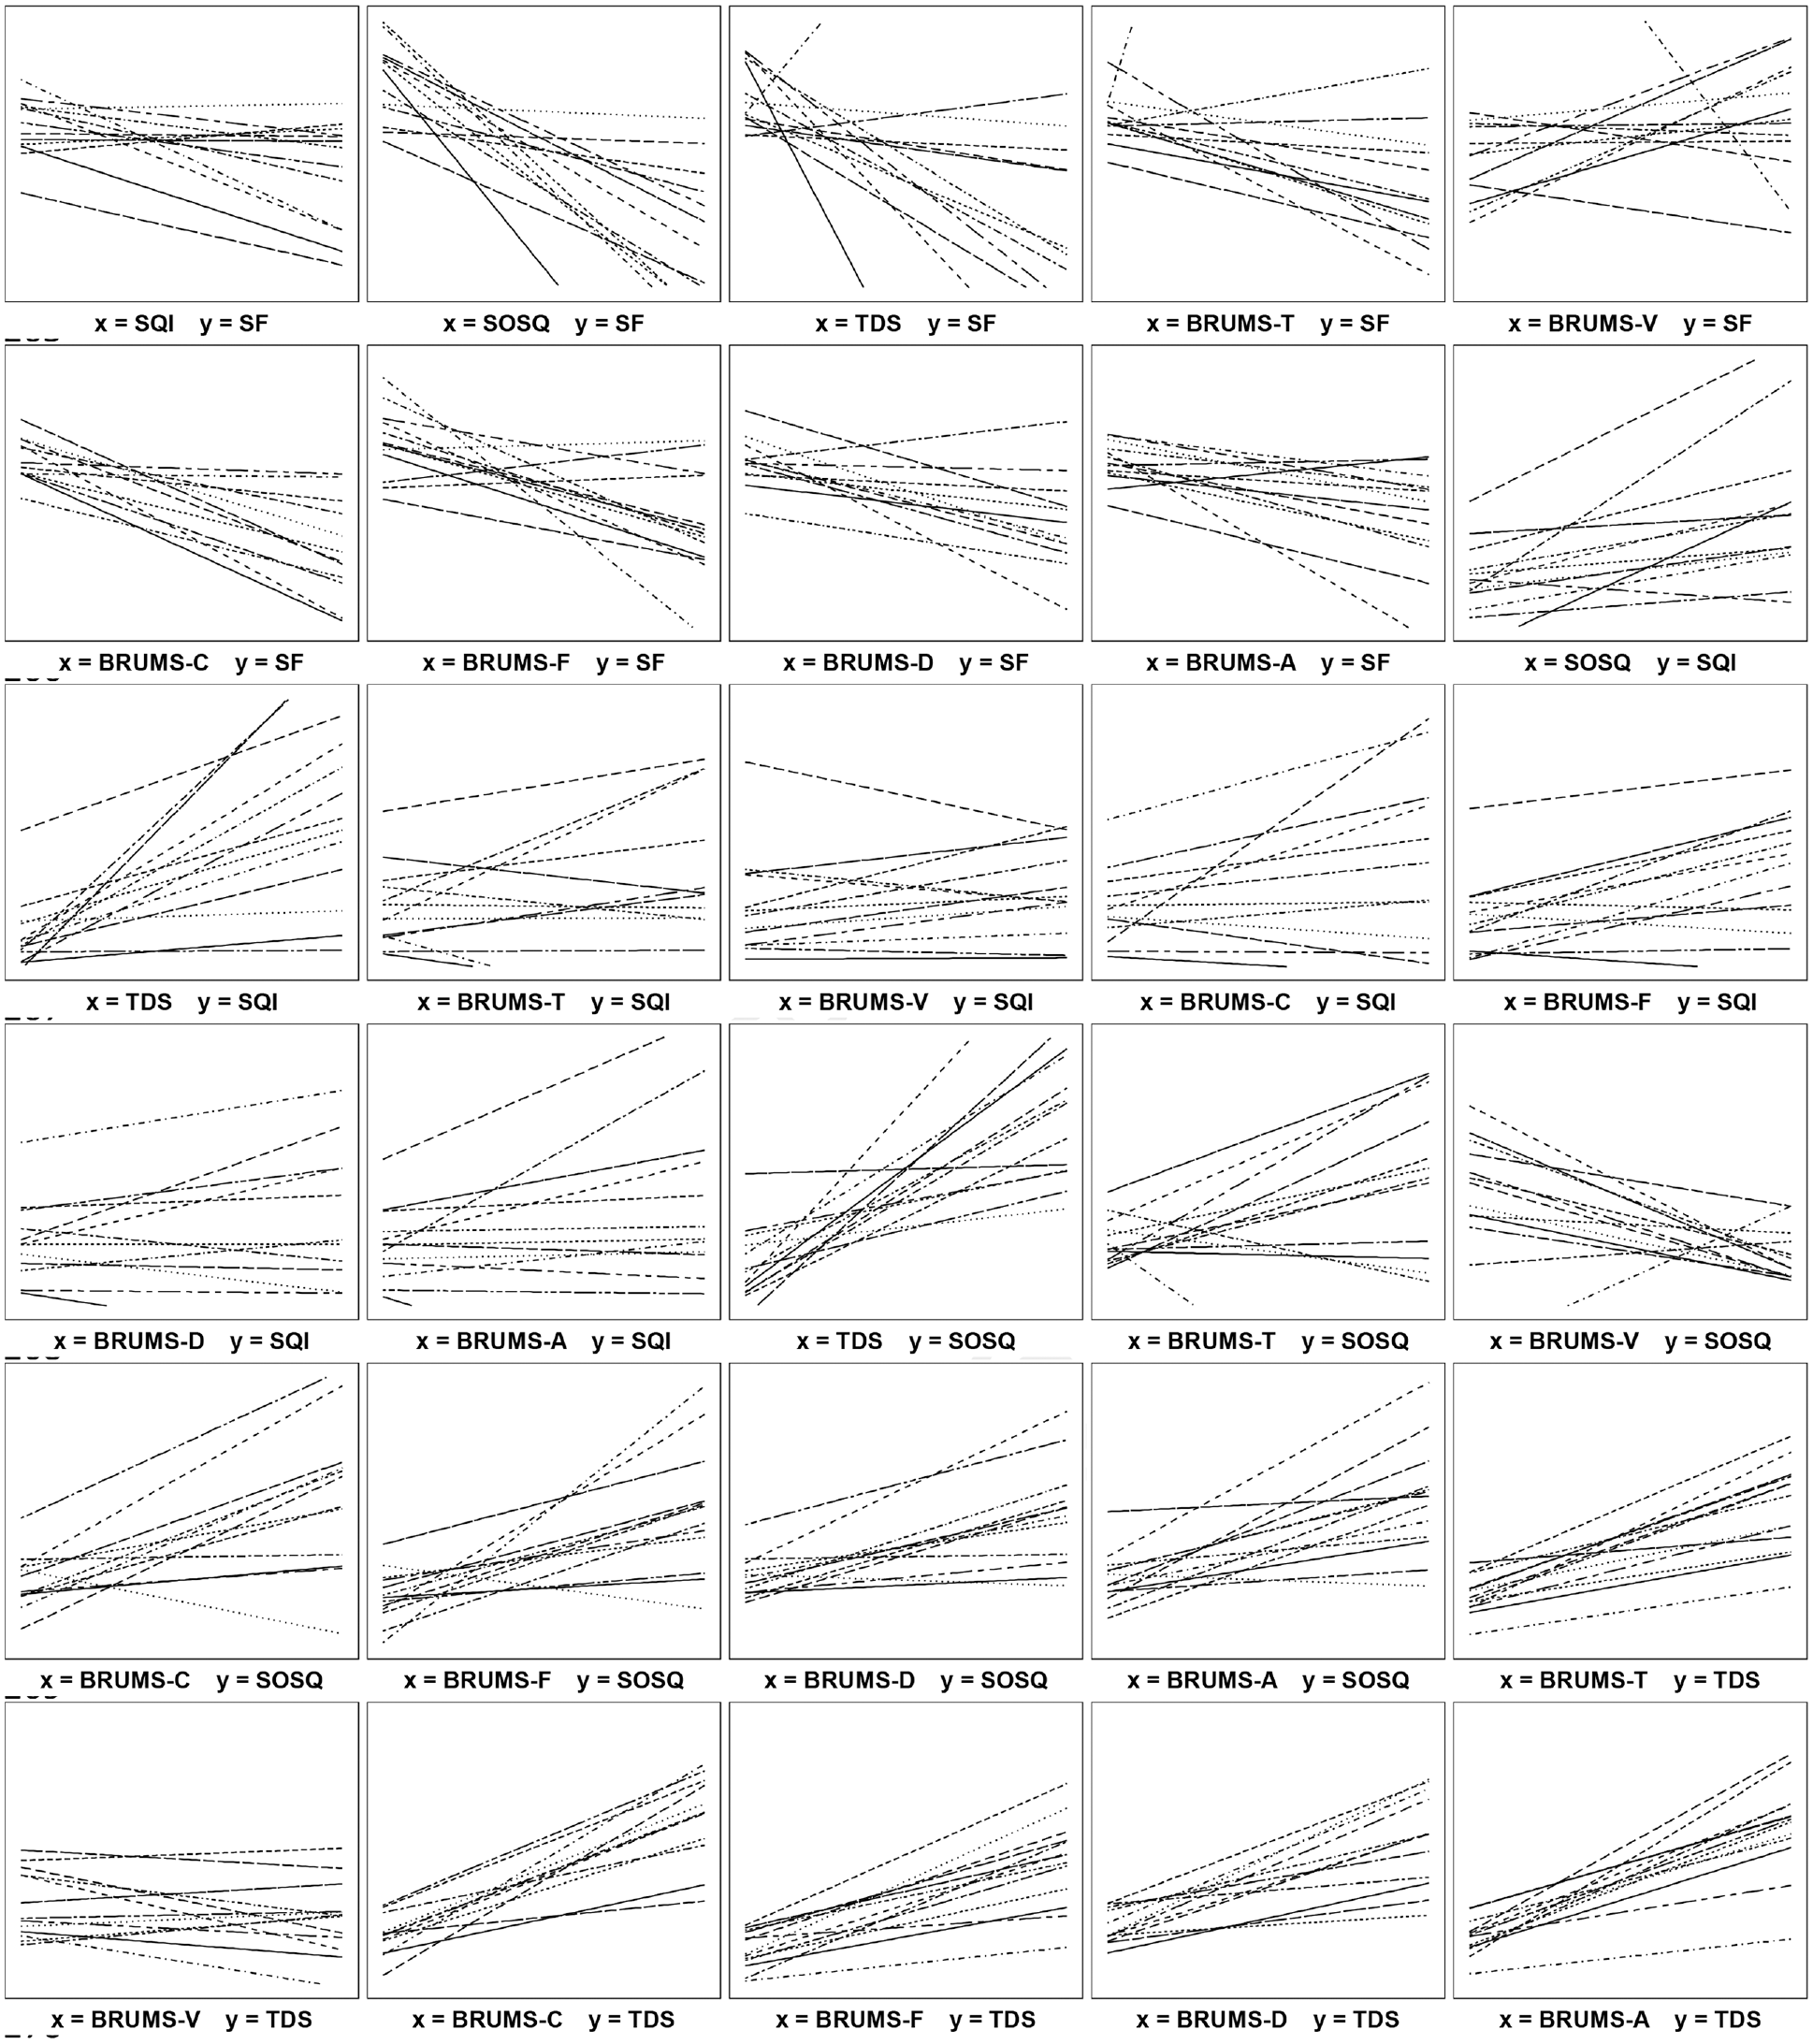
Simple linear regression plots. Each plot depicts thirteen regression lines for the individual respondents.
In general, it can be said that there are relatively strong associations between the variables, with the overall SQI score indicating the weakest relationships to other variables. Regarding the relationship of overtraining indicators to Sport Fitness, SOSQ shows the closest relationship (r = −.52), followed by the BRUMS dimensions and TDS (with correlations of around 0.30). The only statistically insignificant relationship was found for SQI. Very strong relationships were also found between TDS and the BRUMS dimensions (except for Vigor). It should be noted that the repeated measures correlation coefficient represents a generalized estimate of the linear relationship between variables across individuals. Figure 1 demonstrates that even if a significant correlation was found for a particular pair of variables, it does not necessarily mean that the direction of the relationship is identical for all respondents (as seen, e.g., in the relationship between SF and BRUMS-D). However, in the case of closer relationships (around a value of 0.60), the plots suggest that the direction of the relationship is essentially uniform across respondents.
In order to reveal whether correlations between variables are not only due to common linear or non-linear trends, we also calculated repeated measures correlations between the residual scores. These residual scores were always derived from the best fitting polynomial trend (on the basis of the BIC value). The resulting correlations are shown in the upper diagonal of Table 5. Visual inspection of the correlation matrix suggests that the differences between the correlations of the raw scores and the residuals are quite marginal. This conclusion was also confirmed by a formal test of the equality of the correlation matrices which did not reveal statistically significant difference (χ2 = 60.39, df = 45, p = .062).
L5 study
The L5 study was conducted with a larger sample of athletes and administered at 3-month intervals. It used the same methods as the L26 study, but with the addition of the ABQ, RESTQ and SFMS measures. The results are summarized in Table 6.
Interrelationships of the Observed Variables (based on L5 Data, N = 66).
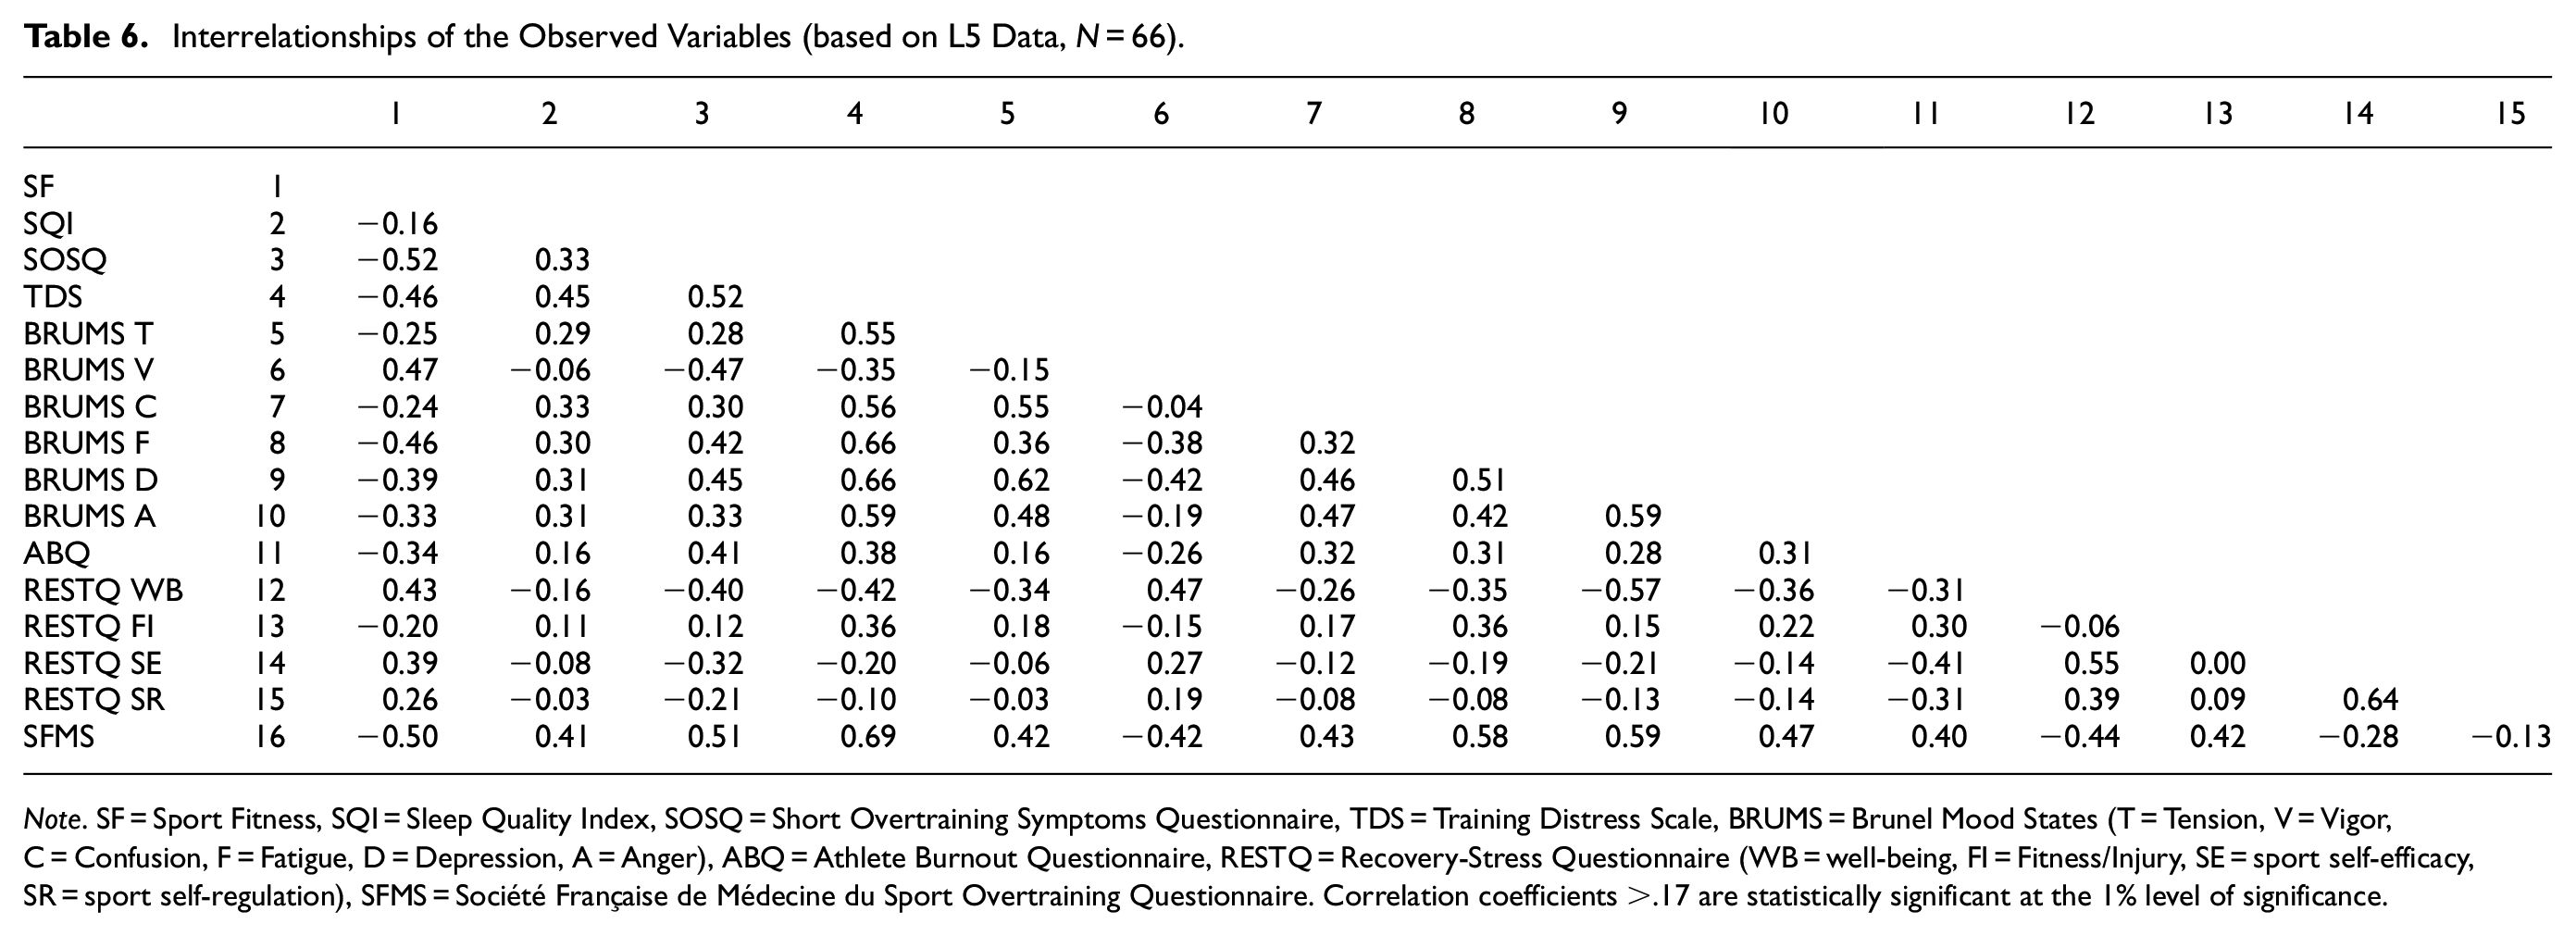
Note. SF = Sport Fitness, SQI = Sleep Quality Index, SOSQ = Short Overtraining Symptoms Questionnaire, TDS = Training Distress Scale, BRUMS = Brunel Mood States (T = Tension, V = Vigor, C = Confusion, F = Fatigue, D = Depression, A = Anger), ABQ = Athlete Burnout Questionnaire, RESTQ = Recovery-Stress Questionnaire (WB = well-being, FI = Fitness/Injury, SE = sport self-efficacy, SR = sport self-regulation), SFMS = Société Française de Médecine du Sport Overtraining Questionnaire. Correlation coefficients >.17 are statistically significant at the 1% level of significance.
The associations between the variables observed in both studies (i.e., L5 and L26) can be considered comparable (see Tables 5 and 6). Regarding the variables observed in the L5 study, the relationships between the variables can be considered in line with theoretical expectations, with ABQ, and SFMS showing opposite relationships to the other overtraining indicators and Sport Fitness than those of RESTQ_WB, RESTQ_SE and RESTQ_SR. The overall SOSQ score shows the closest relationship to Sport Fitness.
Due to the high proportion of common variance among variables and non-zero pattern of correlations (KMO = 0.89; Bartlett’s test of sphericity: χ2 = 447.95, p < .01), the resulting correlation matrix was subjected to principal component analysis. Four components with eigenvalues greater than 1 were extracted (6.21, 2.02, 1.26, and 1.06 before rotation, respectively) which together explains 65.98% of total variance. Table 7 shows the corresponding pattern matrix, which shows that the first component saturates the BRUMS dimensions reflecting negative emotionality accompanied by training distress and sleep problems. The second component combines the SR and SE dimensions of RESTQ and ABQ (with negative component loading). The third component is based on the BRUMS_V dimension, accompanied by SF, BRUMS_F, WB and SOSQ. It should be noted that significant cross-loadings (to the fourth and second components, respectively) were observed for ABQ and BRUMS_D. The final component combines the FI dimension of RESTQ and ABQ. The total score of the SFMS questionnaire is associated with components 1, 3, and 4. The individual components are weakly to moderately related to each other (ranging from −0.06 for C2 and C4 to 0.37 for C1 and C3).
Results of the Principal Component Analysis (Pattern Matrix).

Note. SF = Sport Fitness, SQI = Sleep Quality Index, SOSQ = Short Overtraining Symptoms Questionnaire, TDS = Training Distress Scale, BRUMS = Brunel Mood States (T = Tension, V = Vigor, C = Confusion, F = Fatigue, D = Depression, A = Anger), ABQ = Athlete Burnout Questionnaire, RESTQ = Recovery-Stress Questionnaire (WB = well-being, FI = fitness/injury, SE = sport efficacy, SR = sport self-regulation), SFMS = Société Française de Médecine du Sport Overtraining Questionnaire. Coefficients below 0.32 are omitted for clarity.
It is evident that several variables exhibit rather significant cross loadings on secondary components. When considered the minimum criterion of 0.32 for the interpretation of significant component loadings, as proposed by Tabachnick and Fidell (2019, p. 509), these variables include BRUMS D, ABQ, RESTQ WB, BRUMS F, and SFMS. For this reason, we conducted another EFA, including only variables that did not exhibit significant secondary component loadings. Within this iteration of EFA, notable cross loadings once again emerged for two variables (TDS and RESTQ FI). In conclusion, a 3-component solution was extracted, which demonstrates a simple factor structure (see Table 8).
Results of the Principal Component Analysis (Pattern Matrix) With Simple Structure.

Note. SF = Sport Fitness, SQI = Sleep Quality Index, SOSQ = Short Overtraining Symptoms Questionnaire, BRUMS = Brunel Mood States (T = Tension, V = Vigor, C = Confusion, F = Fatigue, A = Anger), RESTQ = Recovery-Stress Questionnaire (SE = sport efficacy, SR = sport self-regulation). Coefficients below 0.32 are omitted for clarity.
The three extracted components collectively explain 66.12% of the total variance, with component correlations ranging from −0.13 (C1 and C2) to 0.31 (C2 and C3). Component 1 encompasses negative emotions and sleep problems, component 2 aggregates self-regulation and self-efficacy, and component 3 includes subjectively perceived sport fitness along with vigor and SOSQ.
Discussion
The training efforts of elite athletes are necessarily associated with fluctuations in performance depending on the intensity of the physical training load. If the underperformance phase is balanced by an adequate period devoted to recovery, this is essentially an adaptive process of coping with stress-induced exertion, which is referred to as functional overreaching (FOR). However, if the training load is sustained at a high level for a long period of time without adequate compensation phases, the functional state may tip over into a maladaptive form referred to as non-functional overreaching (NFOR) or overtraining syndrome (OT; Meeusen & de Pauw, 2019) and it can potentially lead to a decline in cognitive abilities, such as prolonged reaction time (Symons et al., 2023). Bellinger (2020) aptly refers to the fitness-fatigue adaptive continuum in this context, linking the underlying concepts behind all definitions of overtraining syndrome, namely underperformance and fatigue. The review in the introduction to this study also points out that various authors have commented on the existence of other important manifestations to watch for in the context of overtraining syndrome. Indeed, other negative symptoms develop as a result of the prolonged exhaustion of the organism, whether of a biochemical (Petibois et al., 2002), hormonal (Cadegiani & Kater, 2018) or psychological (Urhausen & Kindermann, 2002) nature.
This study aimed to investigate the associations between different subjective indicators and measures used in research practice to identify NFOR/OT, which may exhibit greater responsiveness to the stress induced by training compared to objective measures (Saw, Main, & Gastin, 2016). Since there is substantial inter-individual variability in response to overload training (Bellinger, 2020; Mann et al., 2014), we focused on the intra-individual level and examined the covariance of variables in a longitudinal perspective. The intensive longitudinal part focused exclusively on highly variable characteristics, which were monitored on a small sample of athletes at 14-day intervals (L26 study). The extensive part was conducted with a larger sample at 3-month intervals and was supplemented by the monitoring of more enduring characteristics (L5 study).
In the L26 high-frequency study, all the overtraining indicators used (apart from sleep quality) were found to be significantly related to sport fitness level. This means that all indicator proved its relevance in screening of overtraining. The nonexistent relationship between sleep and overtraining can be ascribed to the fact that sleep patterns can be disrupted in adolescence in comparison to adulthood (Fukuda & Ishihara, 2008). The strongest association was between sport fitness and the Short Overtraining Scale, which measures core aspects of overtraining (appetite, energy level, sleep quality, motivation for training and the quality of it). In terms of the relationship with mood states as measured by BRUMS, which is by far the most widely used psychological method in research practice, it is interesting to note that all its dimensions related to Sport Fitness on approximately same level (r = .27 to r = .36). Moreover, the BRUMS scores are even slightly more closely related to the overall SOSQ score (r = .38 to r = .49). Clearly, these results stress out the complexity of overtraining syndrome in terms of its manifestations, as the literature suggests (Armstrong et al, 2022; Johnson & Thiese, 1992; Uusitalo, 2001; Winsley & Matos, 2011). The results on the larger cohort in the L5 study further confirmed the findings from the L26 study, and additionally allowed for the capturing of relationships with more enduring characteristics and also used another method explicitly dedicated to the screening of overtraining (SFMS). The overall SFMS score had similar relationships to the other indicators as the Short Overtraining Symptoms questionnaire, however, more significant differences can be found in relation to training distress (r = .69, r = .52, respectively) and to fitness/injury (r = 0.42, r = 0.12 respectively). The reason for this may be that, in comparison with SOSQ, SFMS focuses more on distress directly caused by high training effort (for a content comparison, see Lemyre et al., 2007 and Varlet-Marie et al., 2004). Regarding the RESTQ dimensions, it is noteworthy that the general well-being scale showed the strongest relationship with sport fitness, confirming the overlap of overtraining syndrome with non-sport areas of life in young athletes (Rearick et al., 2011).
In terms of long-term implications, it is important to explore the relationships of the burnout construct to individual indicators, as athlete burnout is very close in its manifestations to overtraining syndrome (it can be distinguished on the basis of the motivation factor, as mentioned in the introduction) or can even considered as the final stage of the overtraining continuum (Winsley & Matos, 2011). However, our results suggest that burnout is more of a distinct condition, as the relationships to questionnaires identifying complex manifestations of overtraining (SFMS, SOSQ) are not so closely related (r = .40 and r = .41). The relationship found between athlete burnout and the total SOSQ score is comparable to that found in the study by Lemyre et al. (2007), who reported a slightly closer relationship on a sample of junior athletes (r = .55), but still in the moderate association range.
As the indicators are generally quite closely related to each other, we attempted to uncover the structure of the relationships in the final step of the analysis. Using principal component analysis, we extracted 4 components. In terms of identifying the underlying symptoms of overtraining, we consider the third component the most interesting, because it is based on the self-assessment of one’s own sports performance supplemented by the measure of fatigue (and vigor). This set of variables corresponds to the generally accepted core symptoms of overtraining syndrome, that is, fatigue coupled with underperformance (Kreher & Schwartz, 2012; Lewis et al., 2015; Meeusen et al, 2013). The content of this component also supports the idea that an individual’s general well-being is closely linked to his/her experiences in sporting life (at least for adolescent athletes). Furthermore, from the results of the PCA, we would like to point out the specific role of athlete burnout, high values of which are associated with reduced belief in one’s sporting ability. However, burnout is also associated with higher values of negative body feelings resulting from sporting activity. This pattern of results fits well with the conceptual definition of the construct of athlete burnout, where it is based on feelings of physical (and emotional) exhaustion, which, in the long run, may result in the development of feelings of insecurity and doubts about their sporting efficacy (Cresswell & Eklund, 2006).
From both a theoretical and empirical perspective, it is understandable that this extensive set of indicators represents a complex structure in which individual indicators transcend multiple symptomatic categories. Consequently, in the principal component analysis, we aimed to achieve a simple structure by removing ambiguous indicators. In this manner, we identified three fundamental groups of indicators, reflecting negative emotionality (accompanied by sleep problems), self-concept characteristics, and, last but not least, core symptoms of overtraining syndrome captured through subjective sport fitness and vigor.Added to these symptoms is the overall score of SOSQ, which thus essentially confirms its role as an effective tool for screening purposes (Lemyre et al., 2007).
Conclusion
There is currently no single instrument or indicator of overtraining syndrome. In practice, a variety of methods or combinations of instruments are used to measure psychological, physiological and biological symptoms. This study provided a comprehensive picture of subjective indicators of NFOR/OT in an intra-individual perspective in elite adolescent athletes. The most significant outcome of this research is the identification of a distinctive set of subjective indicators for overtraining. These indicators encompass various facets of the overtraining syndrome, primarily rooted in emotional aspects, cognition-based self-assessment, and sport vitality. With a perspective on the necessary validation of the results, it would be desirable for future research to focus on the inclusion of objective (physiological) indicators within the structure of overtraining symptoms.
Limitations
We consider the most significant limitation of this study to be the absence of an objective measure of sport performance (which was not possible due to the various kinds of specialist sports of the respondents). However, subjective methods of assessing sport performance are generally accepted when used with experienced athletes (Arnold et al, 2018). The relatively small size of the research sample in the intensive part of the longitudinal research (L26 study) may be considered another limitation, although the aim was to capture intra-individual covariance between the variables of interest, so this was counterbalanced by the high number of observations made.
Clinical Implications
The adolescent period is characterized by a large number of changes in the physical, mental, and social domains that can make it more challenging for elite athletes to cope with the long-term consequences of training loads (Woods & Butler, 2021). In fact, the high (up to one-third) prevalence of overtraining in this developmental period has been reported in a number of studies (Matos et al., 2011), with Kutz and Secrest (2009) finding that one of the risk factors for the development of overtraining syndrome in adolescence is athletes’ inability to recognize the symptoms of overtraining early on, or their reluctance to acknowledge them.
Early identification of overtraining in adolescent elite athletes is important not only to maintain physical and psychological health, but also to stay active in sport (as a prevention of premature termination of sporting career). However, the implementation of this process is quite difficult, since the symptoms of overtraining can be highly individual and at the same time multisystemic in nature. Therefore, significant efforts have been made by the professional community to find indicators of overtraining that can be reliably used in its identification (Bourdon et al., 2017; Soligard et al., 2016). However, no specific indicator has yet been described for the diagnosis of overtraining syndrome, which could be used to unambiguously identify the condition, and thus no relevant binding diagnostic criteria have been adopted for overtraining (Meeusen et al., 2013). However, Savioli et al. (2018) reported in their review article that psychological indicators of overtraining can often be identified earlier than the relevant physiological changes associated with NFOR/OT when training overload and inadequate rest are present. Thus, in practice, regular monitoring of the adaptation of the athlete’s organism to training load should not be implemented only through relevant physiological indicators, but a comprehensive approach should be emphasized in monitoring the onset and development of NFOR/OT and appropriate psychological indicators should be used to the maximum extent possible (Bernacikova et al., 2019). Thus, the results of the present study may have significant application potential for clinical practice, especially in the area of continuous monitoring of the level of identified indicators, which can serve as a starting point for diagnosis and prevention of the development of overtraining syndrome. At the same time, they can be used in the continuous mapping and evaluation of athletes’ performance, their long-term management and in their education about self-monitoring of the overtraining syndrome.
Footnotes
Declaration of Conflicting Interests
The author(s) declared no potential conflicts of interest with respect to the research, authorship, and/or publication of this article.
Funding
The author(s) disclosed receipt of the following financial support for the research, authorship, and/or publication of this article: This work was supported by the Czech Science Foundation under Grant GA18-17783S.
Ethical Approval
The research project was approved by the Institutional Board of the Institute of Psychology, Czech Academy of Sciences. Informed consent was obtained from all participants and their legal representatives (parents or guardians).
Data Availability Statement
The data that support the findings of this study are available from the corresponding author upon reasonable request.