
Abstract
An information-theoretic measure of language consistency is constructed from the text of 13 years of trade journal articles on the biotechnology industry. This measure is then related to the trading volume of a representative portfolio of biotechnology stocks. Findings indicate that language consistency and trading volume have a joint (positive) influence on each other over the long term; however, sharp drops in consistency are also predictive of transient spikes in trading volume. The significance of these findings is discussed in relation to modern theories of legitimation and the economics of surprise.
Keywords
Introduction
What is the relationship between industry news and stock market trading volume? This question has received significant attention in the finance and accounting literatures where a host of empirical studies show that trading volume generally increases with the arrival of new information (see, e.g., Kim & Verrecchia, 1991). In these studies, the arrival of new information is determined from the content of a news story (e.g., positive or negative news) and the effect is typically short lived. In the current work, I am focused on a different type of information—one that is manifest in the consistency (or inconsistency) of language use over time. When the language of a current news article is inconsistent with past articles, it is surprising and thus constitutes new information regardless of content.
Drawing on research in sociology, management, and marketing, I argue for the existence of a longer term relationship between this particular type of information and trading volume. The theory which supports this argument is based on the construct of legitimacy and its realization in written language (Green et al., 2009; Watts, 2018). Legitimacy is a property assigned to objects or behavior deemed “appropriate and desirable within a widespread, taken-for-granted system of norms or social codes” (Cattani et al., 2008, p. 147). Legitimacy is also a precursor to economic activity (Humphreys, 2010; Lusch & Watts, 2018; Zuckerman, 2004). It is achieved over time, and public discourse is central to this process (Hardy, 2011; Powell & Colyvas, 2008). Indeed, language is typically viewed as the device that both establishes and reflects the legitimacy of a product category, service, or behavior (DiMaggio & Powell, 1991; Rosa et al., 1999). Thus, industry news should both affect, and reflect the legitimacy of its subject, and mirror the attendant growth in economic activity.
In the sections that follow, I make the case for a long-term relationship between legitimacy and stock market trading volume. I then provide support for these arguments by using a language-based measure of legitimacy to model the relationship between biotechnology news and the trading volume of a representative portfolio of biotechnology stocks. I chose the biotechnology sector because the available news resources are relatively narrow in scope, thus limiting confounds from unrelated content. The industry has also been used extensively in the literature on legitimacy, which allows me to substantiate my claims with the findings from prior research.
The results of my model show a short-term relationship similar to that predicted by researchers in accounting and finance. This relationship shows up as transient spikes in trading volume driven by sharp changes in language use. However, the model also show that language consistency and trading volume have a joint (positive) influence on each other over the longer term.
These findings can contribute to research in both management and finance. In management, the link between language and legitimacy has been widely theorized, but lacks supporting evidence (Green et al., 2009; Harmon et al., 2015). By showing how a language-based measure of legitimacy can predict economic activity in the expected manner, I provide empirical support for these theories. In the finance and accounting literature, there is robust debate regarding the mechanisms driving trade in the face of new information. The observed short-term spikes in trading volume lend support to theories which hold that investors maintain private (and different) valuation models that are reconciled with new public information via trading (Bollerslev et al., 2018; Kim & Verrecchia, 1991). However, the observed long-term effects provide evidence of a different mechanism—one that has not received nearly the same amount of attention. Legitimacy indicates a broadly shared understanding of the meaning behind various terms and phrases, which reduces the effort required to communicate (Lusch & Watts, 2018). When information is easier to process, more investors are likely to enter the market leading to greater liquidity. Moreover, existing investors could find it easier to ingest new information and trade more frequently as a result.
Literature Review
The Relationship Between Legitimacy and Language Use
Legitimacy is typically considered a property of social objects that conform to a widespread, taken-for-granted system of norms or social codes. Whether a particular object (e.g., a product, institution or category of behavior) is deemed legitimate depends crucially on broad acceptance of the validity and virtue of that object’s attributes and actions (Johnson et al., 2006). This formulation of the construct implies both a cognitive dimension whereby some social object is taken for granted, and a normative dimension that prescribes the object’s morality (Berger & Luckmann, 1966; Suchman, 1995). Legitimate social objects are, therefore, both valid and virtuous.
Even so, the legitimacy construct is broadly deployed in the social sciences and researchers understandably vary in their emphasis on a particular dimension. For instance, many institutional scholars describe legitimacy as the result of sociopolitical processes—what society’s norms and rules endorse or prohibit (DiMaggio & Powell, 1983). Similarly, social psychologists treat legitimacy as a property of an authority that obliges individuals to engage in conforming behavior (Tyler, 2006). In both cases, the focus is largely on the normative-prescriptive dimension of the construct—that aspect of legitimacy defined by social actors’ conscious judgment of behaviors as appropriate, proper and just.
In contrast, management and marketing scholars often emphasize the cognitive dimension of legitimacy—the degree to which a behavior or category of behaviors is taken for granted in the marketplace. Canonical research in this area connects legitimacy to outcomes like firm performance or the adoption of new products and practices (Humphreys, 2010; Rosa et al., 1999; Tripsas, 2009; Zuckerman, 1999). Undergirding these findings is the argument that isomorphism legitimizes (Deephouse, 1996). When an organization adopts legitimized behaviors, it renders itself immune to substantive, content-based challenges to the validity of its action (Suchman, 1995). Importantly, desired outcomes tend to vary with the level cognitive legitimacy ascribed to a behavior, such that the success of isomorphism as a strategy depends largely on the degree to which the behavior is taken for granted (Henisz et al., 2005).
In the current work, I continue this emphasis on cognitive legitimacy and argue that the consistency of language used in communication is a reasonable proxy for taken-for-grantedness, and hence, cognitive legitimacy. Other researchers have made analogous connections between language use and legitimacy. Most notably, Suchman (1995) describes legitimation as a process accompanied by discourse that evolves from active evaluation of substantive claims to passive support of the dominant justification. For Green et al. (2009) and Harmon et al. (2015), this transformation is manifest in the simplification of sentence structure over time—a process of compression in which lengthy and varied discourse is supplanted by more compact text.
Fundamentally, the mechanism behind an increase in language consistency is an increase in the consistency of behavior—news articles describing the increasingly consistent behavior will inevitably contain more consistent language. However, the desire for legitimacy is the force driving the consistent behavior to begin with. When a behavior is new, actors must actively engage in justification. Over time, however, the conduct of organizations can be taken for granted to such an extent that “for things to be otherwise becomes literally unthinkable” (Zucker, 1983, p. 25). This subtlety is what makes cognitive legitimacy so powerful and conformity so attractive. Actors that engage in legitimized behaviors are not required to justify their actions (Suchman, 1995).
The Language of Legitimacy and Trading Volume
Research on legitimacy often views language as both cause and consequence of economic activity (Colyvas, 2007). Language facilitates negotiation of the value and meaning of a product, service, or behavior, and once agreement is established, trade can occur without the burden of justification. This in turn provides an incentive for additional market participants to use the same (or similar) language as doing so affords them some degree of credibility in an established market.
This type of virtuous cycle generates a vocabulary that stabilizes in time. Media outlets, advertisers, and consumers vary in how they describe a relatively new market, but these descriptions tend to converge as the market matures (Watts, 2018). This occurs because market participants collectively agree that certain descriptive words are more or less appropriate and because detailed explanations are no longer necessary.
Consider, for instance, the rise of the Minivan category of automobile. Prior to its introduction, market participants did not share a clear understanding of what was being exchanged or why (Humphreys, 2010). Over time, however, communication by firms, the media, consumers, and so on, facilitated a shared understanding of the category and established its legitimacy within a broader cultural context (Rosa et al., 1999). This created the conditions wherein investment by firms and purchases by consumers could occur with minimal justification. Moreover, subsequent innovations often borrowed language from the Minivan category as a means to signal market membership and to realize some of the same efficiencies in exchange (Suchman, 1995)—behavior that served to reinforce the dominant vocabulary.
Consonant with the above logic, I argue that the legitimacy of the biotechnology industry (and concomitant language consistency) is reflected in the collective trading volume of participant organizations’ common stock, and that increased trading volume, in turn, can further affect legitimacy as reflected by the consistency of the language used to describe the industry. To illustrate this line of reasoning, consider the work of Zuckerman (1999), which shows that demand for a firm’s stock depends on its conformity to a legitimized category. When a firm’s activity crosses a categorical boundary, it receives less analyst coverage and demand is suppressed as a result. Yet, the Zuckerman (1999) analysis presumes static, legitimized categories and a set of firms that vary in their conformity. Without loss of generalizability, we can instead assume a prototypical firm and categories of behavior that vary in their legitimacy. Under this reformulation, it is the variation in legitimacy that affects demand rather than variation in a firm’s conformity. If language consistency is capturing this change in legitimacy, then rising consistency should precede an increase in demand for biotechnology stocks. This increased demand leads to a positive relationship with trading volume as more investors become comfortable participating in the market and existing investors take advantage of greater liquidity.
Higher trading volumes are also likely to precede a rise in language consistency. With greater activity comes greater scrutiny of the biotechnology industry. This in turn increases an organization’s incentive to conform as behavior viewed as consistent with the status quo does not require as much justification (Deephouse, 1996; Glynn & Abzug, 2002). This is particularly relevant in the biotechnology industry as most companies were funded by strategic alliances or venture capital through the early 2000s (Wolff, 2001). Conformity thus substitutes for revenue as a signal of an organization’s credibility—an effect further reinforced by investors who passively conflate predominance with validity (Bogaert et al., 2016), or consciously acquiesce as a means to signal knowledge of the current social order (Weber, 1978). Regardless, increasing market participation is likely to reinforce the current vocabulary as firms engage in (and journalists report on) this conforming behavior.
In the following sections, I describe my data and the operationalization of the legitimacy construct. The relationship between this measure and trading volume is then modeled over the period during which biotechnology transitioned out of university laboratories and into the mainstream industry that exists today. Consistent with contemporary descriptions of the legitimation process (Colyvas, 2007; Watts, 2018; Zuckerman, 1999), I find that legitimacy and trading volume have a joint (positive) influence on each other over the long term. However, I also find that sharp drops in legitimacy are predictive of temporary spikes in trading volume. This effect is consistent with the view that a change in vocabulary conveys new information to the market.
Data and Measures
Overview
Modeling the relationship between legitimacy of news content and stock market trading volume poses several tricky issues. First, one must find a database of news articles that is specific to a context. This ensures that the legitimacy observed in the language is related to the context rather than some other factor. Second, one needs a sufficient number of articles so that the extracted measure is not too noisy. Third, one needs to gather news over a long-enough period of time that the legitimation process is observable, and fourth, there should not be any competing sources of information.
To meet these needs, I chose to construct my measure using textual data from the 20,999 articles written for the Bioworld trade journal between January 1991 (when the journal began) and December 2003. During this period, Bioworld constituted a primary source for industry-wide information on the activities of firms and other stakeholders in the biotechnology industry (Powell et al., 2005; Wolff, 2001). Several articles were published each day (excluding weekends) on broad topics like personnel changes, fundraising activity, interfirm contracting, the Food and Drug Administration (FDA) approval process and the latest scientific trends. This also constitutes the period of time during which the industry emerged from university laboratories and matured into a robust and fully legitimized industry—By 2004, biotechnology was an established global business (Koput, 2016, private interview). Finally, by the end of this time period many other sources of information started to become available (e.g., via the internet), which diminished the relevance of the Bioworld trade journal.
Language Consistency Measure
I use the language consistency measure described by Watts (2018) as my proxy for the legitimacy construct. The measure is based on the difference in word use over time such that when the words found in news articles are changing from one period to the next, language consistency is low. However, when words are used with the same level of frequency from period to period, language consistency is high. One can gain an intuition by looking at the text directly. To illustrate, I have provided excerpts from two different example articles. The first is from Tuesday, April 5, 1994, and the second is from Monday, December 1, 2003.
“. . . to reverse transcription in cells transformed to constitutively express interferon b.” The group’s leader, Edward DeMaeyer of France’s National Scientific Research Institute (INRA) stated, “We are developing methods for somatic-cell gene therapy directed against infection with human immunodeficiency virus . . . through the constitutive production of autocrine interferon (IFN).” His strategy aims to block HIV at its earliest stages of cell entry and replication, rather than the later stages at which interferon is commonly thought to act. For starters, the team transfected various mouse and human cell lines with IFN genes. These transformed cells synthesized interferon at a constant low rate; their replication and survival were the same as in control cells. When challenged with various retroviruses, they markedly reduced the number of virally infected cells. Then the team assailed CEM cells with HIV viral particles. (CEM is a model human T-cell line derived from patients with leukemia.) “Two days later,” as DeMaeyer reported, “the presence of HIV-1 proviral DNA was significantly lower in the human IFN-b transformed cells . . .
. . . gonadotropin-releasing hormone antagonist available as a depot formulation, Plenaxis (abarelix for injectable suspension) is indicated for pain relief in advanced symptomatic prostate cancer patients who meet a variety of conditions. First, they are not viable candidates for treatment with luteinizing hormone-releasing hormone agonists, and they refuse surgical castration. Patients must exhibit one or more other conditions, including a risk of neurological compromise due to metastases, ureteral or bladder outlet obstruction due to local encroachment or metastatic disease, or severe bone pain from skeletal metastases persisting on narcotic analgesia. “Most importantly, this product is totally homegrown,” Praecis Chairman and CEO Malcolm Gefter told BioWorld Today. “Its concept and inception were conceived at the founding of the company, and we have executed every single aspect of the research, development, formulation, regulatory [filings], manufacturing and now sales and marketing all by ourselves. It really represents our ability to execute a fully integrated business strategy . . .”
With even a quick read of the prior two excerpts, one will notice several prominent linguistic features. First, there are a large number of words like “the,” “to,” “is,” “of,” and “was.” However, these words constitute the “plumbing” of the English language and are also uninformative. In contrast, words like “HIV,” “cancer” and “cell” are descriptive of industry activities. Moreover, they appear with sufficient periodicity to suggest they are an integral part of subject matter under consideration. By capturing changes in how these descriptive words are used over time, we can infer whether, and how quickly, the industry is changing. Next, I describe a measure called “language consistency,” which reflects the degree to which this descriptive vocabulary changes in time.
Following the work of Klingenstein et al. (2014) and others (e.g., Tirunillai & Tellis, 2014; Watts, 2018), I performed the following steps on each article to prepare the data for further analysis.
Break apart each article into a list of lexical elements at the word level in a process typically referred to as tokenization (Jurafsky & Martin, 2000). For instance, compound words are split into their constituent parts so that a word like “don’t” becomes three elements: “don,” “’,” and “t.”
Remove all punctuation and numbers from the list.
Change all elements to lower case.
Remove all English “stop words” (i.e., the plumbing), and words of length <3.
Stem the remaining elements using the Porter (1980) stemmer so that words like “work” and “working” are treated as the same lexical element.
Note that I used the standard list of English stop words that comes with the natural language toolkit in python 3 (see https://www.nltk.org/). Several other lists are available as well; however, the results of my model are qualitatively the same whether these words are removed or not. Thus, their removal is mostly a matter of convenience—by removing them, I can generate tables of the most used word stems without including words that do not matter substantively.
After the above preprocessing steps, I pooled the lists of lexical elements representing each article by month into 156 larger lists. These represent one for each month from January 1991 through December 2003. Admittedly, the choice of aggregation size is arbitrary for a measure of this type; however, aggregating to the yearly level does not produce enough data for time-series analysis and weekly data do not contain enough text. Regardless, I tested various aggregation sizes and the results remain qualitatively the same.
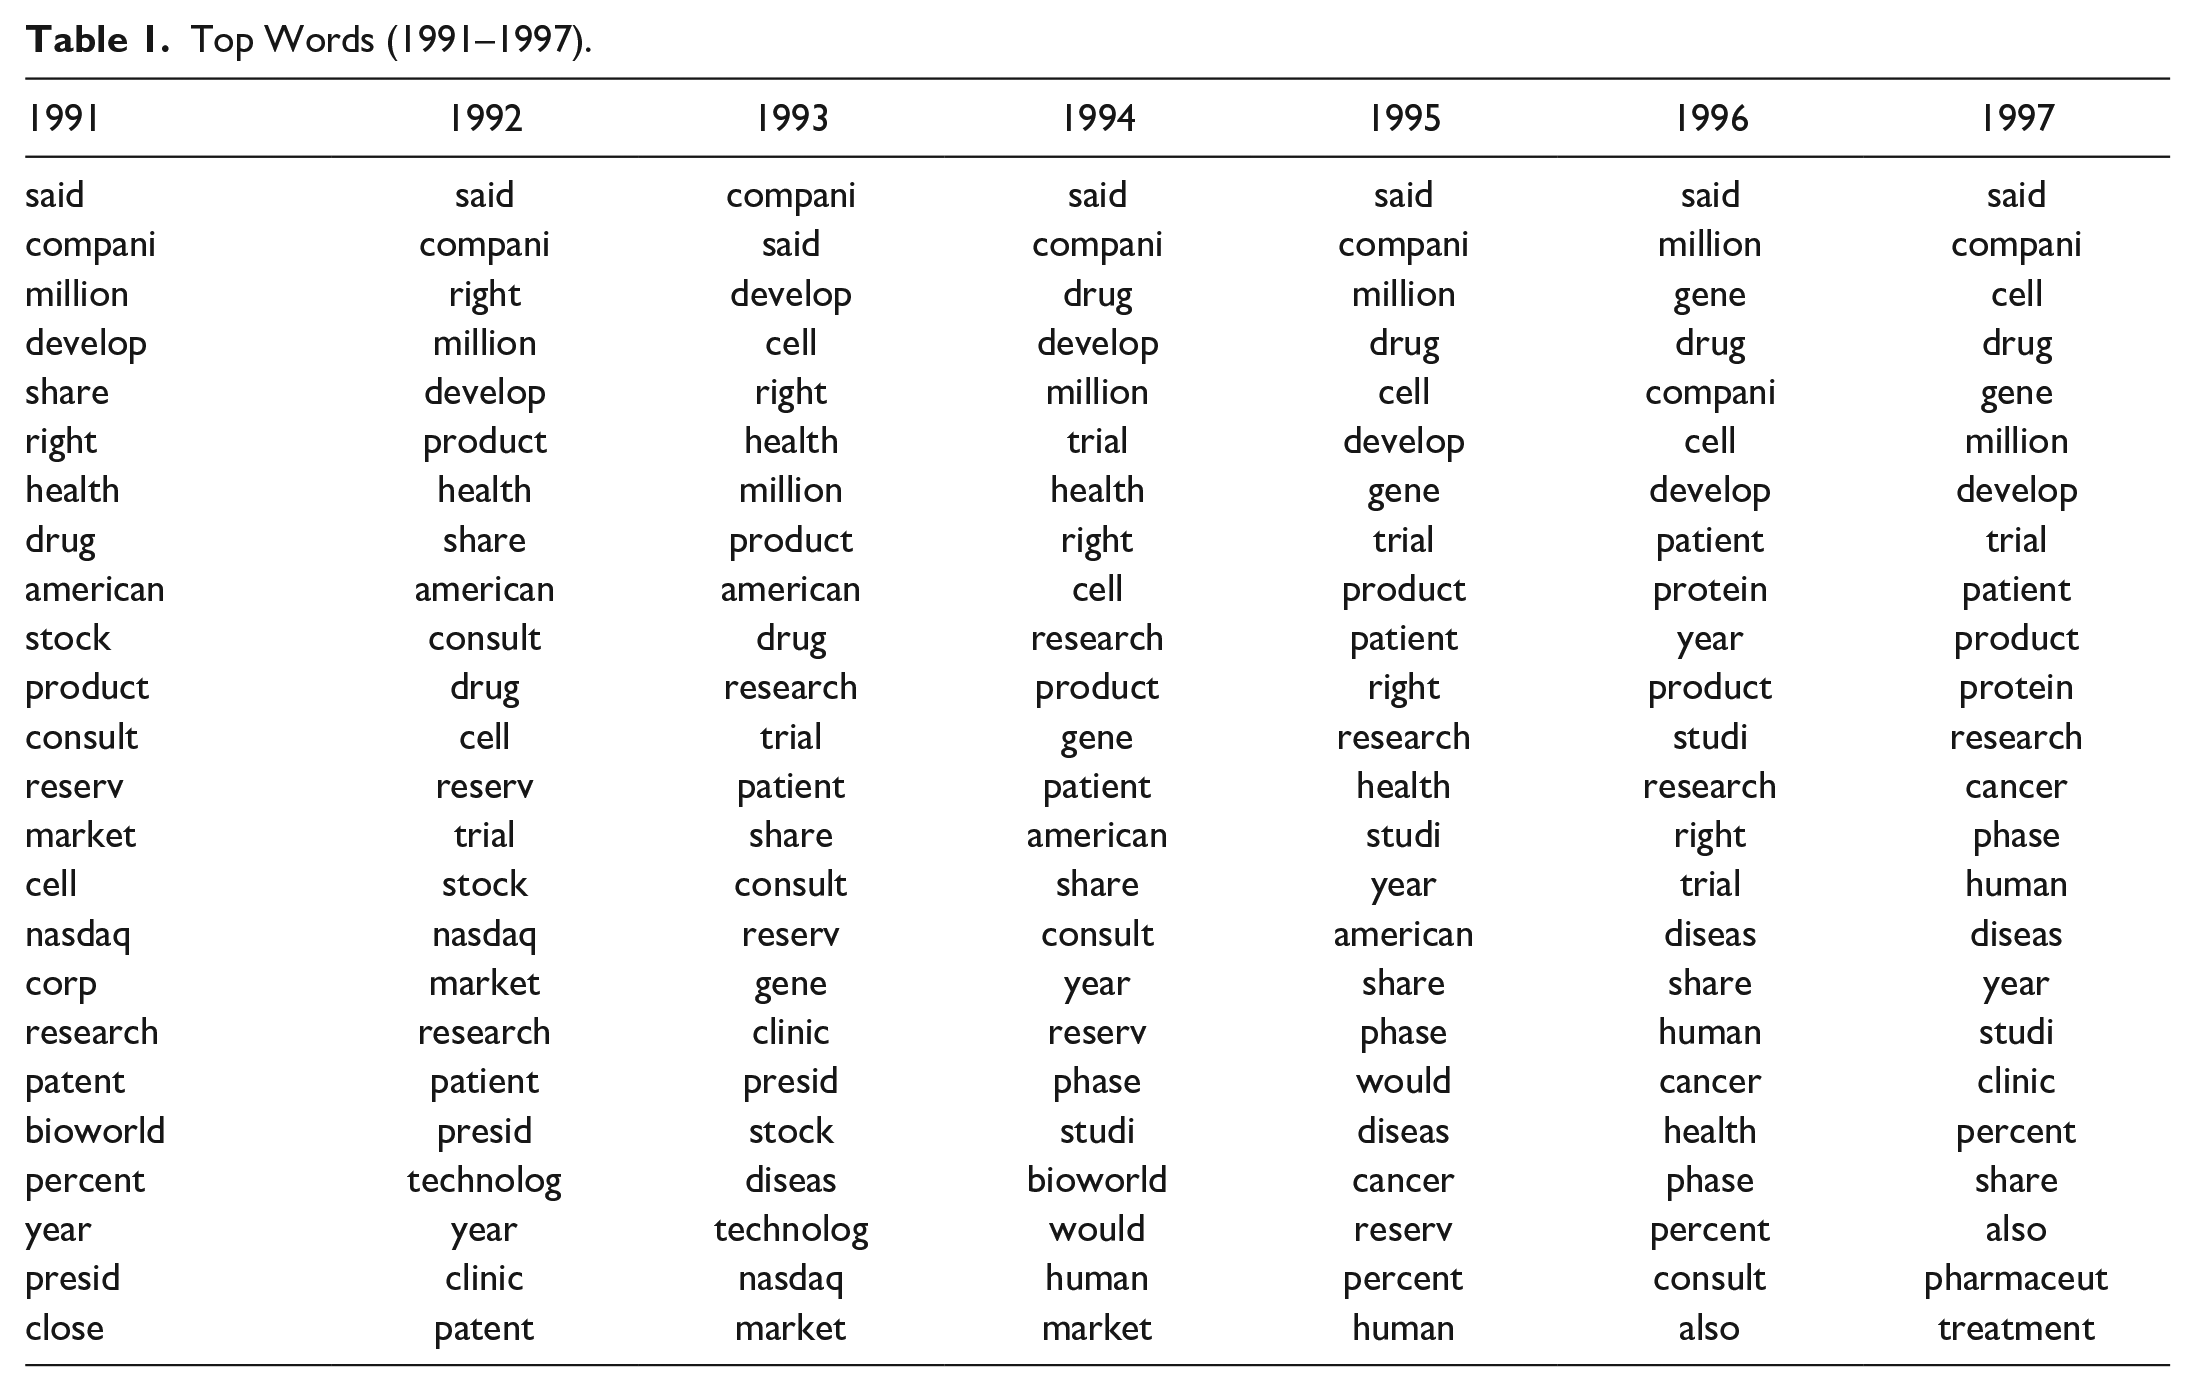
I then constructed 156 frequency distributions from these lists, with the lexical element in rank order on the x-axis and its count divided by the total number of lexical elements constituting the y-axis. Tables 1 and 2 list the top 25 word stems in rank order for all 13 years under consideration.
Top Words (1991–1997).
Top Words (1998–2003).

To capture language consistency at a given point in time, I draw from a moving window around the period under consideration. Consistency is modeled as the difference between the distribution of frequencies at time t and the average frequency distribution over the previous k periods. This k-period moving average incorporates innovations gradually so that new shocks are defined against the relevant past rather than the field’s entire history. Granted, the choice of baseline (whether 3, 12, or 36 months) has no a priori rationale. Following the work of researchers in other fields, I tested various window sizes and show the results in the “Robustness” section.
Formally, the uniqueness of the distribution at period t is computed as the Kullback–Leibler divergence (KLD) from the average of the prior k distributions (Klingenstein et al., 2014). The KLD is denoted DKL(P Q), where P is assumed to represent the “true” distribution, which in this case, is the distribution constructed from the prior k periods. Q is the distribution at time t. For discrete distributions (as I have here) the measure is defined as

which quantifies the amount of information lost when Q is used to predict P. When the value is high, it describes a departure from the prior k distributions. However, when the value is low, it represents consistency with prior word-stem frequencies. Thus, a measure of language consistency over time can be defined as the negative of the KLD.

Statistical Model and Results
For the analysis that follows, my measure of language consistency is based on probability distributions derived from the intersection of the top 1,000 word stems in the current month (Qt) and the prior three (Pk). Various other configurations were tested as part of my robustness checks and the results are qualitatively the same. The mean monthly values for total number of words, number of unique words (vocabulary), and my language consistency measure are presented in Table 3.
Descriptives (1991–2003).

In general, language consistency rises year over year, which is what we would expect of an industry gradually gaining legitimacy; however, there is significant variation at the monthly level. Notably, there is significant volatility in the first couple of years, which is likely due to institutional factors like new reporters learning how to write about the industry. Indeed, the vocabulary more than doubled in these first few years. For this reason, the results are presented after removing these first 2 years of data. I present a statistical justification for their removal in the “Robustness” section.
The set of firms used to calculate trading volume is taken from the data set collected by Powell and his colleagues (see Powell et al., 1996, 2005) extended through 2003. Stock market data are collected from the Wharton Research Data Service (CRSP/Compustat merged). Additional information on the firms used in this data set can be found in existing published work (see, e.g., Powell et al., 1996, 2005); however, a few points are worth mentioning here. The database focuses on dedicated human biotechnology firms, omitting companies involved in veterinary and agricultural biotechnology (which draw on different scientific capabilities and operate in a much different regulatory climate). The subsample used here covers only publicly traded firms, of which 153 were in existence in 1993 and 252 in 2003. In this time frame, some firms were created and entered the database, and others exited, due to failure, departure from the industry, or acquisition.
To reduce volatility in my aggregate measure of trading volume and to improve the interpretability of my graphs, I dropped firms with less than 3 years of data from the sample. However, leaving all firms in for this analysis made no qualitative difference in the results. The final sample numbers between 111 and 192 firms in any given year.
Trading volume is operationalized as the log of the sum of the trading volume for all active firms in a given month (denoted LVOLt). As such, it captures general interest and activity in the biotechnology sector in proportion to firm size. This is in contrast to a measure like turnover, which captures valuation-independent trading activity. The two measures are related; however, in this context one can think of my volume measure like that which is associated with a sector mutual fund or a portfolio, which are often size-weighted to begin with.
Moreover, I am focused on aggregate trading volume—as opposed to abnormal volume—due to its greater fit with the proposed theory. Fundamentally, my argument is about the greater market participation facilitated by legitimacy. Abnormal volume is a measure of increased activity by current participants rather than an increase in the amount of participation overall.
Figure 1 shows standardized measures of trading volume and language consistency on the same axis. Despite significant volatility, both time series seem to adhere to the same long-term average. This is a striking feature of the data and suggests the two series may be cointegrated—that is, each may have an effect on the other as both conform to a longer term trend. To illustrate this phenomenon, conceptually imagine two asteroids rotating around their shared center of mass as they travel through space. At any given point in time, one asteroid or the other will be traveling above or below their shared trajectory, but they always move forward together, each pulling on the other. Cointegrating variables can exhibit a similar behavior. If trading volume deviates from the trend, it is “pulled” back by language consistency just as consistency is “pulled” back itself by higher trading volume. This adherence to the longer term average and the interplay of the two variables can be more easily seen in Figure 2, which shows the 3-month moving average of the same variables.
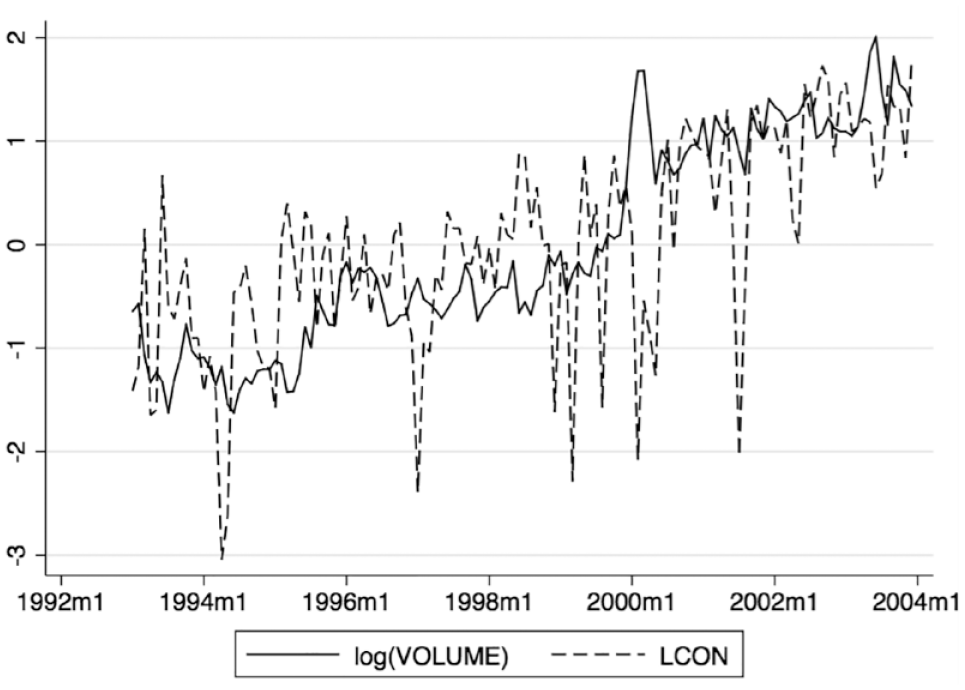
Standardized trading volume and language consistency.
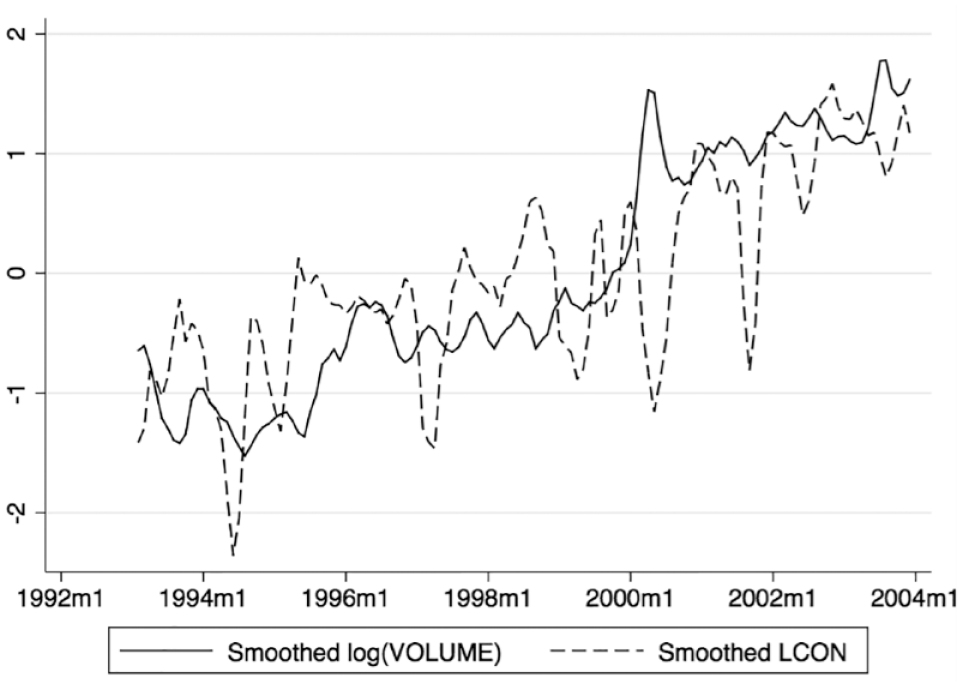
Standardized trading volume and language consistency (3-month moving average).
The reciprocal influence of language consistency and trading volume poses a tricky econometric problem. When analyzing two time-series variables that appear nonstationary (i.e., trending), it is common practice to look at their relationship in first differences, which are assumed to be covariance stationary (Phillips & Perron, 1988). However, if the variables cointegrate (as I suspect given the plots), then even a simple regression in differences can be misspecified yielding spurious results (Granger & Newbold, 1974). In these cases, it is important to test whether some linear combination of the series is stationary even though each series is not stationary by itself (Engle & Granger, 1987; Johansen, 1988). Following the work of Trusov et al. (2009), Xiong and Bharadwaj (2013), and others, I first use Akaike information criterion (AIC) to identify the lag order of the combined series, which is three in this case. I then test for cointegration using the methods described in Johansen (1988, 1995) with three lags. The trace statistic of 0.3018 is well below the 5% critical value of 3.76 used for a regression with 13 parameters, which allows me to reject the null hypothesis of no cointegration.
In the presence of cointegration, the familiar vector autoregression concept (see, e.g., Trusov et al., 2009) can be extended to a vector error-correction model (VECM). The model is fit to the first differences of the nonstationary variables, but a lagged error-correction term is added to account for the long-term relationship. In the case of two variables, the added term is the lagged residual from the cointegrating regression of one of the series on the other in levels. Thus, it expresses the prior disequilibrium from the long-run relationship, in which that residual would be zero. Allowing for a constant and a linear trend, the error correction model for a two variable case can be expressed as follows:


where LVOL and LCON are the trading volume and language consistency measures, respectively. The error correction terms µt−1, are the residuals from the cointegrating regression (as mentioned above). Note that these terms represent the extent of disequilibrium in levels from the prior period. Thus, the VECM specification states that changes in LVOL and LCON not only depend on each other and their own past differences, but also on the extent to which the two variables have deviated from their long-term average. Note also that the constant term v implies a linear time trend in the levels, and the time trend δt implies a quadratic time trend in levels. This allows for added flexibility in the shape of the long-term trend. m is the number of lags as determined by the AIC (as above).
Estimation of the two variable VECM was accomplished using the maximum likelihood methods developed by Johansen (1995) and implemented in Stata 13 using the vec command. Coefficients and their z-values from this estimation are shown in Table 4. Both the LVOL and the LCON equations are well specified with p > χ2 well below the 5% cutoff and R-squared values of .13 and .34, respectively. I also verified the absence of autocorrelation in the residuals by verifying that values from the Lagrange multiplier test were within acceptable ranges (see, e.g., Trusov et al., 2009). The cointegrating equation is also highly significant (χ2 = 54, df = 1) as are each of the error correction coefficients shown as L.ce1 in Table 4. The fact that these coefficients have opposing signs is a requirement for a well-specified VECM model: that is, if (LVOL − LCON) is above the long-term average, either LVOL must fall or LCON must rise.
Results of Vector Error Correction Model.

Note. Z statistics in parentheses.
p < .05. **p < .01. ***p < .001.
There is a strong connection between cointegration and causality in that at least one granger-causal relationship must exist in a cointegrated system (Engle & Granger, 1987). In this case, the long-term causality appears to flow both directions as each variable “pulls” the other back toward equilibrium. This can be seen visually by looking at the orthogonalized impulse response functions (OIRFs), which show one variable’s response to a one-unit increase in the other.
The interpretation of OIRFs rely on the stability of the model. The companion matrix of a VECM with K endogenous variables and r cointegrating equations has K − r unit eigenvalues. If the process is stable, the moduli of the remaining r eigenvalues are strictly less than one, which I verified using the vecstable command in Stata 13. Figure 3 shows the effect of LCON on LVOL and Figure 4 shows the effect of LVOL on LCON.
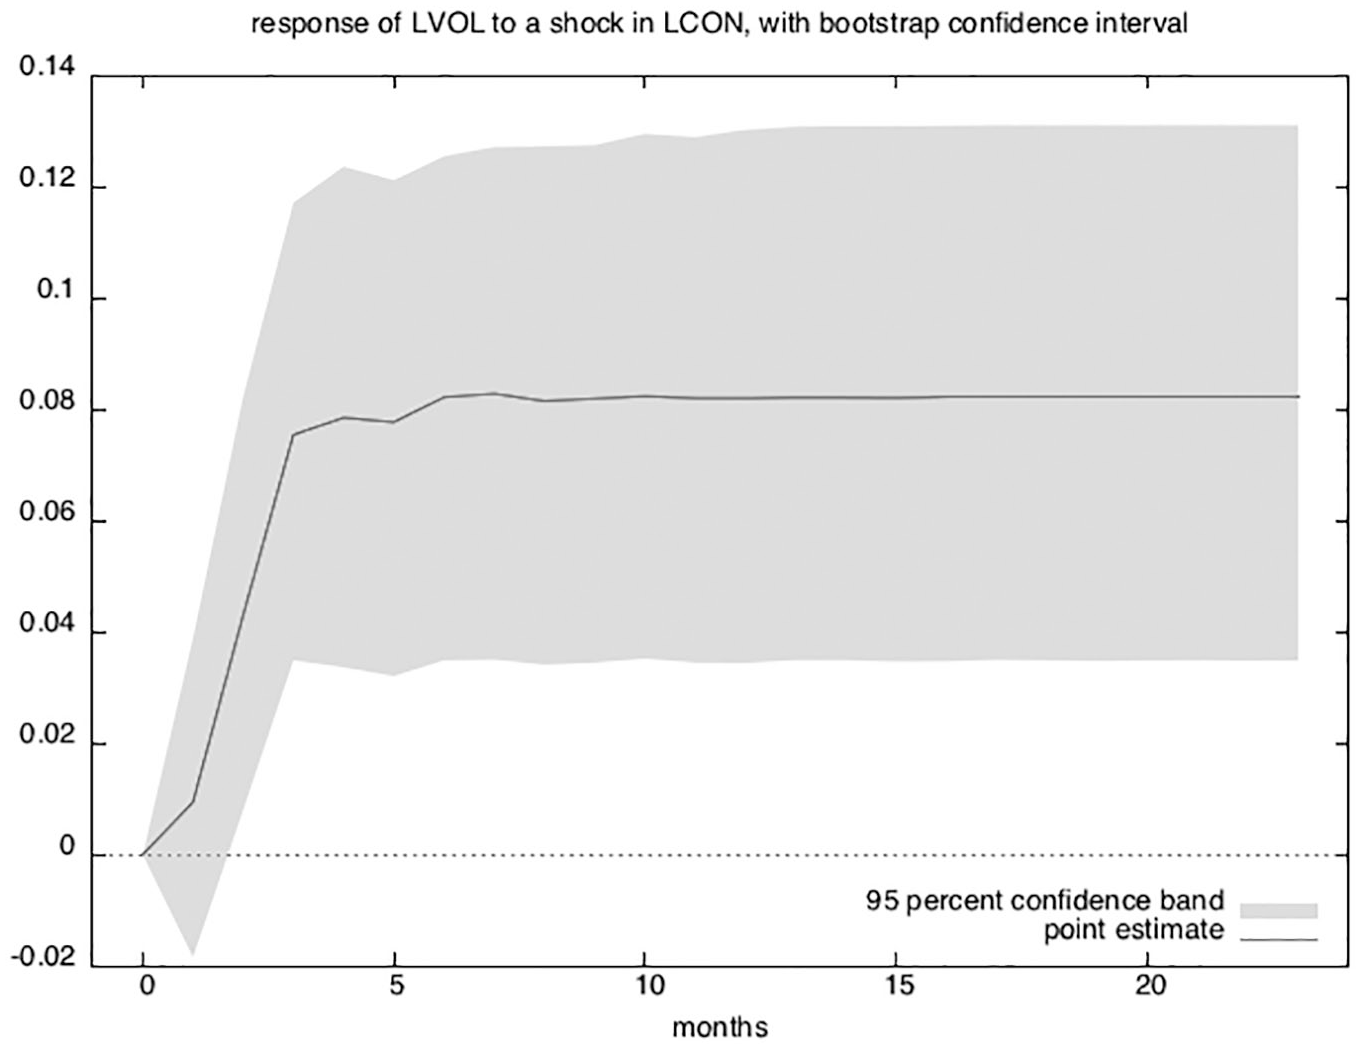
Orthogonalized impulse response (LCON on LVOL).

Orthogonalized impulse response (LVOL on LCON).
Unlike a vector autoregressive model, the variables in a cointegrating VECM are not mean reverting, so the effects of some shocks will not die out over time. This can be clearly seen in the OIRFs from Figures 3 and 4. An increase in language consistency has a long-term permanent effect on trading volume, and similarly, an increase in trading volume appears to have a permanent effect on language consistency. Both variables are “pulling” each other higher in accordance with their long-term average.
The remaining coefficients in Table 4 also provide some evidence of short-term effects. The coefficients prefixed with LD and L2D are the effects of first and second lagged variable differences on themselves and on each other. LCON has a negative short-term effect on LVOL in the first lag and LVOL has a negative short-term effect on LCON in its second lag. The short-term destabilizing effect of an increase in trading volume on language consistency is also apparent in the levels equation (though insignificant at 95% confidence) as can be seen in Figure 4; however, the short-term negative effect of LCON on LVOL in differences is somewhat surprising. If a drop in language consistency is viewed as the arrival of new information, then trading volume could rise if investors use the trading process to converge on a common interpretation of material information (Zuckerman, 2004). However, the effect is transitory—There is no permanent effect on the long-run trend. This suggests a system with the capacity to absorb new information with little if any loss to its overall momentum. The meaning behind this result is discussed further in conclusion and discussion.
Robustness
Cointegration
In the Results section, I dropped the first 2 years of textual data before running the VECM. I justified this step because the vocabulary had nearly doubled during these 2 years as the trade journal ramped up production. However, there is a statistical reason as well. Figure 5 shows predictions from the cointegrating equation after running the VECM on the full range of data. Note the distinct downward trend in the first few years, which violates a model assumption that the cointegrating equation is stationary around mean zero. Regardless, the significance and direction of the reported results hold even when including the first couple of years.

Graph of cointegrating equation including the first 2 years of Bioworld data.
Global Trends
One alternative explanation is that both the language consistency measure and trading volume are both affected by broader market trends. To account for this possibility, I collected monthly trading volume from the New York Stock Exchange website at http://www.nyse.com, and include it in the VECM model denoted LNYSE. The results are shown in Table 5, and both the long-term and short-term relationships between language consistency and biotechnology trading volume still hold. Moreover, there is no cointegrating relationship with LNYSE as the L.ce1 coefficient is not significant for that variable, nor does LNYSE have any significant short-term effects on either of the other two variables.
Results of Vector Error Correction Model Including data from the New York Stock Exchange.

Note. Z statistics in parentheses.
p < .05. **p < .01. ***p < .001.
An Alternative Specification
The measure of language consistency used herein (−KLD) quantifies the amount of information lost when a new frequency distribution Q is used to predict the “true” distribution P. This assumes readers of biotechnology journal articles are evaluating the degree to which the current text is the same or different from their memory of past texts. An alternative construction would assume that readers are instead reevaluating the past given the “true” new information contained in the current text (Murdock et al., 2015). Operationalization of this assumption would condition on Q rather than P yielding,

Both model fit and results remain qualitatively the same when using this alternative construction.
Feature Boundaries
Table 6 shows results for a VECM run when language consistency is based on probability distributions derived from the intersection of 50, 100, 250, 500, 1,000, and 2,000 word stems in the current month (Qt) and the prior three (Pk). That is, I vary the number of features used in the construction of my measure. Model 3 is the same as that presented in the body of this article.
VECM With Different Top X Features.

Note. Standard errors in parentheses.
p < .1. *p < .05. **p < .01. ***p < .001.
By looking at the coefficients prefixed with L.ce1 in each model, we can get a sense of how volume interacts with language consistency over the long term. While the effect of LVOL on LCON is consistently significant across all models, LCON only has a long-term effect on LVOL starting with 250 word stems. This suggests that one needs to account for enough vocabulary that the intersection of Qt and Pk captures features toward the tail of each frequency distribution. This conclusion is further supported by the fact that a measure constructed using the top 2,000 word stems produces the best model fit according to both the Akaike and Bayesian information criterion listed at the bottom of the table. Results are similar for the short-term effect of LCON on LVOL in differences; albeit, there is a statistically significant effect even when only using the top 100 word stems to construct the language consistency measure. I chose to use 1,000 word stems in the main portion of this article as a compromise. Despite the better fit of the 2,000 word model, using fewer words is actually preferred as many corpora have limited vocabulary. Moreover, the method used is further limited by the requirement that vocabulary overlap across time.
Given the number of studies that focus on only a few words and their valence (e.g., Trusov et al., 2009; Xiong & Bharadwaj, 2013), this finding might seem counterintuitive. However, if the long-term relationship between trading volume and language consistency is based on increases in shared understanding, then we should expect stability across a broad swath of descriptive words. Similarly, if the short-term relationship is based on the arrival of new information, then large changes in frequency (i.e., from the head to the tail and vice versa) will be the most surprising. Regardless, all coefficients are in the same direction and of similar magnitude across the models, which should increase confidence in the robustness of the measure.
Table 7 shows results from a VECM that uses a language consistency measure derived from the top 2,000 word stems, but varies the number of months which make up Pk. In other words, I vary the amount of history against which each new month’s frequency distribution is compared. By again looking at the coefficients prefixed with L. ce1, we can see that the long-term effect of LCON on LVOL is not statistically significant until I use 3 months of history. The significant effect persists (at least marginally) until 6 months of history. Results are similar for the short-term effect though only statistically significant using 3- and 4-month histories.
VECM of Top 2,000 Features at Different Moving Averages.

Note. Standard errors in parentheses.
p < .1. *p < .05. **p < .01. ***p < .001.
These limits suggest that there exists a “sweet spot” of working memory against which new information is evaluated and absorbed. When the history is short, the word stem frequencies in Pk do not represent the current dominant trends in language use—There is too much noise. Thus, any deviation from this distribution is uninformative. When the history is long, the word stem frequencies in Pk include information that is obsolete relative to the current trends. Any deviation from this distribution is again uninformative because it is unclear what information the new distribution is deviating from.
Discussion
Limitations
Even though the results presented herein appear robust to a variety of specifications, there still exist several limitations and opportunities for future research. For instance, the particular language consistency measure used is a somewhat crude match for the legitimacy construct. Future research could use parts of speech, sentence structure, and other linguistic features to create a more precise measure.
Another area for future research is related to the interaction between legitimacy and the arrival of new information. If legitimacy is reducing the effort required to trade stocks—that is, new information is easier to interpret—then the spikes in trading volume that result from investors reconciling information with their private valuation models should be shorter in length the more legitimate an industry becomes.
Conclusion
Stock market trading volume can be driven by the establishment of legitimacy and by the arrival of new information. In the current work, these effects occur on different time scales. Legitimacy is established over the long term, whereas new information (or surprise) is acted upon quickly. In the current article, these relationships are explored using a measure of language consistency. As the legitimacy of some behavior increases, the language used to describe that behavior becomes more consistent. Likewise, consistent language gives social actors the means and incentives to engage in the described behavior. However, sharp drops in language consistency are indicative of the arrival of new information as the distribution of vocabulary is changing rapidly. This prompts additional—but short-lived—trading activity, as investors reevaluate their current market positions.
By showing both effects in the same context, this article contributes to our understanding of the relationship between industry news and stock market trading volume. With the growing availability and use of large unstructured textual databases in social science (Tirunillai & Tellis, 2014), understanding this relationship is growing in importance. Consider for instance, the widespread use of sentiment analysis as a way to understand consumer attitudes toward a product or brand. While it is certainly important to understand periodic changes in sentiment, it is also important to pay attention to longer term trends in the way that language is used. In so doing, we gain a richer and more nuanced view of consumer attitudes.
Footnotes
Declaration of Conflicting Interests
The author(s) declared no potential conflicts of interest with respect to the research, authorship, and/or publication of this article.
Funding
The author(s) received no financial support for the research, authorship, and/or publication of this article.